
Automotive Wheel Alignment System Market Size 2025-2029
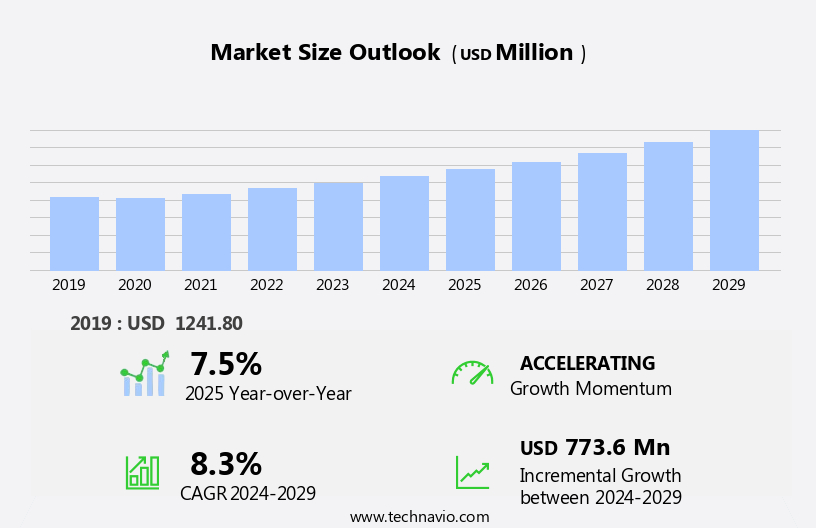
The automotive wheel alignment system market size is forecast to increase by USD 773.6 million at a CAGR of 8.3% between 2024 and 2029.
- The market is experiencing significant growth, driven by the increasing number of vehicles globally. According to industry estimates, the global automotive fleet is projected to reach over 1.5 billion by 2025, creating a vast market for wheel alignment systems. Another key trend influencing market growth is the development of Advanced Driver-Assistance Systems (ADAS) integration in wheel alignment systems. This integration offers enhanced safety features, making wheel alignment systems an essential component of modern vehicles. Moreover, the emergence of Chinese low-cost automotive wheel alignment systems is disrupting the market landscape. These systems offer cost-effective solutions for both OEMs and aftermarket players, making them a viable option for price-sensitive consumers.
- However, challenges such as the high initial investment for advanced wheel alignment systems and the lack of standardization in the market pose significant hurdles for market growth. Companies seeking to capitalize on market opportunities must focus on innovation, cost reduction, and strategic partnerships to navigate these challenges effectively. Additionally, investing in research and development to create advanced, ADAS-ready wheel alignment systems will be crucial for long-term success in the market.
What will be the Size of the Automotive Wheel Alignment System Market during the forecast period?
- The wheel alignment equipment market in the automotive sector is driven by several factors. Poor wheel alignment, which can lead to increased tyre wear and potential accidents, necessitates regular inspection and correction. Regulatory agencies mandate adherence to manufacturer's suggested specifications to ensure vehicle safety. New technology, such as wireless communication for real-time alignment adjustments, streamlines the alignment process. Rising disposable income and the importance of vehicle safety are increasing the demand for wheel alignment services. Characteristics like portability and ease of use further enhance the market's appeal.
- The automobile sector continues to innovate, with vehicle manufacturers integrating advanced technology into their offerings. The need for efficient alignment processes and improved tyre life makes this market a significant trend in the automotive industry.
How is this Automotive Wheel Alignment System Industry segmented?
The automotive wheel alignment system industry research report provides comprehensive data (region-wise segment analysis), with forecasts and estimates in "USD million" for the period 2025-2029, as well as historical data from 2019-2023 for the following segments.
- Application
- Passenger car
- Commercial vehicle
- Type
- CCD WAS
- 3D WAS
- DIY WAS
- Product Type
- Front-wheel drive (FWD)
- Rear-wheel drive (RWD)
- All-wheel drive (AWD)
- Geography
- North America
- US
- Canada
- Europe
- France
- Germany
- Italy
- UK
- Middle East and Africa
- APAC
- China
- India
- Japan
- South Korea
- South America
- Rest of World (ROW)
- North America
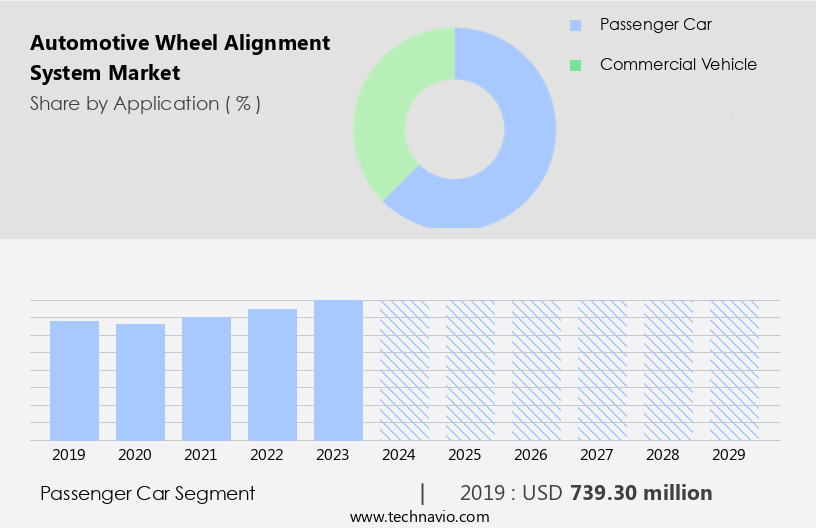
By Application Insights
The passenger car segment is estimated to witness significant growth during the forecast period.
The market is significantly influenced by the passenger car segment, which accounted for the largest share in 2024. This segment's dominance can be attributed to the scalability and application of wheel alignment for lighter vehicles. The increasing disposable income in emerging markets, particularly in Asia Pacific, is driving the high-volume adoption of passenger cars. With major countries like China and Japan already leading the automotive industry in this region, the demand for wheel alignment systems is expected to remain robust. The large population of passenger cars in emerging markets, coupled with poor road conditions, makes vehicles more susceptible to breakdowns.
Consequently, there is a growing demand for repair and maintenance services. Advanced wheel alignment systems, such as four-wheel alignment and camber alignment systems, are increasingly being adopted for precise measurements and accurate readings. These systems ensure proper wheel angles, digital data integration, and preventive maintenance services, contributing to improved vehicle safety and longevity. International competitors and multinational companies are intensifying competition in the market, offering advanced technologies like wireless communication and integrated reference systems. These systems enable real-time monitoring and adjustments, enhancing the overall performance and efficiency of the wheel alignment process. Commercial vehicles, utility vehicles, SUVs, crossovers, multipurpose vehicles, and pickup trucks also utilize wheel alignment systems for optimal suspension performance and tire life.
Regulatory agencies worldwide are emphasizing the importance of regular wheel alignment checks for vehicle safety. As a result, three-dimensional wheel alignment systems, like CCD alignment sensors, are gaining popularity due to their ability to provide precise measurements and alignment time reduction. These advancements are expected to further fuel market growth in the coming years.
Get a glance at the market report of share of various segments Request Free Sample
The Passenger car segment was valued at USD 739.30 million in 2019 and showed a gradual increase during the forecast period.
Regional Analysis
APAC is estimated to contribute 37% to the growth of the global market during the forecast period.Technavio’s analysts have elaborately explained the regional trends and drivers that shape the market during the forecast period.

For more insights on the market size of various regions, Request Free Sample
In the Asia Pacific (APAC) region, China, India, South Korea, and Japan are significant contributors to the revenue in the market. The high sales volume of passenger cars and commercial vehicles in these countries create a substantial potential for market growth. The automotive sector in APAC is expanding rapidly, leading to a high demand for wheel alignment systems to ensure proper wheel angles and digital data measurements for vehicle safety and improved performance. Passenger cars, particularly in the region, are projected to grow faster than other vehicle segments. This trend is attributed to the rising disposable income, increasing preference for multipurpose vehicles (MPVs) and utility vehicles, and the popularity of crossovers and SUVs.
Consequently, the demand for accurate wheel alignment systems is increasing to maintain wheel longevity, enhance suspension, and prevent poor wheel alignment, which can lead to accidents and alignment time-consuming repairs. Regulatory agencies and international competitors are continuously pushing for technical advancements in wheel alignment systems, including new technologies such as four-wheel alignment systems, caster alignment systems, and integrated reference systems. These advancements provide accurate readings and enable wireless communication for preventive maintenance services, ensuring that vehicle manufacturers meet the evolving needs of consumers and regulatory requirements. International companies are entering the market, increasing competition and driving innovation. For instance, Chinese automobile manufacturers are introducing advanced wheel alignment equipment to cater to the growing demand for wheel alignment systems in the region.
Overall, the market in APAC is experiencing significant growth, driven by the increasing demand for passenger cars, commercial vehicles, and the adoption of advanced technologies.
Market Dynamics
Our researchers analyzed the data with 2024 as the base year, along with the key drivers, trends, and challenges. A holistic analysis of drivers will help companies refine their marketing strategies to gain a competitive advantage.
What are the key market drivers leading to the rise in the adoption of Automotive Wheel Alignment System Industry?
- Increasing number of vehicles globally is the key driver of the market.
- The global automotive repair and maintenance market is experiencing growth due to several factors. One significant driver is the increasing lifespan of vehicles, resulting in a larger vehicle population in major automotive markets. This expanding population necessitates an increased demand for automotive repair and maintenance services, thereby fueling market growth. In the US, for instance, the average age of vehicles in use surpassed 12.6 years in 2024.
- This trend signifies a growing need for automotive repair and maintenance services in the country, contributing to the market's expansion.
What are the market trends shaping the Automotive Wheel Alignment System Industry?
- Development of ADAS-ready wheel alignment systems is the upcoming market trend.
- An automotive wheel alignment system is an essential tool for professional automotive repair shops and vehicle owners to ensure the safety and optimal performance of their vehicles. This system enables precise testing and diagnostics of wheel alignment, which is crucial for maintaining fuel efficiency and proper functioning of various automotive components. Moreover, advanced driver assistance systems (ADAS), such as lane keep assist, adaptive cruise control, and advanced emergency braking, rely heavily on accurate wheel alignment.
- These subsystems capture input from the adjusted automotive components during a wheel alignment process. Properly aligned wheels are essential for the effective operation of these advanced safety features, enhancing overall vehicle safety and driving experience.
What challenges does the Automotive Wheel Alignment System Industry face during its growth?
- Chinese low-cost automotive wheel alignment systems is a key challenge affecting the industry growth.
- The Chinese market plays a significant role in the global automotive wheel alignment system industry due to government support for local players. Chinese companies have established a strong presence in regional markets for vehicle accessories and components, making them formidable competitors for international suppliers. The cost advantage of Chinese wheel alignment systems is substantial, with prices starting at around USD1,800 per piece, significantly lower than the USD10,000 and above price range set by international companies.
- This price disparity poses a challenge for international players in the market.
Exclusive Customer Landscape
The automotive wheel alignment system market forecasting report includes the adoption lifecycle of the market, covering from the innovator’s stage to the laggard’s stage. It focuses on adoption rates in different regions based on penetration. Furthermore, the automotive wheel alignment system market report also includes key purchase criteria and drivers of price sensitivity to help companies evaluate and develop their market growth analysis strategies.

Customer Landscape
Key Companies & Market Insights
Companies are implementing various strategies, such as strategic alliances, automotive wheel alignment system market forecast, partnerships, mergers and acquisitions, geographical expansion, and product/service launches, to enhance their presence in the industry.
Alignment Simple Solutions LLC - The company specializes in innovative wheel alignment solutions, including the Elegant Auto Boom, Two Post Lift Wheel Aligner, and Mobi Aligner systems. These advanced technologies ensure precise wheel alignment, enhancing vehicle performance and safety. By utilizing the latest in alignment technology, these systems improve fuel efficiency and prolong tire life. The Elegant Auto Boom system offers flexibility for aligning various vehicle types, while the Two Post Lift Wheel Aligner delivers accuracy through a stable lifting mechanism. The Mobi Aligner is a portable solution, perfect for on-site alignment needs. By prioritizing technology and effectiveness, the company's wheel alignment systems elevate the automotive repair industry.
The industry research and growth report includes detailed analyses of the competitive landscape of the market and information about key companies, including:
- Alignment Simple Solutions LLC
- ATS ELGI
- CEMB Spa
- Dover Corp.
- Fori Automation Inc.
- HAWEKA AG
- Hunter Engineering Co.
- ISN Canada Group Holdings Inc.
- Manatec Electronics Pvt. Ltd.
- Naman Automotive Solutions
- Nussbaum Automotive Solutions LP
- Porsche Automobil Holding SE
- Robert Bosch GmbH
- Sunrise Instruments Pvt. Ltd.
- Tecalemit Garage Equipment Co. Ltd.
- Techfanatics Equipment Ltd.
- Technomatic Automotive Components Pvt. Ltd.
- TechnoVector Group
- The Cartek Group
- Yantai Autenf Automobile Services Co. Ltd.
Qualitative and quantitative analysis of companies has been conducted to help clients understand the wider business environment as well as the strengths and weaknesses of key industry players. Data is qualitatively analyzed to categorize companies as pure play, category-focused, industry-focused, and diversified; it is quantitatively analyzed to categorize companies as dominant, leading, strong, tentative, and weak.
Research Analyst Overview
The market is witnessing significant growth as contemporary automobiles, including passenger cars, crossovers, SUVs, pickup trucks, and commercial vehicles, increasingly rely on advanced alignment systems to ensure optimal vehicle performance and safety. These systems, which utilize cameras and calibration techniques, enable precise measurement and adjustment of wheel angles to enhance tyre life, prevent poor alignment, and improve vehicle handling. International competitors and multinational companies are at the forefront of this technological advancement, offering 3D wheel alignment systems that provide accurate readings and enable real-time adjustments. These systems employ digital data processing and wireless communication to streamline the alignment process, making it more efficient and effective for vehicle repair services.
Regulatory agencies worldwide are also recognizing the importance of wheel alignment in ensuring vehicle safety and longevity. As a result, there is a growing emphasis on preventive maintenance services and the integration of reference systems into vehicle manufacturing processes. Characteristics such as portability, ease of use, and compatibility with various vehicle types are driving the demand for these systems. Moreover, the rising disposable income of consumers and the increasing popularity of automotive parts as aftermarket products are also contributing to the market's growth. The automotive sector is witnessing a shift towards new technology, with four-wheel alignment systems and caster and camber alignment systems gaining popularity.
These systems offer more precise adjustments and improve the overall driving experience. Wheel alignment equipment manufacturers are focusing on developing more advanced and user-friendly systems to cater to the evolving needs of the market. The use of CCD alignment sensors and integrated reference systems is becoming increasingly common, enabling faster and more accurate alignment processes. The market for wheel alignment systems is expected to continue growing as vehicle manufacturers and consumers recognize the importance of proper wheel alignment in ensuring vehicle safety, performance, and longevity. The adoption of new technology and the increasing competition among international companies are also expected to drive innovation and growth in the market.
In the automotive industry, wheel alignment is a critical aspect of vehicle maintenance and repair. Proper alignment ensures that the vehicle's wheels are angled correctly, improving handling, reducing tire wear, and enhancing overall vehicle performance. With the increasing popularity of advanced wheel alignment systems and the growing emphasis on vehicle safety and maintenance, the market for these systems is poised for significant growth in the coming years.
|
Market Scope |
|
|
Report Coverage |
Details |
|
Page number |
216 |
|
Base year |
2024 |
|
Historic period |
2019-2023 |
|
Forecast period |
2025-2029 |
|
Growth momentum & CAGR |
Accelerate at a CAGR of 8.3% |
|
Market growth 2025-2029 |
USD 773.6 million |
|
Market structure |
Fragmented |
|
YoY growth 2024-2025(%) |
7.5 |
|
Key countries |
US, China, Germany, Japan, India, UK, France, Italy, South Korea, and Canada |
|
Competitive landscape |
Leading Companies, Market Positioning of Companies, Competitive Strategies, and Industry Risks |
What are the Key Data Covered in this Automotive Wheel Alignment System Market Research and Growth Report?
- CAGR of the Automotive Wheel Alignment System industry during the forecast period
- Detailed information on factors that will drive the growth and forecasting between 2025 and 2029
- Precise estimation of the size of the market and its contribution of the industry in focus to the parent market
- Accurate predictions about upcoming growth and trends and changes in consumer behaviour
- Growth of the market across APAC, Europe, North America, South America, and Middle East and Africa
- Thorough analysis of the market’s competitive landscape and detailed information about companies
- Comprehensive analysis of factors that will challenge the automotive wheel alignment system market growth of industry companies
We can help! Our analysts can customize this automotive wheel alignment system market research report to meet your requirements.
 RIA -
RIA - 
