Autonomous Crop Management Market Analysis, Size, and Forecast 2024-2028: North America (US and Canada), Europe (France, Germany, Italy, and UK), Middle East and Africa (Egypt, KSA, Oman, and UAE), APAC (China, India, and Japan), South America (Argentina and Brazil), and Rest of World (ROW)

Autonomous Crop Management Market Analysis, Size, and Forecast 2024-2028:
North America (US and Canada), Europe (France, Germany, Italy, and UK), Middle East and Africa (Egypt, KSA, Oman, and UAE), APAC (China, India, and Japan), South America (Argentina and Brazil), and Rest of World (ROW)

Published: Jan 2024 178 Pages SKU: IRTNTR77268

Market Overview at a Glance

$5.76 B
Market Opportunity
10.45%
CAGR
9.95
YoY growth 2023-2024(%)

Autonomous Crop Management Market Size 2024-2028

The autonomous crop management market size is forecast to increase by USD 5.76 billion at a CAGR of 10.45% between 2023 and 2028.

  • The market is experiencing significant growth due to the increasing focus on productivity and efficiency in the agriculture sector. The integration of Artificial Intelligence (AI) and Machine Learning (ML) technologies into autonomous crop management systems is driving this trend, enabling farmers to optimize crop yields and reduce operational costs. However, the high initial investment required for implementing these advanced technologies poses a significant challenge for many farmers and agricultural businesses. Despite this hurdle, the market's potential for innovation and improved agricultural outcomes is substantial. Companies seeking to capitalize on this opportunity should focus on developing cost-effective solutions that cater to the unique needs of various farming sectors and geographies.
  • Additionally, collaborations and partnerships with technology providers, agricultural institutions, and government organizations can help facilitate the adoption of autonomous crop management systems and mitigate the initial investment barrier. Overall, the market represents an exciting and dynamic landscape for businesses and investors alike, offering significant opportunities for innovation and growth in the agriculture sector.

What will be the Size of the Autonomous Crop Management Market during the forecast period?

Autonomous Crop Management Market Size

 Request Free Sample

  • The market continues to evolve, driven by advancements in technology and the growing demand for sustainable agriculture. Farmers are increasingly adopting solutions that leverage artificial intelligence, machine learning, and computer vision to optimize crop yield, improve harvest efficiency, and enhance farm management. Precision spraying and fertilizer management systems enable farmers to apply inputs more effectively, reducing waste and increasing profitability. autonomous vehicles and automated irrigation systems streamline farm operations, while soil health monitoring and variable rate application help improve crop production and reduce environmental impact. Farm management software and digital farming solutions offer real-time data integration, data visualization, and data-driven decision making, allowing farmers to optimize their operations and respond to changing conditions.
  • Drones and satellite imagery provide valuable insights into crop health and growth patterns, enabling farmers to make informed decisions and improve overall farm efficiency. The market for agricultural innovation is diverse, with a range of entities focusing on yield optimization, water conservation, and labor reduction. Smart sensors and GPS guidance systems enable farmers to monitor and manage their fields more effectively, while weather forecasting and disease management solutions help mitigate risks and protect crops. As the market for autonomous crop management continues to unfold, new applications and integrations are emerging. data security and data integration are becoming increasingly important, as farmers seek to protect their valuable agricultural data and leverage it to improve their operations.
  • The integration of carbon sequestration and sustainable agriculture solutions is also gaining momentum, as farmers seek to reduce their environmental footprint and enhance the long-term sustainability of their operations.

How is this Autonomous Crop Management Industry segmented?

The autonomous crop management industry research report provides comprehensive data (region-wise segment analysis), with forecasts and estimates in "USD billion" for the period 2024-2028, as well as historical data from 2018-2022 for the following segments.

  • Component
    • Hardware
    • Software
    • Services
  • Deployment
    • On-premises
    • Cloud-based
  • Technology
    • IoT-Based Systems
    • AI and Machine Learning
    • Robotics
  • Application
    • Precision Irrigation
    • Weed Control
    • Harvesting
  • Crop Type
    • Cereals
    • Fruits and Vegetables
    • Oilseeds
  • Farm Size
    • Large Farms
    • Small and Medium Farms
  • Geography
    • North America
      • US
      • Canada
    • Europe
      • France
      • Germany
      • Italy
      • UK
    • Middle East and Africa
      • Egypt
      • KSA
      • Oman
      • UAE
    • APAC
      • China
      • India
      • Japan
    • South America
      • Argentina
      • Brazil
    • Rest of World (ROW)

By Component Insights

The hardware segment is estimated to witness significant growth during the forecast period.

Autonomous crop management is revolutionizing agriculture through advanced technologies such as yield forecasting, carbon sequestration, and precision farming solutions. Agtech startups leverage satellite imagery and agricultural data to develop crop modeling and Farm Equipment automation, enhancing crop production and optimizing farm profitability. Farmers utilize machine learning, automated irrigation, and precision spraying to implement data-driven decision making, while smart sensors monitor agronomic practices and soil health. Autonomous vehicles and drones enable remote sensing and weather forecasting, reducing labor requirements and optimizing operational cost savings. Computer vision and digital farming facilitate sustainable agriculture through variable rate application, disease management, and pest control.

Farm management software and data visualization tools streamline farm operations and improve farm efficiency. The integration of data security and water conservation technologies ensures the protection of valuable agricultural data and the efficient use of water resources. Overall, the adoption of these innovative technologies propels The market, enhancing crop yield increase, harvest optimization, and fertilizer management.

Autonomous Crop Management Market Size

Request Free Sample

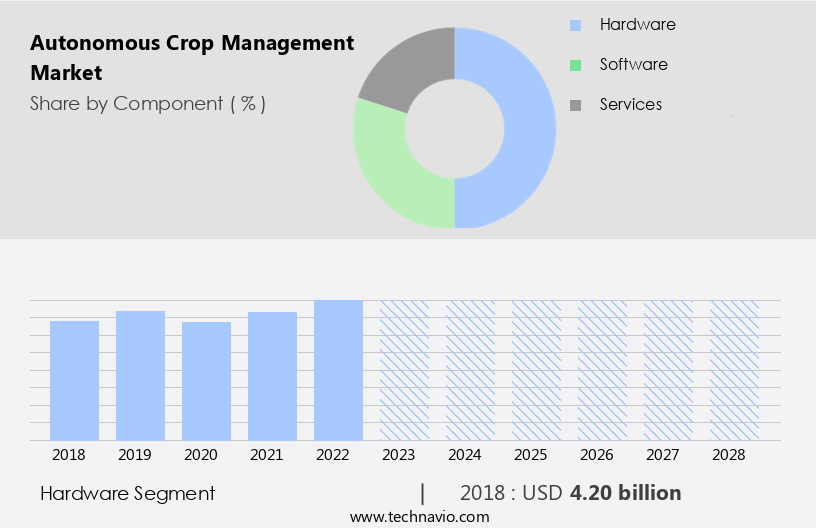
The Hardware segment was valued at USD 4.20 billion in 2018 and showed a gradual increase during the forecast period.

Regional Analysis

North America is estimated to contribute 43% to the growth of the global market during the forecast period.Technavio's analysts have elaborately explained the regional trends and drivers that shape the market during the forecast period.

Autonomous Crop Management Market Share by Geography

 Request Free Sample

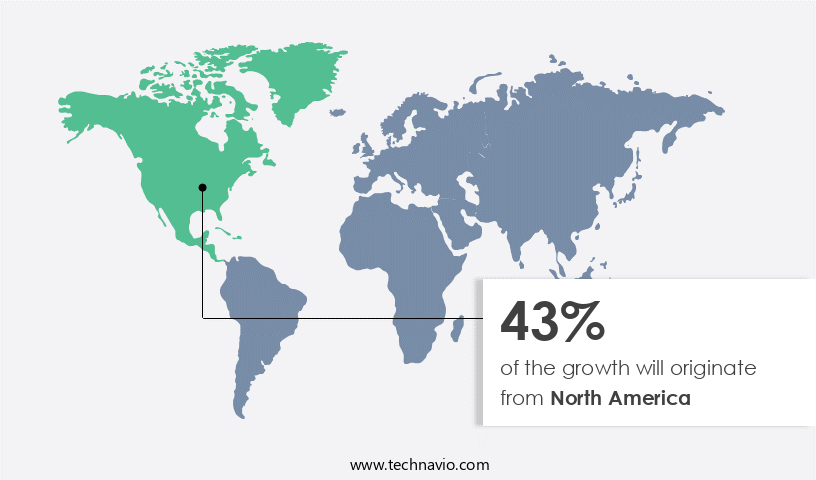
The market in North America is currently leading the global landscape, driven by advanced agricultural technologies, government initiatives, and the rising demand for food production. Cloud-based technology and smart farming techniques are increasingly adopted to boost productivity and efficiency. The National Institute of Food and Agriculture (NIFA), a part of the USDA, promotes geospatial, sensor, and precision technology projects to support farmers. Additionally, the use of artificial intelligence, machine learning, and computer vision in digital farming is gaining traction. Autonomous vehicles, automated irrigation, and precision spraying are transforming farm operations, while variable rate application, soil health monitoring, and fertilizer management optimize crop yield.

Farm management software, data visualization, and data-driven decision making are essential tools for farmers to optimize their farm operations. Data integration and security are crucial aspects of the market, ensuring sustainable agriculture practices. Water conservation, agricultural inputs, and weather forecasting are other key factors contributing to the market's growth. The market's evolution is further fueled by the integration of drone technology, satellite imagery, and precision agriculture solutions. Labor reduction, remote sensing, and pest control are additional benefits that farmers derive from autonomous crop management systems. Overall, the market's future looks promising, with a focus on farm profitability, crop production, and operational cost savings.

Market Dynamics

The Autonomous Crop Management Market is transforming agriculture with AI-driven crop health diagnostics, autonomous weeding robots, and drone-based crop spraying for sustainable farming. Smart irrigation systems and weather-adaptive robots optimize resources, while carbon-neutral farming solutions and eco-friendly automation support organic farming. Blockchain-verified crop data ensures traceability, and low-cost autonomous tractors empower emerging markets. Hyperspectral imaging, real-time yield forecasting, and predictive pest control enhance efficiency for large-scale farms and greenhouse operations. Modular robotic systems with multi-crop robotic compatibility and sustainable sensor networks drive precision agriculture. Digital advisory services and autonomous crop phenotyping benefit research institutes, positioning best autonomous crop management systems for 2025 as leaders in high-yield autonomous farming equipment for cooperatives.

Our researchers analyzed the data with 2023 as the base year, along with the key drivers, trends, and challenges. A holistic analysis of drivers will help companies refine their marketing strategies to gain a competitive advantage.

What are the key market drivers leading to the rise in the adoption of Autonomous Crop Management Industry?

  • The agriculture sector's relentless drive towards enhancing productivity and efficiency serves as the primary catalyst for market growth. 
  • Autonomous crop management is revolutionizing farm operations management by performing tasks with minimal labor, leading to increased productivity and efficiency. This innovation enables farmers to focus on other essential duties and improve their overall business efficiency. The integration of remote sensing, weather forecasting, and precision agriculture technologies in autonomous crop management systems allows for real-time monitoring and analysis of agronomy data, pest control, and field operations. By deploying multiple self-driving vehicles, farmers can benefit from operational cost savings through economies of scale. Agricultural mechanization, including autonomous crop management, is a critical aspect of modernizing agriculture. The efficient utilization of farm implements directly impacts farm productivity.
  • Autonomous crop management systems utilize advanced technologies such as field data analytics to optimize crop yields and reduce the need for human intervention in various farming tasks. These systems also facilitate disease management and pest control, ensuring optimal crop health and reducing the reliance on manual labor. In conclusion, the adoption of autonomous crop management is a significant step towards enhancing farm operations and improving overall business performance.

What are the market trends shaping the Autonomous Crop Management Industry?

  • The integration of Artificial Intelligence (AI) and Machine Learning (ML) technologies is becoming increasingly essential in the field of autonomous crop management. This trend reflects the growing recognition of the potential benefits these technologies offer in optimizing agricultural processes and improving crop yields.
  • Artificial intelligence (AI) and machine learning (ML) are transforming the market by providing advanced capabilities for data collection, processing, and analysis. These technologies enable more precise and effective pest management through real-time interpretation of complex scenarios. In addition, AI and ML can optimize resource usage, maximize crop yields, and analyze soil data. Furthermore, they automate farm management, optimize workflow, and offer valuable insights into animal health and species management. The integration of these technologies is essential for the efficient operation of autonomous tractors and other farm equipment. With the increasing emphasis on agricultural innovation, yield forecasting, carbon sequestration, and precision planting, the use of AI and ML in autonomous crop management is becoming increasingly important for farm profitability and sustainable crop production.
  • Smart sensors and satellite imagery are also key components of autonomous crop management systems, providing real-time data on crop growth and health. Overall, the integration of AI, ML, and other agtech solutions is driving the future of agricultural innovation.

What challenges does the Autonomous Crop Management Industry face during its growth?

  • The high initial investment required for autonomous crop management represents a significant challenge to the industry's growth trajectory. Incorporating advanced technologies such as drones, sensors, and machine learning algorithms into farming operations comes with a substantial upfront cost, potentially hindering the expansion and profitability of agricultural businesses. 
  • Autonomous crop management is gaining traction globally due to its potential to increase crop yield and optimize harvest through advanced technologies. However, the high cost of investment is a significant barrier for farmers, particularly in adopting precision spraying, fertilizer management, automated irrigation, and machine learning-driven farm management software. These tools, while offering benefits such as variable rate application, soil health monitoring, computer vision, and digital farming, come with substantial expenses for software integration, data analytics tools, and training.
  • Consequently, many farmers are hesitant to transition from traditional farming methods due to the financial burden. The cost of these technologies can differ among companies, making it essential for farmers to carefully consider their options before investing.

Exclusive Customer Landscape

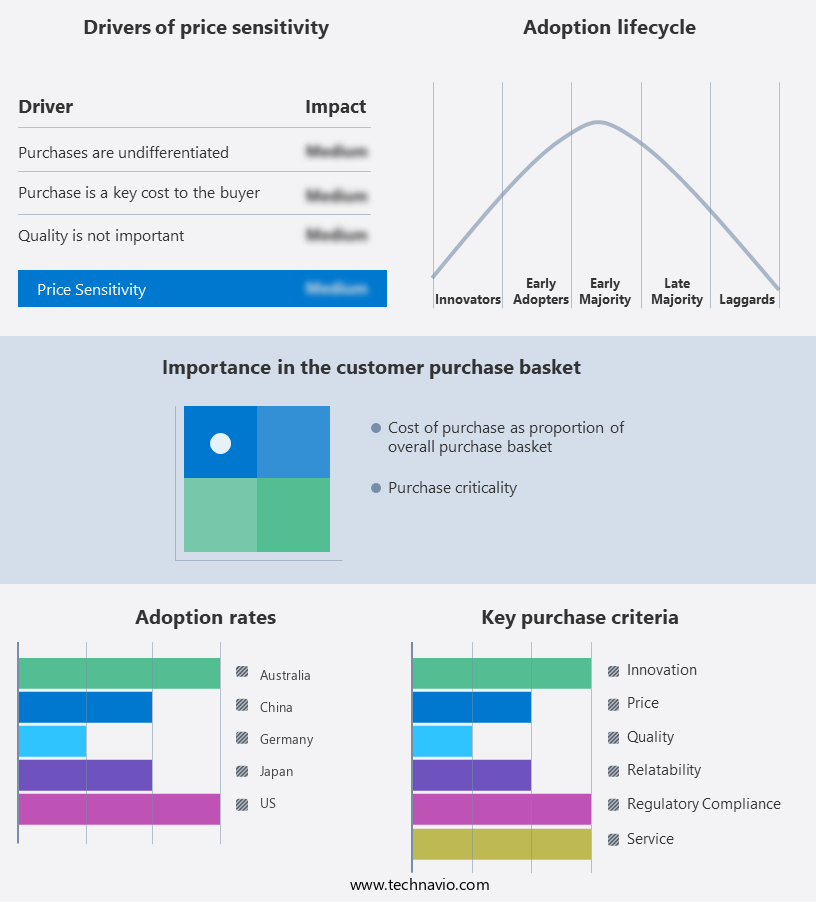
The autonomous crop management market forecasting report includes the adoption lifecycle of the market, covering from the innovator's stage to the laggard's stage. It focuses on adoption rates in different regions based on penetration. Furthermore, the autonomous crop management market report also includes key purchase criteria and drivers of price sensitivity to help companies evaluate and develop their market growth analysis strategies.

Autonomous Crop Management Market Share by Geography

 Customer Landscape

Key Companies & Market Insights

Companies are implementing various strategies, such as strategic alliances, autonomous crop management market forecast, partnerships, mergers and acquisitions, geographical expansion, and product/service launches, to enhance their presence in the industry.

AGCO Corp. - The company delivers advanced crop management solutions through the integration of digital technologies, including the Internet of Things, big data analytics, and industry expertise.

The industry research and growth report includes detailed analyses of the competitive landscape of the market and information about key companies, including:

  • AGCO Corp.
  • AgJunction Inc.
  • BASF SE
  • Bayer AG
  • CNH Industrial NV
  • CropX Inc.
  • Deere & Company
  • DJI
  • Farm-ng
  • Kubota Corp.
  • Monsanto Co.
  • Naio Technologies
  • PrecisionHawk Inc.
  • Raven Industries Inc.
  • Syngenta AG
  • TeeJet Technologies
  • Topcon Corp.
  • Trimble Inc.
  • XAG Co. Ltd.
  • Yanmar Co. Ltd.

Qualitative and quantitative analysis of companies has been conducted to help clients understand the wider business environment as well as the strengths and weaknesses of key industry players. Data is qualitatively analyzed to categorize companies as pure play, category-focused, industry-focused, and diversified; it is quantitatively analyzed to categorize companies as dominant, leading, strong, tentative, and weak.

Recent Development and News in Autonomous Crop Management Market

  • In February 2024, John Deere, a leading agriculture machinery manufacturer, introduced its new Autonomous Tractor System, marking a significant leap in autonomous crop management technology (John Deere press release). This system, which utilizes GPS guidance and machine learning algorithms, enables tractors to operate without human intervention, reducing labor costs and increasing efficiency.
  • In May 2025, Microsoft and Trimble, a technology provider for agriculture, announced a strategic partnership to integrate Microsoft's Azure IoT and AI capabilities with Trimble's AgSense platform (Microsoft News Center). This collaboration aims to provide farmers with real-time insights and predictive analytics, enhancing crop management and yield optimization.
  • In August 2024, Bosch and PrecisionHawk, a drone technology company, announced a strategic partnership to offer integrated drone solutions for precision agriculture (Bosch press release). This collaboration combines Bosch's sensor technology with PrecisionHawk's Drone Services, providing farmers with high-resolution imagery and data analysis for crop health monitoring and management.
  • In November 2024, the European Union approved the use of fully autonomous tractors in agricultural operations, marking a major regulatory milestone for the market (European Commission press release). This approval is expected to accelerate the adoption of autonomous technology in European agriculture, driving market growth.

Research Analyst Overview

The market is experiencing significant growth, driven by the integration of precision agriculture technologies and data-driven agronomy. Farmers are increasingly adopting solutions like precision tillage, inventory management, and automated harvesting to optimize crop yields and reduce operational costs. smart agriculture practices, including pest identification, harvest timing, and soil moisture monitoring, are also gaining popularity. Autonomous tractors, agricultural robotics, and drones are revolutionizing farm consulting, enabling data-driven agriculture and sustainable farming practices. Precision irrigation, field mapping, and anagricultural technology trends, such as agronomic modeling and automated spraying, are essential components of this transformation. Indoor agriculture and vertical farming are emerging trends, offering opportunities for year-round production and climate change mitigation.

Disease diagnosis, plant health analysis, and animal health monitoring are critical aspects of precision livestock management. Supply chain optimization is another area of focus, with farmers leveraging technology to streamline operations and improve farm sustainability. The future of farming lies in the integration of these advanced technologies and the adoption of sustainable farming practices.

Dive into Technavio's robust research methodology, blending expert interviews, extensive data synthesis, and validated models for unparalleled Autonomous Crop Management Market insights. See full methodology.

Market Scope

Report Coverage

Details

Page number

178

Base year

2023

Historic period

2018-2022

Forecast period

2024-2028

Growth momentum & CAGR

Accelerate at a CAGR of 10.45%

Market growth 2024-2028

USD 5.76 billion

Market structure

Fragmented

YoY growth 2023-2024(%)

9.95

Key countries

US, Canada, Germany, UK, Italy, France, China, India, Japan, Brazil, Egypt, UAE, Oman, Argentina, KSA, UAE, Brazil, and Rest of World (ROW)

Competitive landscape

Leading Companies, Market Positioning of Companies, Competitive Strategies, and Industry Risks

Request Free Sample

What are the Key Data Covered in this Autonomous Crop Management Market Research and Growth Report?

  • CAGR of the Autonomous Crop Management industry during the forecast period
  • Detailed information on factors that will drive the growth and forecasting between 2024 and 2028
  • Precise estimation of the size of the market and its contribution of the industry in focus to the parent market
  • Accurate predictions about upcoming growth and trends and changes in consumer behaviour
  • Growth of the market across North America, Europe, APAC, South America, and Middle East and Africa
  • Thorough analysis of the market's competitive landscape and detailed information about companies
  • Comprehensive analysis of factors that will challenge the autonomous crop management market growth of industry companies

We can help! Our analysts can customize this autonomous crop management market research report to meet your requirements.

Get in touch

1 Executive Summary

  • 1.1 Market overview
    • Exhibit 01: Executive Summary – Chart on Market Overview
    • Exhibit 02: Executive Summary – Data Table on Market Overview
    • Exhibit 03: Executive Summary – Chart on Global Market Characteristics
    • Exhibit 04: Executive Summary – Chart on Market by Geography
    • Exhibit 05: Executive Summary – Chart on Market Segmentation by Component
    • Exhibit 06: Executive Summary – Chart on Market Segmentation by Deployment
    • Exhibit 07: Executive Summary – Chart on Incremental Growth
    • Exhibit 08: Executive Summary – Data Table on Incremental Growth
    • Exhibit 09: Executive Summary – Chart on Vendor Market Positioning

2 Market Landscape

  • 2.1 Market ecosystem
    • Exhibit 10: Parent market
    • Exhibit 11: Market Characteristics

3 Market Sizing

  • 3.1 Market definition
    • Exhibit 12: Offerings of vendors included in the market definition
  • 3.2 Market segment analysis
    • Exhibit 13: Market segments
  • 3.3 Market size 2023
    • 3.4 Market outlook: Forecast for 2023-2028
      • Exhibit 14: Chart on Global - Market size and forecast 2023-2028 ($ million)
      • Exhibit 15: Data Table on Global - Market size and forecast 2023-2028 ($ million)
      • Exhibit 16: Chart on Global Market: Year-over-year growth 2023-2028 (%)
      • Exhibit 17: Data Table on Global Market: Year-over-year growth 2023-2028 (%)

    4 Historic Market Size

    • 4.1 Global autonomous crop management market 2018 - 2022
      • Exhibit 18: Historic Market Size – Data Table on global autonomous crop management market 2018 - 2022 ($ million)
    • 4.2 Component Segment Analysis 2018 - 2022
      • Exhibit 19: Historic Market Size – Component Segment 2018 - 2022 ($ million)
    • 4.3 Deployment Segment Analysis 2018 - 2022
      • Exhibit 20: Historic Market Size – Deployment Segment 2018 - 2022 ($ million)
    • 4.4 Geography Segment Analysis 2018 - 2022
      • Exhibit 21: Historic Market Size – Geography Segment 2018 - 2022 ($ million)
    • 4.5 Country Segment Analysis 2018 - 2022
      • Exhibit 22: Historic Market Size – Country Segment 2018 - 2022 ($ million)

    5 Five Forces Analysis

    • 5.1 Five forces summary
      • Exhibit 23: Five forces analysis - Comparison between 2023 and 2028
    • 5.2 Bargaining power of buyers
      • Exhibit 24: Chart on Bargaining power of buyers – Impact of key factors 2023 and 2028
    • 5.3 Bargaining power of suppliers
      • Exhibit 25: Bargaining power of suppliers – Impact of key factors in 2023 and 2028
    • 5.4 Threat of new entrants
      • Exhibit 26: Threat of new entrants – Impact of key factors in 2023 and 2028
    • 5.5 Threat of substitutes
      • Exhibit 27: Threat of substitutes – Impact of key factors in 2023 and 2028
    • 5.6 Threat of rivalry
      • Exhibit 28: Threat of rivalry – Impact of key factors in 2023 and 2028
    • 5.7 Market condition
      • Exhibit 29: Chart on Market condition - Five forces 2023 and 2028

    6 Market Segmentation by Component

    • 6.1 Market segments
      • Chart on Component - Market share (2023-2028) (%)
      • Data Table on Component - Market share (2023-2028) (%)
    • 6.2 Comparison by Component
      • Chart on Comparison by Component
      • Data Table on Comparison by Component
    • 6.3 Hardware - Market size and forecast (2023-2028)
      • Chart on Hardware - Market size and forecast (2023-2028) ($ million)
      • Data Table on Hardware - Market size and forecast (2023-2028) ($ million)
      • Chart on Hardware - Year-over-year growth (2023-2028) (%)
      • Data Table on Hardware - Year-over-year growth (2023-2028) (%)
    • 6.4 Software - Market size and forecast (2023-2028)
      • Chart on Software - Market size and forecast (2023-2028) ($ million)
      • Data Table on Software - Market size and forecast (2023-2028) ($ million)
      • Chart on Software - Year-over-year growth (2023-2028) (%)
      • Data Table on Software - Year-over-year growth (2023-2028) (%)
    • 6.5 Services - Market size and forecast (2023-2028)
      • Chart on Services - Market size and forecast (2023-2028) ($ million)
      • Data Table on Services - Market size and forecast (2023-2028) ($ million)
      • Chart on Services - Year-over-year growth (2023-2028) (%)
      • Data Table on Services - Year-over-year growth (2023-2028) (%)
    • 6.6 Market opportunity by Component
      • Market opportunity by Component ($ million)
      • Data Table on Market opportunity by Component ($ million)

    7 Market Segmentation by Deployment

    • 7.1 Market segments
      • Chart on Deployment - Market share (2023-2028) (%)
      • Data Table on Deployment - Market share (2023-2028) (%)
    • 7.2 Comparison by Deployment
      • Chart on Comparison by Deployment
      • Data Table on Comparison by Deployment
    • 7.3 On-premises - Market size and forecast (2023-2028)
      • Chart on On-premises - Market size and forecast (2023-2028) ($ million)
      • Data Table on On-premises - Market size and forecast (2023-2028) ($ million)
      • Chart on On-premises - Year-over-year growth (2023-2028) (%)
      • Data Table on On-premises - Year-over-year growth (2023-2028) (%)
    • 7.4 Cloud-based - Market size and forecast (2023-2028)
      • Chart on Cloud-based - Market size and forecast (2023-2028) ($ million)
      • Data Table on Cloud-based - Market size and forecast (2023-2028) ($ million)
      • Chart on Cloud-based - Year-over-year growth (2023-2028) (%)
      • Data Table on Cloud-based - Year-over-year growth (2023-2028) (%)
    • 7.5 Market opportunity by Deployment
      • Market opportunity by Deployment ($ million)
      • Data Table on Market opportunity by Deployment ($ million)

    8 Market Segmentation by Technology

    • 8.1 Market segments
      • Chart on Technology - Market share (2023-2028) (%)
      • Data Table on Technology - Market share (2023-2028) (%)
    • 8.2 Comparison by Technology
      • Chart on Comparison by Technology
      • Data Table on Comparison by Technology
    • 8.3 IoT-Based Systems - Market size and forecast (2023-2028)
      • Chart on IoT-Based Systems - Market size and forecast (2023-2028) ($ million)
      • Data Table on IoT-Based Systems - Market size and forecast (2023-2028) ($ million)
      • Chart on IoT-Based Systems - Year-over-year growth (2023-2028) (%)
      • Data Table on IoT-Based Systems - Year-over-year growth (2023-2028) (%)
    • 8.4 AI and Machine Learning - Market size and forecast (2023-2028)
      • Chart on AI and Machine Learning - Market size and forecast (2023-2028) ($ million)
      • Data Table on AI and Machine Learning - Market size and forecast (2023-2028) ($ million)
      • Chart on AI and Machine Learning - Year-over-year growth (2023-2028) (%)
      • Data Table on AI and Machine Learning - Year-over-year growth (2023-2028) (%)
    • 8.5 Robotics - Market size and forecast (2023-2028)
      • Chart on Robotics - Market size and forecast (2023-2028) ($ million)
      • Data Table on Robotics - Market size and forecast (2023-2028) ($ million)
      • Chart on Robotics - Year-over-year growth (2023-2028) (%)
      • Data Table on Robotics - Year-over-year growth (2023-2028) (%)
    • 8.6 Market opportunity by Technology
      • Market opportunity by Technology ($ million)
      • Data Table on Market opportunity by Technology ($ million)

    9 Market Segmentation by Application

    • 9.1 Market segments
      • Chart on Application - Market share (2023-2028) (%)
      • Data Table on Application - Market share (2023-2028) (%)
    • 9.2 Comparison by Application
      • Chart on Comparison by Application
      • Data Table on Comparison by Application
    • 9.3 Precision Irrigation - Market size and forecast (2023-2028)
      • Chart on Precision Irrigation - Market size and forecast (2023-2028) ($ million)
      • Data Table on Precision Irrigation - Market size and forecast (2023-2028) ($ million)
      • Chart on Precision Irrigation - Year-over-year growth (2023-2028) (%)
      • Data Table on Precision Irrigation - Year-over-year growth (2023-2028) (%)
    • 9.4 Weed Control - Market size and forecast (2023-2028)
      • Chart on Weed Control - Market size and forecast (2023-2028) ($ million)
      • Data Table on Weed Control - Market size and forecast (2023-2028) ($ million)
      • Chart on Weed Control - Year-over-year growth (2023-2028) (%)
      • Data Table on Weed Control - Year-over-year growth (2023-2028) (%)
    • 9.5 Harvesting - Market size and forecast (2023-2028)
      • Chart on Harvesting - Market size and forecast (2023-2028) ($ million)
      • Data Table on Harvesting - Market size and forecast (2023-2028) ($ million)
      • Chart on Harvesting - Year-over-year growth (2023-2028) (%)
      • Data Table on Harvesting - Year-over-year growth (2023-2028) (%)
    • 9.6 Market opportunity by Application
      • Market opportunity by Application ($ million)
      • Data Table on Market opportunity by Application ($ million)

    10 Market Segmentation by Crop Type

    • 10.1 Market segments
      • Chart on Crop Type - Market share (2023-2028) (%)
      • Data Table on Crop Type - Market share (2023-2028) (%)
    • 10.2 Comparison by Crop Type
      • Chart on Comparison by Crop Type
      • Data Table on Comparison by Crop Type
    • 10.3 Cereals - Market size and forecast (2023-2028)
      • Chart on Cereals - Market size and forecast (2023-2028) ($ million)
      • Data Table on Cereals - Market size and forecast (2023-2028) ($ million)
      • Chart on Cereals - Year-over-year growth (2023-2028) (%)
      • Data Table on Cereals - Year-over-year growth (2023-2028) (%)
    • 10.4 Fruits and Vegetables - Market size and forecast (2023-2028)
      • Chart on Fruits and Vegetables - Market size and forecast (2023-2028) ($ million)
      • Data Table on Fruits and Vegetables - Market size and forecast (2023-2028) ($ million)
      • Chart on Fruits and Vegetables - Year-over-year growth (2023-2028) (%)
      • Data Table on Fruits and Vegetables - Year-over-year growth (2023-2028) (%)
    • 10.5 Oilseeds - Market size and forecast (2023-2028)
      • Chart on Oilseeds - Market size and forecast (2023-2028) ($ million)
      • Data Table on Oilseeds - Market size and forecast (2023-2028) ($ million)
      • Chart on Oilseeds - Year-over-year growth (2023-2028) (%)
      • Data Table on Oilseeds - Year-over-year growth (2023-2028) (%)
    • 10.6 Market opportunity by Crop Type
      • Market opportunity by Crop Type ($ million)
      • Data Table on Market opportunity by Crop Type ($ million)

    11 Market Segmentation by Farm Size

    • 11.1 Market segments
      • Chart on Farm Size - Market share (2023-2028) (%)
      • Data Table on Farm Size - Market share (2023-2028) (%)
    • 11.2 Comparison by Farm Size
      • Chart on Comparison by Farm Size
      • Data Table on Comparison by Farm Size
    • 11.3 Large Farms - Market size and forecast (2023-2028)
      • Chart on Large Farms - Market size and forecast (2023-2028) ($ million)
      • Data Table on Large Farms - Market size and forecast (2023-2028) ($ million)
      • Chart on Large Farms - Year-over-year growth (2023-2028) (%)
      • Data Table on Large Farms - Year-over-year growth (2023-2028) (%)
    • 11.4 Small and Medium Farms - Market size and forecast (2023-2028)
      • Chart on Small and Medium Farms - Market size and forecast (2023-2028) ($ million)
      • Data Table on Small and Medium Farms - Market size and forecast (2023-2028) ($ million)
      • Chart on Small and Medium Farms - Year-over-year growth (2023-2028) (%)
      • Data Table on Small and Medium Farms - Year-over-year growth (2023-2028) (%)
    • 11.5 Market opportunity by Farm Size
      • Market opportunity by Farm Size ($ million)
      • Data Table on Market opportunity by Farm Size ($ million)

    8 Customer Landscape

    • 8.1 Customer landscape overview
      • Exhibit 62: Analysis of price sensitivity, lifecycle, customer purchase basket, adoption rates, and purchase criteria

    9 Geographic Landscape

    • 9.1 Geographic segmentation
      • Exhibit 63: Chart on Market share by geography 2023-2028 (%)
      • Exhibit 64: Data Table on Market share by geography 2023-2028 (%)
    • 9.2 Geographic comparison
      • Exhibit 65: Chart on Geographic comparison
      • Exhibit 66: Data Table on Geographic comparison
    • 9.3 North America - Market size and forecast 2023-2028
      • Exhibit 67: Chart on North America - Market size and forecast 2023-2028 ($ million)
      • Exhibit 68: Data Table on North America - Market size and forecast 2023-2028 ($ million)
      • Exhibit 69: Chart on North America - Year-over-year growth 2023-2028 (%)
      • Exhibit 70: Data Table on North America - Year-over-year growth 2023-2028 (%)
    • 9.4 Europe - Market size and forecast 2023-2028
      • Exhibit 71: Chart on Europe - Market size and forecast 2023-2028 ($ million)
      • Exhibit 72: Data Table on Europe - Market size and forecast 2023-2028 ($ million)
      • Exhibit 73: Chart on Europe - Year-over-year growth 2023-2028 (%)
      • Exhibit 74: Data Table on Europe - Year-over-year growth 2023-2028 (%)
    • 9.5 APAC - Market size and forecast 2023-2028
      • Exhibit 75: Chart on APAC - Market size and forecast 2023-2028 ($ million)
      • Exhibit 76: Data Table on APAC - Market size and forecast 2023-2028 ($ million)
      • Exhibit 77: Chart on APAC - Year-over-year growth 2023-2028 (%)
      • Exhibit 78: Data Table on APAC - Year-over-year growth 2023-2028 (%)
    • 9.6 South America - Market size and forecast 2023-2028
      • Exhibit 79: Chart on South America - Market size and forecast 2023-2028 ($ million)
      • Exhibit 80: Data Table on South America - Market size and forecast 2023-2028 ($ million)
      • Exhibit 81: Chart on South America - Year-over-year growth 2023-2028 (%)
      • Exhibit 82: Data Table on South America - Year-over-year growth 2023-2028 (%)
    • 9.7 Middle East and Africa - Market size and forecast 2023-2028
      • Exhibit 83: Chart on Middle East and Africa - Market size and forecast 2023-2028 ($ million)
      • Exhibit 84: Data Table on Middle East and Africa - Market size and forecast 2023-2028 ($ million)
      • Exhibit 85: Chart on Middle East and Africa - Year-over-year growth 2023-2028 (%)
      • Exhibit 86: Data Table on Middle East and Africa - Year-over-year growth 2023-2028 (%)
    • 9.8 US - Market size and forecast 2023-2028
      • Exhibit 87: Chart on US - Market size and forecast 2023-2028 ($ million)
      • Exhibit 88: Data Table on US - Market size and forecast 2023-2028 ($ million)
      • Exhibit 89: Chart on US - Year-over-year growth 2023-2028 (%)
      • Exhibit 90: Data Table on US - Year-over-year growth 2023-2028 (%)
    • 9.9 Germany - Market size and forecast 2023-2028
      • Exhibit 91: Chart on Germany - Market size and forecast 2023-2028 ($ million)
      • Exhibit 92: Data Table on Germany - Market size and forecast 2023-2028 ($ million)
      • Exhibit 93: Chart on Germany - Year-over-year growth 2023-2028 (%)
      • Exhibit 94: Data Table on Germany - Year-over-year growth 2023-2028 (%)
    • 9.10 China - Market size and forecast 2023-2028
      • Exhibit 95: Chart on China - Market size and forecast 2023-2028 ($ million)
      • Exhibit 96: Data Table on China - Market size and forecast 2023-2028 ($ million)
      • Exhibit 97: Chart on China - Year-over-year growth 2023-2028 (%)
      • Exhibit 98: Data Table on China - Year-over-year growth 2023-2028 (%)
    • 9.11 Australia - Market size and forecast 2023-2028
      • Exhibit 99: Chart on Australia - Market size and forecast 2023-2028 ($ million)
      • Exhibit 100: Data Table on Australia - Market size and forecast 2023-2028 ($ million)
      • Exhibit 101: Chart on Australia - Year-over-year growth 2023-2028 (%)
      • Exhibit 102: Data Table on Australia - Year-over-year growth 2023-2028 (%)
    • 9.12 Japan - Market size and forecast 2023-2028
      • Exhibit 103: Chart on Japan - Market size and forecast 2023-2028 ($ million)
      • Exhibit 104: Data Table on Japan - Market size and forecast 2023-2028 ($ million)
      • Exhibit 105: Chart on Japan - Year-over-year growth 2023-2028 (%)
      • Exhibit 106: Data Table on Japan - Year-over-year growth 2023-2028 (%)
    • 9.13 Market opportunity by geography
      • Exhibit 107: Market opportunity by geography ($ million)
      • Exhibit 108: Data Tables on Market opportunity by geography ($ million)
    • 13.14 Canada - Market size and forecast (2023-2028)
      • Chart on Canada - Market size and forecast (2023-2028) ($ million)
      • Data Table on Canada - Market size and forecast (2023-2028) ($ million)
      • Chart on Canada - Year-over-year growth (2023-2028) (%)
      • Data Table on Canada - Year-over-year growth (2023-2028) (%)
    • 13.15 UK - Market size and forecast (2023-2028)
      • Chart on UK - Market size and forecast (2023-2028) ($ million)
      • Data Table on UK - Market size and forecast (2023-2028) ($ million)
      • Chart on UK - Year-over-year growth (2023-2028) (%)
      • Data Table on UK - Year-over-year growth (2023-2028) (%)
    • 13.16 Italy - Market size and forecast (2023-2028)
      • Chart on Italy - Market size and forecast (2023-2028) ($ million)
      • Data Table on Italy - Market size and forecast (2023-2028) ($ million)
      • Chart on Italy - Year-over-year growth (2023-2028) (%)
      • Data Table on Italy - Year-over-year growth (2023-2028) (%)
    • 13.17 France - Market size and forecast (2023-2028)
      • Chart on France - Market size and forecast (2023-2028) ($ million)
      • Data Table on France - Market size and forecast (2023-2028) ($ million)
      • Chart on France - Year-over-year growth (2023-2028) (%)
      • Data Table on France - Year-over-year growth (2023-2028) (%)
    • 13.18 India - Market size and forecast (2023-2028)
      • Chart on India - Market size and forecast (2023-2028) ($ million)
      • Data Table on India - Market size and forecast (2023-2028) ($ million)
      • Chart on India - Year-over-year growth (2023-2028) (%)
      • Data Table on India - Year-over-year growth (2023-2028) (%)
    • 13.19 Brazil - Market size and forecast (2023-2028)
      • Chart on Brazil - Market size and forecast (2023-2028) ($ million)
      • Data Table on Brazil - Market size and forecast (2023-2028) ($ million)
      • Chart on Brazil - Year-over-year growth (2023-2028) (%)
      • Data Table on Brazil - Year-over-year growth (2023-2028) (%)
    • 13.20 Egypt - Market size and forecast (2023-2028)
      • Chart on Egypt - Market size and forecast (2023-2028) ($ million)
      • Data Table on Egypt - Market size and forecast (2023-2028) ($ million)
      • Chart on Egypt - Year-over-year growth (2023-2028) (%)
      • Data Table on Egypt - Year-over-year growth (2023-2028) (%)
    • 13.21 UAE - Market size and forecast (2023-2028)
      • Chart on UAE - Market size and forecast (2023-2028) ($ million)
      • Data Table on UAE - Market size and forecast (2023-2028) ($ million)
      • Chart on UAE - Year-over-year growth (2023-2028) (%)
      • Data Table on UAE - Year-over-year growth (2023-2028) (%)
    • 13.22 Oman - Market size and forecast (2023-2028)
      • Chart on Oman - Market size and forecast (2023-2028) ($ million)
      • Data Table on Oman - Market size and forecast (2023-2028) ($ million)
      • Chart on Oman - Year-over-year growth (2023-2028) (%)
      • Data Table on Oman - Year-over-year growth (2023-2028) (%)
    • 13.23 Argentina - Market size and forecast (2023-2028)
      • Chart on Argentina - Market size and forecast (2023-2028) ($ million)
      • Data Table on Argentina - Market size and forecast (2023-2028) ($ million)
      • Chart on Argentina - Year-over-year growth (2023-2028) (%)
      • Data Table on Argentina - Year-over-year growth (2023-2028) (%)
    • 13.24 KSA - Market size and forecast (2023-2028)
      • Chart on KSA - Market size and forecast (2023-2028) ($ million)
      • Data Table on KSA - Market size and forecast (2023-2028) ($ million)
      • Chart on KSA - Year-over-year growth (2023-2028) (%)
      • Data Table on KSA - Year-over-year growth (2023-2028) (%)
    • 13.25 Rest of World (ROW) - Market size and forecast (2023-2028)
      • Chart on Rest of World (ROW) - Market size and forecast (2023-2028) ($ million)
      • Data Table on Rest of World (ROW) - Market size and forecast (2023-2028) ($ million)
      • Chart on Rest of World (ROW) - Year-over-year growth (2023-2028) (%)
      • Data Table on Rest of World (ROW) - Year-over-year growth (2023-2028) (%)

    10 Drivers, Challenges, and Trends

    • 10.1 Market drivers
      • 10.2 Market challenges
        • 10.3 Impact of drivers and challenges
          • Exhibit 109: Impact of drivers and challenges in 2023 and 2028
        • 10.4 Market trends

          11 Vendor Landscape

          • 11.1 Overview
            • 11.2 Vendor landscape
              • Exhibit 110: Overview on Criticality of inputs and Factors of differentiation
            • 11.3 Landscape disruption
              • Exhibit 111: Overview on factors of disruption
            • 11.4 Industry risks
              • Exhibit 112: Impact of key risks on business

            16 Competitive Analysis

            • 16.1 Companies profiled
              • Companies covered
            • 16.2 Market positioning of companies
              • Matrix on companies position and classification
            • 16.3 AGCO Corp.
              • AGCO Corp. - Overview
              • AGCO Corp. - Product / Service
              • AGCO Corp. - Key offerings
            • 16.4 AgJunction Inc.
              • AgJunction Inc. - Overview
              • AgJunction Inc. - Product / Service
              • AgJunction Inc. - Key offerings
            • 16.5 BASF SE
              • BASF SE - Overview
              • BASF SE - Product / Service
              • BASF SE - Key offerings
            • 16.6 Bayer AG
              • Bayer AG - Overview
              • Bayer AG - Product / Service
              • Bayer AG - Key offerings
            • 16.7 CNH Industrial NV
              • CNH Industrial NV - Overview
              • CNH Industrial NV - Product / Service
              • CNH Industrial NV - Key offerings
            • 16.8 CropX Inc.
              • CropX Inc. - Overview
              • CropX Inc. - Product / Service
              • CropX Inc. - Key offerings
            • 16.9 Deere & Company
              • Deere & Company - Overview
              • Deere & Company - Product / Service
              • Deere & Company - Key offerings
            • 16.10 DJI
              • DJI - Overview
              • DJI - Product / Service
              • DJI - Key offerings
            • 16.11 Farm-ng
              • Farm-ng - Overview
              • Farm-ng - Product / Service
              • Farm-ng - Key offerings
            • 16.12 Kubota Corp.
              • Kubota Corp. - Overview
              • Kubota Corp. - Product / Service
              • Kubota Corp. - Key offerings
            • 16.13 Monsanto Co.
              • Monsanto Co. - Overview
              • Monsanto Co. - Product / Service
              • Monsanto Co. - Key offerings
            • 16.14 Naio Technologies
              • Naio Technologies - Overview
              • Naio Technologies - Product / Service
              • Naio Technologies - Key offerings
            • 16.15 PrecisionHawk Inc.
              • PrecisionHawk Inc. - Overview
              • PrecisionHawk Inc. - Product / Service
              • PrecisionHawk Inc. - Key offerings
            • 16.16 Raven Industries Inc.
              • Raven Industries Inc. - Overview
              • Raven Industries Inc. - Product / Service
              • Raven Industries Inc. - Key offerings
            • 16.17 Syngenta AG
              • Syngenta AG - Overview
              • Syngenta AG - Product / Service
              • Syngenta AG - Key offerings
            • 16.18 TeeJet Technologies
              • TeeJet Technologies - Overview
              • TeeJet Technologies - Product / Service
              • TeeJet Technologies - Key offerings
            • 16.19 Topcon Corp.
              • Topcon Corp. - Overview
              • Topcon Corp. - Product / Service
              • Topcon Corp. - Key offerings
            • 16.20 Trimble Inc.
              • Trimble Inc. - Overview
              • Trimble Inc. - Product / Service
              • Trimble Inc. - Key offerings
            • 16.21 XAG Co. Ltd.
              • XAG Co. Ltd. - Overview
              • XAG Co. Ltd. - Product / Service
              • XAG Co. Ltd. - Key offerings
            • 16.22 Yanmar Co. Ltd.
              • Yanmar Co. Ltd. - Overview
              • Yanmar Co. Ltd. - Product / Service
              • Yanmar Co. Ltd. - Key offerings
            • 16.23 Accenture Plc
              • Accenture Plc - Overview
              • Accenture Plc - Product / Service
              • Accenture Plc - Key offerings
            • 16.24 Agrivi d.o.o.
              • Agrivi d.o.o. - Overview
              • Agrivi d.o.o. - Product / Service
              • Agrivi d.o.o. - Key offerings
            • 16.25 Agvance
              • Agvance - Overview
              • Agvance - Product / Service
              • Agvance - Key offerings
            • 16.26 Agworld Pty Ltd.
              • Agworld Pty Ltd. - Overview
              • Agworld Pty Ltd. - Product / Service
              • Agworld Pty Ltd. - Key offerings
            • 16.27 Cisco Systems Inc.
              • Cisco Systems Inc. - Overview
              • Cisco Systems Inc. - Product / Service
              • Cisco Systems Inc. - Key offerings
            • 16.28 CNH Industrial NV
              • CNH Industrial NV - Overview
              • CNH Industrial NV - Product / Service
              • CNH Industrial NV - Key offerings
            • 16.29 Conservis Corp.
              • Conservis Corp. - Overview
              • Conservis Corp. - Product / Service
              • Conservis Corp. - Key offerings
            • 16.30 Corteva Inc.
              • Corteva Inc. - Overview
              • Corteva Inc. - Product / Service
              • Corteva Inc. - Key offerings
            • 16.31 Cropin Technology Solutions Pvt. Ltd.
              • Cropin Technology Solutions Pvt. Ltd. - Overview
              • Cropin Technology Solutions Pvt. Ltd. - Product / Service
              • Cropin Technology Solutions Pvt. Ltd. - Key offerings
            • 16.32 CropX Technologies Ltd.
              • CropX Technologies Ltd. - Overview
              • CropX Technologies Ltd. - Product / Service
              • CropX Technologies Ltd. - Key offerings
            • 16.33 DRAGONFLY IT
              • DRAGONFLY IT - Overview
              • DRAGONFLY IT - Product / Service
              • DRAGONFLY IT - Key offerings
            • 16.34 International Business Machines Corp.
              • International Business Machines Corp. - Overview
              • International Business Machines Corp. - Product / Service
              • International Business Machines Corp. - Key offerings
            • 16.35 Microsoft Corp.
              • Microsoft Corp. - Overview
              • Microsoft Corp. - Product / Service
              • Microsoft Corp. - Key offerings
            • 16.36 Oracle Corp.
              • Oracle Corp. - Overview
              • Oracle Corp. - Product / Service
              • Oracle Corp. - Key offerings
            • 16.37 RELX Plc
              • RELX Plc - Overview
              • RELX Plc - Product / Service
              • RELX Plc - Key offerings
            • 16.38 SAP SE
              • SAP SE - Overview
              • SAP SE - Product / Service
              • SAP SE - Key offerings
            • 16.39 Shivrai Technologies Pvt. Ltd.
              • Shivrai Technologies Pvt. Ltd. - Overview
              • Shivrai Technologies Pvt. Ltd. - Product / Service
              • Shivrai Technologies Pvt. Ltd. - Key offerings
            • 16.40 Topcon Corp.
              • Topcon Corp. - Overview
              • Topcon Corp. - Product / Service
              • Topcon Corp. - Key offerings
            • 16.41 Trimble Inc.
              • Trimble Inc. - Overview
              • Trimble Inc. - Product / Service
              • Trimble Inc. - Key offerings
            • 16.42 Valmont Industries Inc.
              • Valmont Industries Inc. - Overview
              • Valmont Industries Inc. - Product / Service
              • Valmont Industries Inc. - Key offerings

            13 Appendix

            • 13.1 Scope of the report
              • 13.2 Inclusions and exclusions checklist
                • Exhibit 182: Inclusions checklist
                • Exhibit 183: Exclusions checklist
              • 13.3 Currency conversion rates for US$
                • Exhibit 184: Currency conversion rates for US$
              • 13.4 Research methodology
                • Exhibit 185: Research methodology
                • Exhibit 186: Validation techniques employed for market sizing
                • Exhibit 187: Information sources
              • 13.5 List of abbreviations
                • Exhibit 188: List of abbreviations

              Research Methodology

              Technavio presents a detailed picture of the market by way of study, synthesis, and summation of data from multiple sources. The analysts have presented the various facets of the market with a particular focus on identifying the key industry influencers. The data thus presented is comprehensive, reliable, and the result of extensive research, both primary and secondary.

              INFORMATION SOURCES

              Primary sources

              • Manufacturers and suppliers
              • Channel partners
              • Industry experts
              • Strategic decision makers

              Secondary sources

              • Industry journals and periodicals
              • Government data
              • Financial reports of key industry players
              • Historical data
              • Press releases

              DATA ANALYSIS

              Data Synthesis

              • Collation of data
              • Estimation of key figures
              • Analysis of derived insights

              Data Validation

              • Triangulation with data models
              • Reference against proprietary databases
              • Corroboration with industry experts

              REPORT WRITING

              Qualitative

              • Market drivers
              • Market challenges
              • Market trends
              • Five forces analysis

              Quantitative

              • Market size and forecast
              • Market segmentation
              • Geographical insights
              • Competitive landscape

              Interested in this report?

              Get your sample now to see our research methodology and insights!

              Download Now

              Frequently Asked Questions

              Autonomous Crop Management market growth will increase by $ 5.76 bn during 2024-2028 .

              The Autonomous Crop Management market is expected to grow at a CAGR of 10.45% during 2024-2028 .

              Autonomous Crop Management market is segmented by Component( Hardware, Software, Services) Deployment( On-premises, Cloud-based)

              AGCO Corp., AgJunction Inc., BASF SE, Bayer AG, CNH Industrial NV, CropX Inc., Deere & Company, DJI, Farm-ng, Kubota Corp., Monsanto Co., Naio Technologies, PrecisionHawk Inc., Raven Industries Inc., Syngenta AG, TeeJet Technologies, Topcon Corp., Trimble Inc., XAG Co. Ltd., Yanmar Co. Ltd. are a few of the key vendors in the Autonomous Crop Management market.

              North America will register the highest growth rate of 43% among the other regions. Therefore, the Autonomous Crop Management market in North America is expected to garner significant business opportunities for the vendors during the forecast period.

              US, Canada, Germany, UK, Italy, France, China, India, Japan, Brazil, Egypt, UAE, Oman, Argentina, KSA, UAE, Brazil, Rest of World (ROW)

              • Growing focus on increasing productivity and efficiency in agriculture sectorThe ability of autonomous crop management to perform tasks around the farm with little or no labor results in enhanced productivity and efficiency. For farmers is the driving factor this market.
              • this can mean less downtime is the driving factor this market.
              • which means they may focus on other duties and live better. Moreover is the driving factor this market.
              • farmers can benefit from economies of scale when multiple self-driving vehicles are deployed on their farms is the driving factor this market.
              • which raises the overall efficiency of their business. Agricultural mechanization is important for the modernization of agriculture. Machines are steadily replacing people in agriculture in various countries and have significantly reshaped the agricultural landscape. The productivity of the farm has a direct relationship with the efficient utilization of farm implements. Agricultural mechanization is the process of utilizing agricultural machinery to mechanize work. It helps in improving the timeliness of operations and increases the quality of production. For instance is the driving factor this market.
              • crop harvesting robots have been gaining popularity as an effective solution for harvesting across farms is the driving factor this market.
              • greenhouses is the driving factor this market.
              • and nurseries. They have widely been used as an effective solution for labor shortage problems during the harvesting season in various countries is the driving factor this market.
              • such as the US and the UK. Some of the crop harvesting robots commonly used are lettuce harvesters is the driving factor this market.
              • cucumber harvesters is the driving factor this market.
              • wheat harvesters is the driving factor this market.
              • barley harvesters is the driving factor this market.
              • and sweet pepper harvesters. By maximizing harvest windows is the driving factor this market.
              • boosting productivity is the driving factor this market.
              • and expanding labor availability is the driving factor this market.
              • autonomous crop management can have a substantial impact on agricultural yields and quality. Farmers can harvest their crops at the best time by maximizing their output and utilizing automation and machine learning technologies. Thus is the driving factor this market.
              • increasing focus on increasing productivity and efficiency in the agriculture sector will increase the deployment of autonomous crop management and will drive the growth of the market in focus during the forecast period. is the driving factor this market.

              The Autonomous Crop Management market vendors should focus on grabbing business opportunities from the Hardware segment as it accounted for the largest market share in the base year.