
Big Data Market In Oil And Gas Sector Size 2025-2029
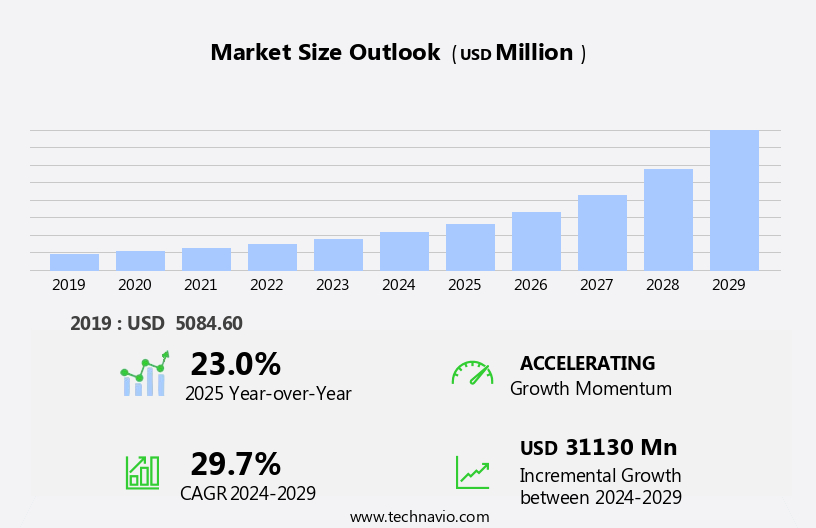
The big data market in oil and gas sector size is forecast to increase by USD 31.13 billion, at a CAGR of 29.7% between 2024 and 2029.
- In the Oil and Gas sector, the adoption of Big Data is increasingly becoming a strategic priority to optimize production processes and enhance operational efficiency. The implementation of advanced analytics tools and technologies is enabling companies to gain valuable insights from vast volumes of data, leading to improved decision-making and operational excellence. However, the use of Big Data in the Oil and Gas industry is not without challenges. Security concerns are at the forefront of the Big Data landscape in the Oil and Gas sector. With the vast amounts of sensitive data being generated and shared, ensuring data security is crucial.
- The use of blockchain solutions is gaining traction as a potential answer to this challenge, offering enhanced security and transparency. Yet, the implementation of these solutions presents its own set of complexities, requiring significant investment and expertise. Despite these challenges, the potential benefits of Big Data in the Oil and Gas sector are significant, offering opportunities for increased productivity, cost savings, and competitive advantage. Companies seeking to capitalize on these opportunities must navigate the security challenges effectively, investing in the right technologies and expertise to secure their data and reap the rewards of Big Data analytics.
What will be the Size of the Big Data Market In Oil And Gas Sector during the forecast period?
Explore in-depth regional segment analysis with market size data - historical 2019-2023 and forecasts 2025-2029 - in the full report.
Request Free Sample
In the oil and gas sector, the application of big data continues to evolve, shaping market dynamics across various sectors. Predictive modeling and pipeline management are two areas where big data plays a pivotal role. Big data storage solutions ensure the secure handling of vast amounts of data, enabling data governance and natural gas processing. The integration of data from exploration and production, drilling optimization, and reservoir simulation enhances operational efficiency and cost optimization. Artificial intelligence, data mining, and automated workflows facilitate decision support systems and data visualization, enabling pattern recognition and risk management. Big data also optimizes upstream operations through real-time data processing, horizontal drilling, and hydraulic fracturing.
Downstream operations benefit from data analytics, asset management, process automation, and energy efficiency. Sensor networks and IoT devices facilitate environmental monitoring and carbon emissions tracking. Deep learning and machine learning algorithms optimize production and improve enhanced oil recovery. Digital twins and automated workflows streamline project management and supply chain operations. Edge computing and cloud computing enable data processing in real-time, ensuring data quality and security. Remote monitoring and health and safety applications enhance operational efficiency and ensure regulatory compliance. Big data's role in the oil and gas sector is ongoing and dynamic, continuously unfolding and shaping market patterns.
How is this Big Data In Oil And Gas Sector Industry segmented?
The big data in oil and gas sector industry research report provides comprehensive data (region-wise segment analysis), with forecasts and estimates in "USD million" for the period 2025-2029, as well as historical data from 2019-2023 for the following segments.
- Application
- Upstream
- Midstream
- Downstream
- Type
- Structured
- Unstructured
- Semi-structured
- Deployment
- On-premises
- Cloud-based
- Product Type
- Services
- Software
- Geography
- North America
- US
- Canada
- Europe
- France
- Germany
- Russia
- APAC
- China
- India
- Japan
- South Korea
- South America
- Brazil
- Rest of World (ROW)
- North America
By Application Insights
The upstream segment is estimated to witness significant growth during the forecast period.
In the oil and gas industry's upstream sector, big data analytics significantly enhances exploration, drilling, and production activities. Big data storage and processing facilitate the analysis of extensive seismic data, well logs, geological information, and other relevant data. This information is crucial for identifying potential drilling sites, estimating reserves, and enhancing reservoir modeling. Real-time data processing from production operations allows for optimization, maximizing hydrocarbon recovery, and improving operational efficiency. Machine learning and artificial intelligence algorithms identify patterns and anomalies, providing valuable insights for drilling optimization, production forecasting, and risk management. Data integration and data governance ensure data quality and security, enabling effective decision-making through advanced decision support systems and data visualization tools.
Digital twins and remote monitoring enable real-time monitoring of assets, improving operational efficiency and reducing costs. IoT devices and edge computing provide real-time data from the field, enabling predictive maintenance and reducing downtime. Natural gas processing and hydraulic fracturing benefit from big data analytics for cost optimization and enhanced oil recovery. Data mining and pattern recognition aid in identifying trends and improving overall performance. Project management and supply chain optimization leverage data analytics for resource allocation, risk management, and cost reduction. Data analytics also plays a role in environmental monitoring and carbon emissions tracking, ensuring regulatory compliance and enhancing corporate social responsibility.
In the midstream and downstream sectors, big data analytics enables process automation, asset management, and energy efficiency improvements. Overall, big data analytics is a game-changer for the oil and gas industry, driving operational efficiency, reducing costs, and improving overall performance.
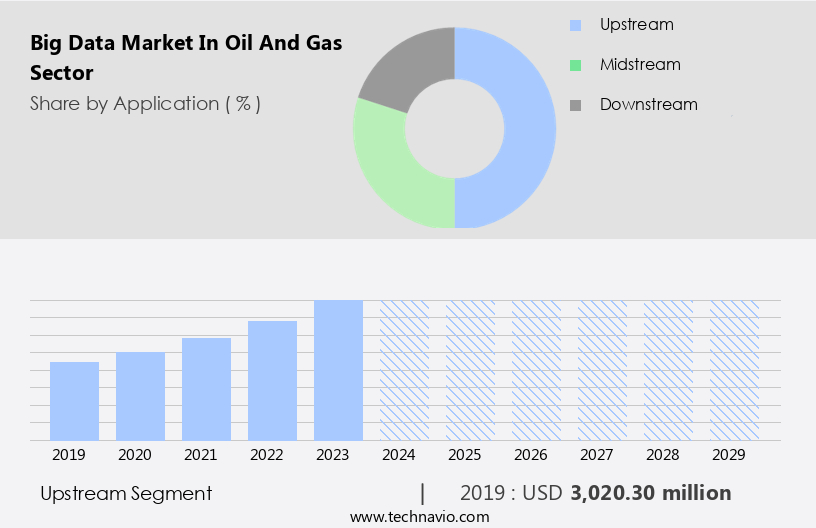
The Upstream segment was valued at USD 3.02 billion in 2019 and showed a gradual increase during the forecast period.
Regional Analysis
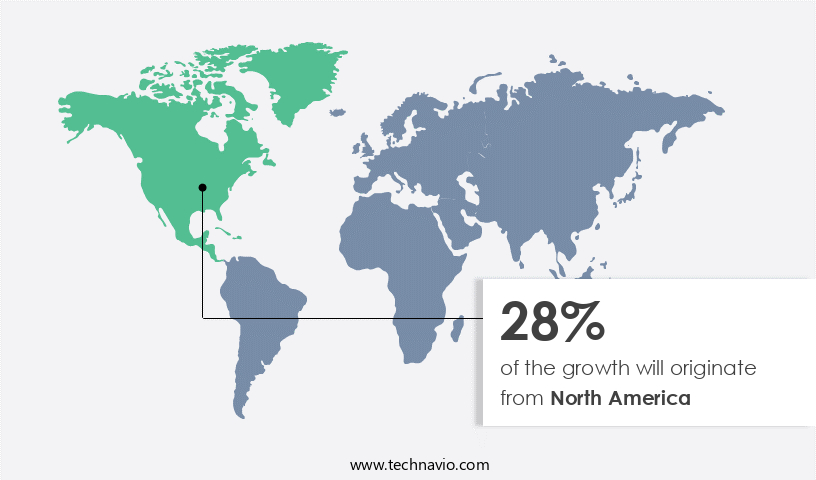
North America is estimated to contribute 28% to the growth of the global market during the forecast period.Technavio’s analysts have elaborately explained the regional trends and drivers that shape the market during the forecast period.
In North America, the oil and gas industry's big data market is experiencing significant growth due to digital transformation initiatives. Companies such as ExxonMobil are leading the charge, investing in advanced analytics to optimize drilling operations, monitor equipment performance, and enhance reservoir management. Big data adoption is essential for reducing operational expenses and increasing production efficiency. This trend is evident in various aspects of the oil and gas sector, including pipeline management, natural gas processing, exploration and production, and downstream operations. Artificial intelligence, machine learning, and deep learning are transforming predictive modeling and data mining, enabling pattern recognition and anomaly detection.
Real-time data processing and edge computing are critical for operational efficiency and risk management in upstream and midstream operations. Digital twins and IoT devices facilitate asset management and process automation. Cost optimization and data quality are essential considerations for data governance. Energy efficiency, environmental monitoring, and carbon emissions are becoming increasingly important, driving the need for data analytics and data visualization. Seismic interpretation and hydraulic fracturing are also benefiting from big data applications. Project management and supply chain optimization are crucial aspects of the industry's digital transformation. Decision support systems and automated workflows are streamlining operations and improving health and safety.
The integration of big data in the oil and gas sector is a game-changer, revolutionizing the industry's approach to exploration, production, and processing.
Market Dynamics
Our researchers analyzed the data with 2024 as the base year, along with the key drivers, trends, and challenges. A holistic analysis of drivers will help companies refine their marketing strategies to gain a competitive advantage.
In the dynamic and complex oil and gas industry, big data has emerged as a game-changer, revolutionizing operations and driving efficiency. Big data analytics in oil and gas harnesses real-time data from various sources, including drilling operations, production processes, and supply chain management. This data is analyzed using advanced algorithms and machine learning techniques to optimize drilling locations, reduce downtime, enhance reservoir management, and improve maintenance scheduling. Predictive analytics helps forecast market trends, while the Internet of Things (IoT) enables remote monitoring and automation. Big data also enhances environmental sustainability, with real-time monitoring of emissions and resource management. By integrating big data into their strategies, oil and gas companies can make informed decisions, streamline processes, and gain a competitive edge in the global market.
What are the key market drivers leading to the rise in the adoption of Big Data In Oil And Gas Sector Industry?
- The increasing demand for maximizing production efficiency serves as the primary market motivator.
- The oil and gas sector generates a substantial amount of data from various sources, including supply chain operations, risk management, enhanced oil recovery, seismic interpretation, and downstream operations. Big data technologies are essential to extract valuable insights from this data and optimize production for oil and gas companies. Machine learning algorithms and real-time data processing enable predictive maintenance, anomaly detection, and performance improvement. IoT devices, such as sensors, monitor equipment data, including pressure, volume, vibration, and temperature, in real-time. Historical data from these sensors, when analyzed using big data solutions, can predict potential equipment failures or production disruptions.
- Additionally, big data technologies enhance horizontal drilling and environmental monitoring, improving operational efficiency and reducing environmental impact. Cloud computing provides a scalable and cost-effective solution for storing and processing large volumes of data. Big data solutions also aid in the interpretation of seismic data, leading to the discovery of new oil and gas reserves. In conclusion, the adoption of big data technologies in the oil and gas sector offers numerous benefits, including improved risk management, optimized supply chain operations, enhanced oil recovery, and real-time monitoring of production processes.
What are the market trends shaping the Big Data In Oil And Gas Sector Industry?
- The use of blockchain technology to enhance big data security is an emerging market trend. This innovative solution offers increased security and trust through decentralized and encrypted data storage.
- In the oil and gas sector, data security is a critical concern for enterprises adopting big data. IoT devices used in drilling optimization, well logging, midstream operations, and process automation generate vast amounts of data, making it essential to secure this information from potential cyberattacks. Blockchain technology, with its distributed ledger and cryptographic security, is gaining traction as a solution. Every data block in a blockchain is linked to the previous one, ensuring data integrity and security. Additionally, data analytics, deep learning, remote monitoring, health and safety, energy efficiency, and sensor networks all benefit from the secure transfer and storage of data.
- By implementing blockchain technology, oil and gas companies can enhance their asset management, improve operational efficiency, and prioritize process automation while maintaining the highest level of data security.
What challenges does the Big Data In Oil And Gas Sector Industry face during its growth?
- The expansion of big data usage in industries is confronted by escalating concerns regarding security, posing a significant challenge to industry growth.
- Big data analytics is revolutionizing the oil and gas industry by enhancing productivity and simplifying complex operations. Companies like Shell are harnessing the power of digital sensors in their production and manufacturing sites, generating vast amounts of data. This data is analyzed using advanced technologies such as predictive modeling, artificial intelligence, and data mining to optimize production and pipeline management. However, the adoption of IoT in the sector has also brought about data privacy concerns. Big data security is a major priority, as the industry deals with sensitive information. Data governance and automated workflows are essential to ensure data integrity and facilitate data integration across various stages of exploration and production, including natural gas processing and reservoir simulation.
- The implementation of these technologies requires a robust data storage infrastructure to handle the large data sets generated. Overall, the oil and gas sector is embracing big data analytics to streamline operations, make informed decisions, and remain competitive in the global market.
Exclusive Customer Landscape
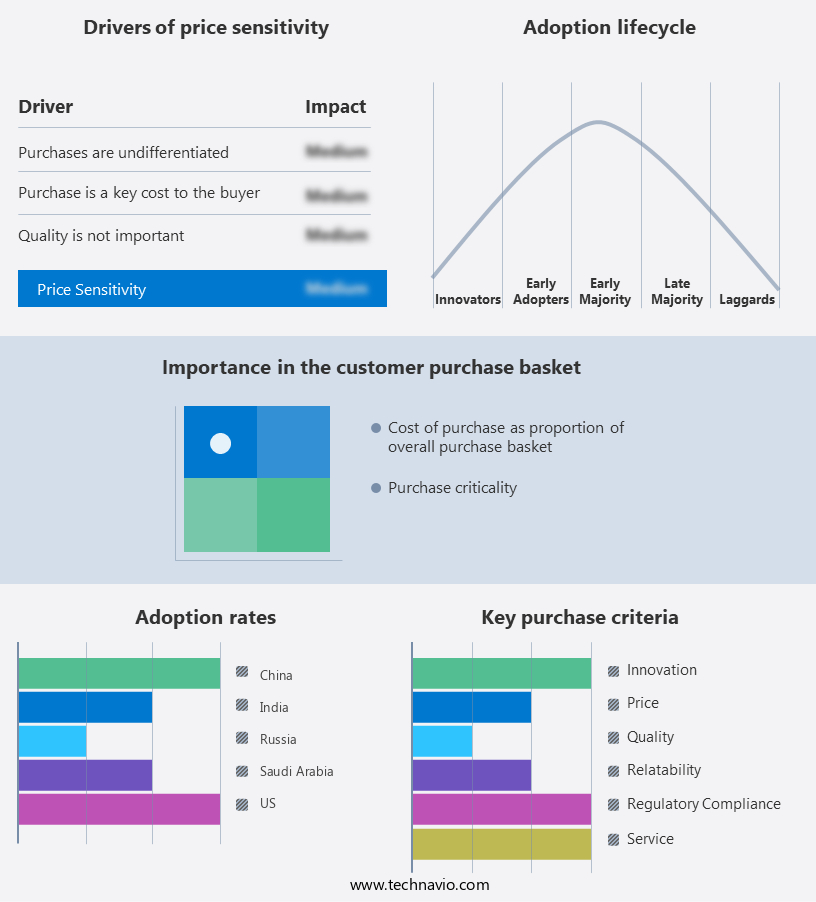
The big data market in oil and gas sector forecasting report includes the adoption lifecycle of the market, covering from the innovator’s stage to the laggard’s stage. It focuses on adoption rates in different regions based on penetration. Furthermore, the big data market in oil and gas sector report also includes key purchase criteria and drivers of price sensitivity to help companies evaluate and develop their market growth analysis strategies.
Customer Landscape
Key Companies & Market Insights
Companies are implementing various strategies, such as strategic alliances, big data market in oil and gas sector forecast, partnerships, mergers and acquisitions, geographical expansion, and product/service launches, to enhance their presence in the industry.
Accenture PLC - The company specializes in providing valuable insights, investment guidance, and essential services to the oil and gas industry. Our offerings facilitate informed decision-making and optimize operational efficiency for sector clients. With a commitment to innovation and expertise, we deliver actionable intelligence to help businesses navigate the complex energy landscape.
The industry research and growth report includes detailed analyses of the competitive landscape of the market and information about key companies, including:
- Accenture PLC
- Alphabet Inc.
- Altair Engineering Inc.
- Alteryx Inc.
- Amazon.com Inc.
- BigPanda Inc.
- Capgemini Services SAS
- Cloudera Inc.
- Datameer Inc.
- Dell Technologies Inc.
- DXC Technology Co.
- General Electric Co.
- HCL Technologies Ltd.
- Hewlett Packard Enterprise Co.
- Hitachi Ltd.
- International Business Machines Corp.
- Microsoft Corp.
- Oracle Corp.
- Quorum Business Solutions Inc.
- SAP SE
Qualitative and quantitative analysis of companies has been conducted to help clients understand the wider business environment as well as the strengths and weaknesses of key industry players. Data is qualitatively analyzed to categorize companies as pure play, category-focused, industry-focused, and diversified; it is quantitatively analyzed to categorize companies as dominant, leading, strong, tentative, and weak.
Recent Development and News in Big Data Market In Oil And Gas Sector
- In January 2024, Schlumberger, a leading provider of technology for the oil and gas industry, announced the launch of its new Big Data Analytics platform, "Oilfield Insights," designed to optimize production and reduce operational costs for customers (Schlumberger press release, 2024). In March 2024, IBM and Halliburton formed a strategic partnership to integrate IBM's Watson AI technology into Halliburton's drilling and production services, enhancing operational efficiency and predictive maintenance (IBM press release, 2024).
- In April 2025, Aker Solutions, a Norwegian oil services company, acquired KONGSBERG's oil data business for approximately USD350 million, expanding its digitalization capabilities and strengthening its position in the Big Data market in the oil and gas sector (Aker Solutions press release, 2025). In May 2025, Saudi Aramco, the world's largest oil company, received regulatory approval from the Saudi Arabian General Authority for Civil Aviation to establish a drone center for surveying and monitoring oil fields using advanced Big Data analytics, increasing operational efficiency and reducing costs (Saudi Aramco press release, 2025).
Research Analyst Overview
- In the oil and gas sector, big data plays a pivotal role in optimizing operations, enhancing efficiency, and ensuring regulatory compliance. Data acquisition through stream processing is crucial for real-time monitoring and analysis. Business intelligence derived from algorithm development and statistical analysis aids in production engineering and directional drilling. Water management, a significant challenge in the industry, benefits from data cleansing and predictive analytics. Neural networks and high-performance computing enable advanced subsurface modeling and reservoir characterization. Fracking technology and drilling engineering rely on data labeling and formation evaluation for improved performance. Data validation and data visualization tools facilitate data warehousing and API integration.
- Renewable energy integration and emission reduction are addressed through risk mitigation and cost reduction strategies. Safety protocols and pipeline integrity are ensured through SCADA systems and real-time data interpretation. Environmental regulations mandate data collection and reporting, making data cleansing and validation essential. Algorithm development and predictive analytics assist in maintaining regulatory compliance. Distributed computing and neural networks enable autonomous systems for remote operations and real-time decision-making. In the digital oilfield, high-performance computing and data lakes facilitate data-driven insights for portfolio management and risk mitigation. Neural networks and computer vision are employed for well testing and formation evaluation. Data interpretation and real-time monitoring ensure safety and efficiency in drilling operations.
- Big data applications in the oil and gas sector continue to evolve, with a focus on cost reduction, pipeline integrity, and emission reduction. The integration of advanced technologies, such as machine learning and AI, is transforming the industry's approach to data analysis and operations management.
Dive into Technavio’s robust research methodology, blending expert interviews, extensive data synthesis, and validated models for unparalleled Big Data Market In Oil And Gas Sector insights. See full methodology.
|
Market Scope |
|
|
Report Coverage |
Details |
|
Page number |
239 |
|
Base year |
2024 |
|
Historic period |
2019-2023 |
|
Forecast period |
2025-2029 |
|
Growth momentum & CAGR |
Accelerate at a CAGR of 29.7% |
|
Market growth 2025-2029 |
USD 31130 million |
|
Market structure |
Fragmented |
|
YoY growth 2024-2025(%) |
23.0 |
|
Key countries |
US, Russia, China, Canada, India, Germany, Brazil, France, Japan, and South Korea |
|
Competitive landscape |
Leading Companies, Market Positioning of Companies, Competitive Strategies, and Industry Risks |
What are the Key Data Covered in this Big Data Market In Oil And Gas Sector Research and Growth Report?
- CAGR of the Big Data In Oil And Gas Sector industry during the forecast period
- Detailed information on factors that will drive the growth and forecasting between 2025 and 2029
- Precise estimation of the size of the market and its contribution of the industry in focus to the parent market
- Accurate predictions about upcoming growth and trends and changes in consumer behaviour
- Growth of the market across North America, APAC, Middle East and Africa, Europe, and South America
- Thorough analysis of the market’s competitive landscape and detailed information about companies
- Comprehensive analysis of factors that will challenge the big data market in oil and gas sector growth of industry companies
We can help! Our analysts can customize this big data market in oil and gas sector research report to meet your requirements.
 RIA -
RIA - 
