Organic Dairy Products Market Analysis, Size, and Forecast 2024-2028: North America (US and Canada), Europe (France, Germany, Italy, and UK), Middle East and Africa (Egypt, KSA, Oman, and UAE), APAC (China, India, and Japan), South America (Argentina and Brazil), and Rest of World (ROW)

Organic Dairy Products Market Analysis, Size, and Forecast 2024-2028:
North America (US and Canada), Europe (France, Germany, Italy, and UK), Middle East and Africa (Egypt, KSA, Oman, and UAE), APAC (China, India, and Japan), South America (Argentina and Brazil), and Rest of World (ROW)

Published: Nov 2023 172 Pages SKU: IRTNTR45714

Market Overview at a Glance

$9.09 B
Market Opportunity
6.52%
CAGR
5.5
YoY growth 2023-2024(%)

Organic Dairy Products Market Size 2024-2028

The organic dairy products market size is forecast to increase by USD 9.09 billion, at a CAGR of 6.52% between 2023 and 2028.

  • The market is driven by the increasing awareness of the benefits associated with consuming organic dairy products. Consumers are increasingly seeking healthier and more natural food options, leading to a surge in demand for organic dairy products. Additionally, the growing use of clean and transparent packaging is a significant trend in the market, as consumers prioritize product safety and sustainability. However, the market faces challenges due to fluctuations in the supply of raw materials for organic dairy farming. These challenges include unpredictable weather patterns, which can impact crop yields and pasture growth, and the high cost of organic feed and fertilizers.
  • To capitalize on market opportunities and navigate these challenges effectively, companies must focus on sustainable farming practices, efficient supply chain management, and innovative product development. By addressing these factors, they can meet the growing demand for organic dairy products and differentiate themselves in a competitive market.

What will be the Size of the Organic Dairy Products Market during the forecast period?

Organic Dairy Products Market Size

Explore in-depth regional segment analysis with market size data - historical 2018-2022 and forecasts 2024-2028 - in the full report.  
Request Free Sample

The market continues to evolve, with dynamic market activities shaping its landscape. Whey protein recovery and yogurt production are key processes undergoing constant advancements, driven by consumer preferences for nutritious and functional food options. Milk fat percentage and dairy farming practices, such as grass-fed and pasture-raised, are also influencing production methods. Butter manufacturing and ruminant nutrition are areas of focus, as producers seek to optimize milk production efficiency while adhering to animal welfare standards. Dairy traceability systems and marketing strategies are essential components, ensuring transparency and consumer trust. Bacterial culture identification and food safety regulations play a crucial role in maintaining product quality and safety.

Dairy product packaging and cheesemaking techniques are continually evolving to extend shelf life and enhance flavor profiles. Milk composition analysis, including milk protein content and somatic cell count, are essential for ensuring consistent product quality. Pasteurization techniques and sustainable dairy practices are also critical aspects, as producers aim to minimize waste and reduce environmental impact. Consumer preference trends and quality control measures are driving innovation in the organic dairy sector, with an increasing emphasis on farm-to-table sourcing and value-added products. Ultra-high temperature processing and forage quality assessment are among the areas of research to address evolving consumer demands and market dynamics.

How is this Organic Dairy Products Industry segmented?

The organic dairy products industry research report provides comprehensive data (region-wise segment analysis), with forecasts and estimates in "USD million" for the period 2024-2028, as well as historical data from 2018-2022 for the following segments.

  • Product
    • Organic milk
    • Organic yogurt
    • Organic cheese
    • Others
  • Distribution Channel
    • Offline
    • Online
  • Source
    • Cow Milk
    • Buffalo Milk
    • Other Animal Milk
  • Application
    • Children
    • Adults
    • Aged
  • Packaging Type
    • Pouches
    • Cartons
    • Bottles
    • Cups
    • Tubs
  • Geography
    • North America
      • US
      • Canada
    • Europe
      • France
      • Germany
      • Italy
      • UK
    • Middle East and Africa
      • Egypt
      • KSA
      • Oman
      • UAE
    • APAC
      • China
      • India
      • Japan
    • South America
      • Argentina
      • Brazil
    • Rest of World (ROW)

By Product Insights

The organic milk segment is estimated to witness significant growth during the forecast period.

The organic dairy market in the US is witnessing significant growth due to increasing consumer preference for sustainable dairy farming and production methods. Organic dairy farming involves raising livestock on organic feed, free from synthetic hormones and antibiotics, resulting in milk that is free from these substances. The environmentally-friendly organic farming practices, which exclude the use of chemicals and pesticides, further add to the appeal. Dairy processing technology plays a crucial role in maintaining the quality of organic dairy products. Homogenization methods ensure consistent milk fat percentage and milk protein content, while pasteurization techniques extend shelf life. Cheesemaking techniques and yogurt production processes are also essential to preserve the natural taste and texture of these products.

Food safety regulations are stringently enforced to ensure the highest standards of milk production efficiency and bacterial culture identification. Dairy product packaging is designed to maintain the quality and freshness of the products, while dairy marketing strategies focus on promoting the health benefits and sustainability of organic dairy. Animal welfare standards are a priority in organic dairy farming, with grass-fed and pasture-raised dairy cows being raised in humane conditions. Forage quality assessment and dairy herd management practices contribute to optimal milk production and efficient dairy waste management. Sustainable dairy practices, such as ruminant nutrition and dairy traceability systems, are integral to the organic dairy industry.

Consumer preference trends favor value-added dairy products, including whey protein recovery and butter manufacturing. Quality control measures, such as milk composition analysis and somatic cell count monitoring, ensure the purity and consistency of organic dairy products. Ultra-high temperature processing and farm-to-table dairy initiatives are innovative approaches to meet the growing demand for organic dairy products. Sustainability and transparency are key drivers in the organic dairy market, with consumers seeking assurance that their dairy products are produced using ethical and eco-friendly methods.

Organic Dairy Products Market Size

Request Free Sample

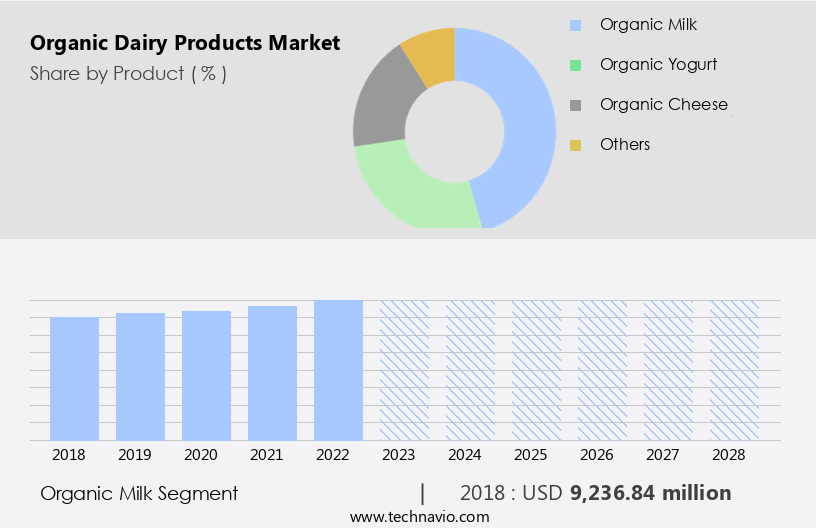
The Organic milk segment was valued at USD 9.24 billion in 2018 and showed a gradual increase during the forecast period.

Regional Analysis

North America is estimated to contribute 37% to the growth of the global market during the forecast period.Technavio's analysts have elaborately explained the regional trends and drivers that shape the market during the forecast period.

Organic Dairy Products Market Share by Geography

 Request Free Sample

The market in North America is experiencing growth due to the rising consumer preference for healthier and more natural food choices. With the absence of synthetic hormones, antibiotics, and pesticides in organic dairy products, they are perceived as a healthier alternative to conventional dairy offerings. The trend toward wellness and natural living has significantly driven demand for these products. Local dairy sourcing and farm-to-table practices are also gaining popularity, contributing to the market's expansion. Dairy processing technology plays a crucial role in maintaining the quality and consistency of organic dairy products. Homogenization methods ensure uniform milk composition, while food safety regulations safeguard consumer health.

Milk production efficiency is essential for maintaining profitability, and bacterial culture identification and milk composition analysis help ensure product purity and quality. Cheesemaking techniques, whey protein recovery, and yogurt production are key areas of innovation in the organic dairy industry. Milk fat percentage, grass-fed and pasture-raised dairy, and butter manufacturing cater to various consumer preferences. Ruminant nutrition, dairy herd management, and dairy waste management are essential aspects of sustainable dairy practices. Consumer trends favor value-added dairy products, such as flavored milk, organic butter, and organic cheese. Quality control measures, including pasteurization techniques and shelf life extension, are essential to maintain product integrity.

Dairy traceability systems and animal welfare standards are also critical factors in the market. Ultra-high temperature processing and somatic cell count are important considerations in organic dairy production. Forage quality assessment and mastitis detection methods help maintain herd health and productivity. Sustainable dairy practices, including the use of renewable energy and reduction of greenhouse gas emissions, are becoming increasingly important to consumers and stakeholders alike. In conclusion, the market in North America is growing due to consumer demand for healthier, more natural food choices. Innovation in processing technology, sustainable practices, and value-added products are key drivers of market growth.

Regulatory compliance, animal welfare, and sustainable production are essential considerations for market success.

Market Dynamics

The Organic Dairy Products Market is flourishing as demand for organic dairy products like organic milk, organic cheese, and organic yogurt grows among organic dairy for health-conscious consumers. Products such as organic dairy lactose-free milk benefits those with organic dairy for lactose intolerance, while organic dairy clean label and organic dairy probiotic products appeal to organic dairy for clean eating enthusiasts. Organic dairy sustainable production and organic dairy for sustainable farming align with organic dairy for ethical consumers, supported by organic dairy eco-friendly packaging and organic dairy processing advancements. Best organic dairy products for health, including organic dairy high-protein products and organic dairy for infant nutrition, drive market growth, catering to diverse dietary and ethical needs.

Our researchers analyzed the data with 2023 as the base year, along with the key drivers, trends, and challenges. A holistic analysis of drivers will help companies refine their marketing strategies to gain a competitive advantage.

What are the key market drivers leading to the rise in the adoption of Organic Dairy Products Industry?

  • The significant rise in consumer awareness regarding the health benefits associated with organic dairy products serves as the primary catalyst for market growth. 
  • Organic dairy farming has gained significant traction in the global market due to increasing consumer preference for healthier food options. The demand for organic dairy products is on the rise as consumers become more conscious of the potential health risks associated with conventional dairy farming practices. Organic dairy farming ensures the absence of synthetic hormones, pesticides, and antibiotics in milk production. Advancements in dairy processing technology have facilitated the production of organic dairy products with improved milk production efficiency and food safety regulations. Bacterial culture identification and homogenization methods ensure the preservation of nutrients and the elimination of harmful bacteria, respectively.
  • Local dairy sourcing is another trend that has gained popularity in the organic dairy market. Consumers prefer locally sourced organic dairy products due to their freshness and the reduced carbon footprint. Dairy product packaging plays a crucial role in maintaining the quality and freshness of organic dairy products. Cheese making techniques are being refined to cater to the growing demand for organic cheese. The use of traditional methods and natural ingredients is a key focus area for producers to differentiate their products and cater to the evolving consumer preferences. Overall, the organic dairy market is expected to continue its growth trajectory due to increasing consumer awareness and the availability of advanced dairy processing technology.

What are the market trends shaping the Organic Dairy Products Industry?

  • The increasing preference for clean and transparent packaging is a notable trend in the current market. This shift towards transparency aims to provide consumers with a clearer view of the product and its contents.
  • Organic dairy products have gained significant traction in the market due to increasing consumer awareness and preference for healthier and more sustainable food options. The production of organic dairy items, such as yogurt and whey protein recovery, involves the use of grass-fed dairy cows raised in pastures. This farming practice ensures better ruminant nutrition and results in milk with a higher milk fat percentage, contributing to the superior taste and quality of organic dairy products. Transparency is a crucial factor in the organic dairy market. Dairy traceability systems are essential to ensure the authenticity and origin of organic dairy products.
  • Consumers are more likely to choose products with clear and transparent packaging, as it provides a view of the product inside and allows them to check the quality and condition of the items. Additionally, eco-friendly, recyclable, or biodegradable packaging aligns with the broader trend of sustainability and appeals to environmentally-conscious consumers. Butter manufacturing is another segment of the organic dairy market that is growing in popularity. The production process for organic butter involves using milk from cows that have not been treated with antibiotics or growth hormones, ensuring a pure and natural product. The organic dairy industry continues to innovate and adapt to consumer demands, focusing on delivering high-quality, authentic, and sustainable products.

What challenges does the Organic Dairy Products Industry face during its growth?

  • The organic dairy industry faces significant challenges due to the volatile supply of raw materials for production, which can negatively impact industry growth. 
  • The market experiences challenges due to the limited supply of organic raw materials, specifically organic milk. This scarcity is driving up demand for alternative organic dairy options, such as organic cane sugar, fruits, and other dairy-free products. The production of organic dairy items, including yogurts and ice creams, relies heavily on the availability of organic milk. As a result, inconsistent availability of these raw materials can significantly impact market growth. Animal welfare standards, forage quality assessment, and dairy herd management are crucial factors in organic milk production. Organic farming practices prioritize the well-being of the animals and the quality of the forage they consume.
  • Dairy waste management is also essential to maintain the organic certification. Consumer preference trends lean towards organic dairy products due to their perceived health benefits and ethical production methods. Quality control measures and pasteurization techniques are employed to ensure the highest standards in the production process. Shelf life extension is another consideration for organic dairy manufacturers to maintain product freshness and meet consumer expectations. In conclusion, the market is subject to the availability of organic raw materials, primarily organic milk. Meeting the increasing demand for organic dairy items requires a focus on animal welfare, forage quality assessment, dairy herd management, and waste management.
  • Consumer preference trends, quality control measures, and pasteurization techniques are essential in maintaining the market's growth and meeting the demands of health-conscious consumers.

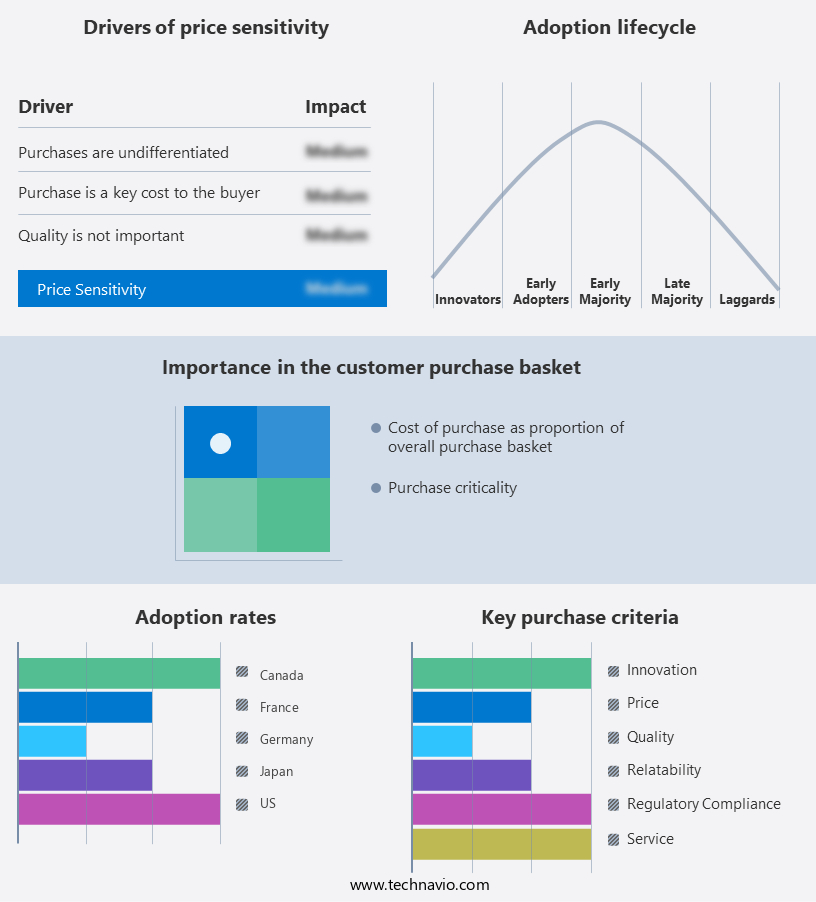
Exclusive Customer Landscape

The organic dairy products market forecasting report includes the adoption lifecycle of the market, covering from the innovator's stage to the laggard's stage. It focuses on adoption rates in different regions based on penetration. Furthermore, the organic dairy products market report also includes key purchase criteria and drivers of price sensitivity to help companies evaluate and develop their market growth analysis strategies.

Organic Dairy Products Market Share by Geography

 Customer Landscape

Key Companies & Market Insights

Companies are implementing various strategies, such as strategic alliances, organic dairy products market forecast, partnerships, mergers and acquisitions, geographical expansion, and product/service launches, to enhance their presence in the industry.

Agropur Dairy Cooperative - This subsidiary of the company specializes in providing a range of organic dairy offerings through Whole Foods Market. The company's commitment to organic products aligns with consumer demand for healthier, sustainable food choices. Whole Foods Market's dairy selection caters to various dietary preferences and supports local farmers, contributing to the company's reputation as a leader in the natural and organic food industry.

The industry research and growth report includes detailed analyses of the competitive landscape of the market and information about key companies, including:

  • Agropur Dairy Cooperative
  • Amazon.com Inc.
  • Arla Foods amba
  • Dairy Farmers of America Inc.
  • DANA Dairy Group Ltd.
  • Danone SA
  • Fonterra Cooperative Group Ltd.
  • General Mills Inc.
  • Gujarat Cooperative Milk Marketing Federation Ltd.
  • Land O Lakes Inc.
  • Meiji Holdings Co. Ltd.
  • MVM Pack Holding AG
  • Nestle SA
  • Royal FrieslandCampina NV
  • Saputo Inc.
  • Savencia SA
  • Schreiber Foods Inc.
  • Sodiaal
  • The Kroger Co.
  • Organic Valley

Qualitative and quantitative analysis of companies has been conducted to help clients understand the wider business environment as well as the strengths and weaknesses of key industry players. Data is qualitatively analyzed to categorize companies as pure play, category-focused, industry-focused, and diversified; it is quantitatively analyzed to categorize companies as dominant, leading, strong, tentative, and weak.

Recent Development and News in Organic Dairy Products Market

  • In January 2024, Danone, a leading organic dairy producer, announced the launch of a new line of organic plant-based milk alternatives, expanding its product portfolio beyond traditional organic dairy offerings (Danone Press Release, 2024).
  • In March 2024, Lactalis, the world's largest dairy cooperative, entered into a strategic partnership with Organic Valley, the largest organic cooperative in the United States, to distribute Organic Valley's products in Europe (Organic Valley Press Release, 2024).
  • In April 2025, Horizon Organic, a leading organic dairy brand in the US, raised USD150 million in a funding round led by BlackRock and Fidelity Investments to expand its production capacity and accelerate its growth (Horizon Organic Press Release, 2025).
  • In May 2025, the European Commission approved the merger of two major organic dairy players, Arla Foods and Lactalis Organic, creating a larger entity to better compete in the global organic dairy market (European Commission Press Release, 2025).

Research Analyst Overview

  • The market is experiencing dynamic shifts as producers focus on reducing methane emissions and carbon footprints through natural dairy ingredients and improved feed efficiency ratios. Environmental sustainability is a key driver, with manure management strategies and soil health improvement initiatives gaining traction. Milk yield improvement and dairy product innovation are also significant trends, as precision farming, genetic selection, and antibiotic usage reduction enhance herd health and profitability. Dairy business operations are increasingly adopting renewable energy sources and water usage efficiency measures.
  • Consumer demand for hormone-free dairy, probiotic and functional products, and transparent labeling is shaping the market. Dairy industry regulations continue to evolve, influencing pricing strategies and sourcing of dairy ingredients. Land management practices and dairy herd health remain critical factors in ensuring long-term profitability and market competitiveness.

Dive into Technavio's robust research methodology, blending expert interviews, extensive data synthesis, and validated models for unparalleled Organic Dairy Products Market insights. See full methodology.

Market Scope

Report Coverage

Details

Page number

172

Base year

2023

Historic period

2018-2022

Forecast period

2024-2028

Growth momentum & CAGR

Accelerate at a CAGR of 6.52%

Market growth 2024-2028

USD 9091.89 million

Market structure

Fragmented

YoY growth 2023-2024(%)

5.5

Key countries

US, Canada, Germany, UK, Italy, France, China, India, Japan, Brazil, Egypt, UAE, Oman, Argentina, KSA, UAE, Brazil, and Rest of World (ROW)

Competitive landscape

Leading Companies, Market Positioning of Companies, Competitive Strategies, and Industry Risks

Request Free Sample

What are the Key Data Covered in this Organic Dairy Products Market Research and Growth Report?

  • CAGR of the Organic Dairy Products industry during the forecast period
  • Detailed information on factors that will drive the growth and forecasting between 2024 and 2028
  • Precise estimation of the size of the market and its contribution of the industry in focus to the parent market
  • Accurate predictions about upcoming growth and trends and changes in consumer behaviour
  • Growth of the market across North America, Europe, APAC, South America, and Middle East and Africa
  • Thorough analysis of the market's competitive landscape and detailed information about companies
  • Comprehensive analysis of factors that will challenge the organic dairy products market growth of industry companies

We can help! Our analysts can customize this organic dairy products market research report to meet your requirements.

Get in touch

1 Executive Summary

  • 1.1 Market overview
    • Exhibit 01: Executive Summary – Chart on Market Overview
    • Exhibit 02: Executive Summary – Data Table on Market Overview
    • Exhibit 03: Executive Summary – Chart on Global Market Characteristics
    • Exhibit 04: Executive Summary – Chart on Market by Geography
    • Exhibit 05: Executive Summary – Chart on Market Segmentation by Product
    • Exhibit 06: Executive Summary – Chart on Market Segmentation by Distribution Channel
    • Exhibit 07: Executive Summary – Chart on Incremental Growth
    • Exhibit 08: Executive Summary – Data Table on Incremental Growth
    • Exhibit 09: Executive Summary – Chart on Vendor Market Positioning

2 Market Landscape

  • 2.1 Market ecosystem
    • Exhibit 10: Parent market
    • Exhibit 11: Market Characteristics

3 Market Sizing

  • 3.1 Market definition
    • Exhibit 12: Offerings of vendors included in the market definition
  • 3.2 Market segment analysis
    • Exhibit 13: Market segments
  • 3.3 Market size 2023
    • 3.4 Market outlook: Forecast for 2023-2028
      • Exhibit 14: Chart on Global - Market size and forecast 2023-2028 ($ million)
      • Exhibit 15: Data Table on Global - Market size and forecast 2023-2028 ($ million)
      • Exhibit 16: Chart on Global Market: Year-over-year growth 2023-2028 (%)
      • Exhibit 17: Data Table on Global Market: Year-over-year growth 2023-2028 (%)

    4 Historic Market Size

    • 4.1 Global organic dairy products market 2018 - 2022
      • Exhibit 18: Historic Market Size – Data Table on global organic dairy products market 2018 - 2022 ($ million)
    • 4.2 Product Segment Analysis 2018 - 2022
      • Exhibit 19: Historic Market Size – Product Segment 2018 - 2022 ($ million)
    • 4.3 Distribution Channel Segment Analysis 2018 - 2022
      • Exhibit 20: Historic Market Size – Distribution Channel Segment 2018 - 2022 ($ million)
    • 4.4 Geography Segment Analysis 2018 - 2022
      • Exhibit 21: Historic Market Size – Geography Segment 2018 - 2022 ($ million)
    • 4.5 Country Segment Analysis 2018 - 2022
      • Exhibit 22: Historic Market Size – Country Segment 2018 - 2022 ($ million)

    5 Five Forces Analysis

    • 5.1 Five forces summary
      • Exhibit 23: Five forces analysis - Comparison between 2023 and 2028
    • 5.2 Bargaining power of buyers
      • Exhibit 24: Chart on Bargaining power of buyers – Impact of key factors 2023 and 2028
    • 5.3 Bargaining power of suppliers
      • Exhibit 25: Bargaining power of suppliers – Impact of key factors in 2023 and 2028
    • 5.4 Threat of new entrants
      • Exhibit 26: Threat of new entrants – Impact of key factors in 2023 and 2028
    • 5.5 Threat of substitutes
      • Exhibit 27: Threat of substitutes – Impact of key factors in 2023 and 2028
    • 5.6 Threat of rivalry
      • Exhibit 28: Threat of rivalry – Impact of key factors in 2023 and 2028
    • 5.7 Market condition
      • Exhibit 29: Chart on Market condition - Five forces 2023 and 2028

    6 Market Segmentation by Product

    • 6.1 Market segments
      • Chart on Product - Market share (2023-2028) (%)
      • Data Table on Product - Market share (2023-2028) (%)
    • 6.2 Comparison by Product
      • Chart on Comparison by Product
      • Data Table on Comparison by Product
    • 6.3 Organic milk - Market size and forecast (2023-2028)
      • Chart on Organic milk - Market size and forecast (2023-2028) ($ million)
      • Data Table on Organic milk - Market size and forecast (2023-2028) ($ million)
      • Chart on Organic milk - Year-over-year growth (2023-2028) (%)
      • Data Table on Organic milk - Year-over-year growth (2023-2028) (%)
    • 6.4 Organic yogurt - Market size and forecast (2023-2028)
      • Chart on Organic yogurt - Market size and forecast (2023-2028) ($ million)
      • Data Table on Organic yogurt - Market size and forecast (2023-2028) ($ million)
      • Chart on Organic yogurt - Year-over-year growth (2023-2028) (%)
      • Data Table on Organic yogurt - Year-over-year growth (2023-2028) (%)
    • 6.5 Organic cheese - Market size and forecast (2023-2028)
      • Chart on Organic cheese - Market size and forecast (2023-2028) ($ million)
      • Data Table on Organic cheese - Market size and forecast (2023-2028) ($ million)
      • Chart on Organic cheese - Year-over-year growth (2023-2028) (%)
      • Data Table on Organic cheese - Year-over-year growth (2023-2028) (%)
    • 6.6 Others - Market size and forecast (2023-2028)
      • Chart on Others - Market size and forecast (2023-2028) ($ million)
      • Data Table on Others - Market size and forecast (2023-2028) ($ million)
      • Chart on Others - Year-over-year growth (2023-2028) (%)
      • Data Table on Others - Year-over-year growth (2023-2028) (%)
    • 6.7 Market opportunity by Product
      • Market opportunity by Product ($ million)
      • Data Table on Market opportunity by Product ($ million)

    7 Market Segmentation by Distribution Channel

    • 7.1 Market segments
      • Chart on Distribution Channel - Market share (2023-2028) (%)
      • Data Table on Distribution Channel - Market share (2023-2028) (%)
    • 7.2 Comparison by Distribution Channel
      • Chart on Comparison by Distribution Channel
      • Data Table on Comparison by Distribution Channel
    • 7.3 Offline - Market size and forecast (2023-2028)
      • Chart on Offline - Market size and forecast (2023-2028) ($ million)
      • Data Table on Offline - Market size and forecast (2023-2028) ($ million)
      • Chart on Offline - Year-over-year growth (2023-2028) (%)
      • Data Table on Offline - Year-over-year growth (2023-2028) (%)
    • 7.4 Online - Market size and forecast (2023-2028)
      • Chart on Online - Market size and forecast (2023-2028) ($ million)
      • Data Table on Online - Market size and forecast (2023-2028) ($ million)
      • Chart on Online - Year-over-year growth (2023-2028) (%)
      • Data Table on Online - Year-over-year growth (2023-2028) (%)
    • 7.5 Market opportunity by Distribution Channel
      • Market opportunity by Distribution Channel ($ million)
      • Data Table on Market opportunity by Distribution Channel ($ million)

    8 Market Segmentation by Source

    • 8.1 Market segments
      • Chart on Source - Market share (2023-2028) (%)
      • Data Table on Source - Market share (2023-2028) (%)
    • 8.2 Comparison by Source
      • Chart on Comparison by Source
      • Data Table on Comparison by Source
    • 8.3 Cow Milk - Market size and forecast (2023-2028)
      • Chart on Cow Milk - Market size and forecast (2023-2028) ($ million)
      • Data Table on Cow Milk - Market size and forecast (2023-2028) ($ million)
      • Chart on Cow Milk - Year-over-year growth (2023-2028) (%)
      • Data Table on Cow Milk - Year-over-year growth (2023-2028) (%)
    • 8.4 Buffalo Milk - Market size and forecast (2023-2028)
      • Chart on Buffalo Milk - Market size and forecast (2023-2028) ($ million)
      • Data Table on Buffalo Milk - Market size and forecast (2023-2028) ($ million)
      • Chart on Buffalo Milk - Year-over-year growth (2023-2028) (%)
      • Data Table on Buffalo Milk - Year-over-year growth (2023-2028) (%)
    • 8.5 Other Animal Milk - Market size and forecast (2023-2028)
      • Chart on Other Animal Milk - Market size and forecast (2023-2028) ($ million)
      • Data Table on Other Animal Milk - Market size and forecast (2023-2028) ($ million)
      • Chart on Other Animal Milk - Year-over-year growth (2023-2028) (%)
      • Data Table on Other Animal Milk - Year-over-year growth (2023-2028) (%)
    • 8.6 Market opportunity by Source
      • Market opportunity by Source ($ million)
      • Data Table on Market opportunity by Source ($ million)

    9 Market Segmentation by Application

    • 9.1 Market segments
      • Chart on Application - Market share (2023-2028) (%)
      • Data Table on Application - Market share (2023-2028) (%)
    • 9.2 Comparison by Application
      • Chart on Comparison by Application
      • Data Table on Comparison by Application
    • 9.3 Children - Market size and forecast (2023-2028)
      • Chart on Children - Market size and forecast (2023-2028) ($ million)
      • Data Table on Children - Market size and forecast (2023-2028) ($ million)
      • Chart on Children - Year-over-year growth (2023-2028) (%)
      • Data Table on Children - Year-over-year growth (2023-2028) (%)
    • 9.4 Adults - Market size and forecast (2023-2028)
      • Chart on Adults - Market size and forecast (2023-2028) ($ million)
      • Data Table on Adults - Market size and forecast (2023-2028) ($ million)
      • Chart on Adults - Year-over-year growth (2023-2028) (%)
      • Data Table on Adults - Year-over-year growth (2023-2028) (%)
    • 9.5 Aged - Market size and forecast (2023-2028)
      • Chart on Aged - Market size and forecast (2023-2028) ($ million)
      • Data Table on Aged - Market size and forecast (2023-2028) ($ million)
      • Chart on Aged - Year-over-year growth (2023-2028) (%)
      • Data Table on Aged - Year-over-year growth (2023-2028) (%)
    • 9.6 Market opportunity by Application
      • Market opportunity by Application ($ million)
      • Data Table on Market opportunity by Application ($ million)

    10 Market Segmentation by Packaging Type

    • 10.1 Market segments
      • Chart on Packaging Type - Market share (2023-2028) (%)
      • Data Table on Packaging Type - Market share (2023-2028) (%)
    • 10.2 Comparison by Packaging Type
      • Chart on Comparison by Packaging Type
      • Data Table on Comparison by Packaging Type
    • 10.3 Pouches - Market size and forecast (2023-2028)
      • Chart on Pouches - Market size and forecast (2023-2028) ($ million)
      • Data Table on Pouches - Market size and forecast (2023-2028) ($ million)
      • Chart on Pouches - Year-over-year growth (2023-2028) (%)
      • Data Table on Pouches - Year-over-year growth (2023-2028) (%)
    • 10.4 Cartons - Market size and forecast (2023-2028)
      • Chart on Cartons - Market size and forecast (2023-2028) ($ million)
      • Data Table on Cartons - Market size and forecast (2023-2028) ($ million)
      • Chart on Cartons - Year-over-year growth (2023-2028) (%)
      • Data Table on Cartons - Year-over-year growth (2023-2028) (%)
    • 10.5 Bottles - Market size and forecast (2023-2028)
      • Chart on Bottles - Market size and forecast (2023-2028) ($ million)
      • Data Table on Bottles - Market size and forecast (2023-2028) ($ million)
      • Chart on Bottles - Year-over-year growth (2023-2028) (%)
      • Data Table on Bottles - Year-over-year growth (2023-2028) (%)
    • 10.6 Cups - Market size and forecast (2023-2028)
      • Chart on Cups - Market size and forecast (2023-2028) ($ million)
      • Data Table on Cups - Market size and forecast (2023-2028) ($ million)
      • Chart on Cups - Year-over-year growth (2023-2028) (%)
      • Data Table on Cups - Year-over-year growth (2023-2028) (%)
    • 10.7 Tubs - Market size and forecast (2023-2028)
      • Chart on Tubs - Market size and forecast (2023-2028) ($ million)
      • Data Table on Tubs - Market size and forecast (2023-2028) ($ million)
      • Chart on Tubs - Year-over-year growth (2023-2028) (%)
      • Data Table on Tubs - Year-over-year growth (2023-2028) (%)
    • 10.8 Market opportunity by Packaging Type
      • Market opportunity by Packaging Type ($ million)
      • Data Table on Market opportunity by Packaging Type ($ million)

    8 Customer Landscape

    • 8.1 Customer landscape overview
      • Exhibit 66: Analysis of price sensitivity, lifecycle, customer purchase basket, adoption rates, and purchase criteria

    9 Geographic Landscape

    • 9.1 Geographic segmentation
      • Exhibit 67: Chart on Market share by geography 2023-2028 (%)
      • Exhibit 68: Data Table on Market share by geography 2023-2028 (%)
    • 9.2 Geographic comparison
      • Exhibit 69: Chart on Geographic comparison
      • Exhibit 70: Data Table on Geographic comparison
    • 9.3 North America - Market size and forecast 2023-2028
      • Exhibit 71: Chart on North America - Market size and forecast 2023-2028 ($ million)
      • Exhibit 72: Data Table on North America - Market size and forecast 2023-2028 ($ million)
      • Exhibit 73: Chart on North America - Year-over-year growth 2023-2028 (%)
      • Exhibit 74: Data Table on North America - Year-over-year growth 2023-2028 (%)
    • 9.4 Europe - Market size and forecast 2023-2028
      • Exhibit 75: Chart on Europe - Market size and forecast 2023-2028 ($ million)
      • Exhibit 76: Data Table on Europe - Market size and forecast 2023-2028 ($ million)
      • Exhibit 77: Chart on Europe - Year-over-year growth 2023-2028 (%)
      • Exhibit 78: Data Table on Europe - Year-over-year growth 2023-2028 (%)
    • 9.5 APAC - Market size and forecast 2023-2028
      • Exhibit 79: Chart on APAC - Market size and forecast 2023-2028 ($ million)
      • Exhibit 80: Data Table on APAC - Market size and forecast 2023-2028 ($ million)
      • Exhibit 81: Chart on APAC - Year-over-year growth 2023-2028 (%)
      • Exhibit 82: Data Table on APAC - Year-over-year growth 2023-2028 (%)
    • 9.6 South America - Market size and forecast 2023-2028
      • Exhibit 83: Chart on South America - Market size and forecast 2023-2028 ($ million)
      • Exhibit 84: Data Table on South America - Market size and forecast 2023-2028 ($ million)
      • Exhibit 85: Chart on South America - Year-over-year growth 2023-2028 (%)
      • Exhibit 86: Data Table on South America - Year-over-year growth 2023-2028 (%)
    • 9.7 Middle East and Africa - Market size and forecast 2023-2028
      • Exhibit 87: Chart on Middle East and Africa - Market size and forecast 2023-2028 ($ million)
      • Exhibit 88: Data Table on Middle East and Africa - Market size and forecast 2023-2028 ($ million)
      • Exhibit 89: Chart on Middle East and Africa - Year-over-year growth 2023-2028 (%)
      • Exhibit 90: Data Table on Middle East and Africa - Year-over-year growth 2023-2028 (%)
    • 9.8 US - Market size and forecast 2023-2028
      • Exhibit 91: Chart on US - Market size and forecast 2023-2028 ($ million)
      • Exhibit 92: Data Table on US - Market size and forecast 2023-2028 ($ million)
      • Exhibit 93: Chart on US - Year-over-year growth 2023-2028 (%)
      • Exhibit 94: Data Table on US - Year-over-year growth 2023-2028 (%)
    • 9.9 Germany - Market size and forecast 2023-2028
      • Exhibit 95: Chart on Germany - Market size and forecast 2023-2028 ($ million)
      • Exhibit 96: Data Table on Germany - Market size and forecast 2023-2028 ($ million)
      • Exhibit 97: Chart on Germany - Year-over-year growth 2023-2028 (%)
      • Exhibit 98: Data Table on Germany - Year-over-year growth 2023-2028 (%)
    • 9.10 Canada - Market size and forecast 2023-2028
      • Exhibit 99: Chart on Canada - Market size and forecast 2023-2028 ($ million)
      • Exhibit 100: Data Table on Canada - Market size and forecast 2023-2028 ($ million)
      • Exhibit 101: Chart on Canada - Year-over-year growth 2023-2028 (%)
      • Exhibit 102: Data Table on Canada - Year-over-year growth 2023-2028 (%)
    • 9.11 France - Market size and forecast 2023-2028
      • Exhibit 103: Chart on France - Market size and forecast 2023-2028 ($ million)
      • Exhibit 104: Data Table on France - Market size and forecast 2023-2028 ($ million)
      • Exhibit 105: Chart on France - Year-over-year growth 2023-2028 (%)
      • Exhibit 106: Data Table on France - Year-over-year growth 2023-2028 (%)
    • 9.12 Japan - Market size and forecast 2023-2028
      • Exhibit 107: Chart on Japan - Market size and forecast 2023-2028 ($ million)
      • Exhibit 108: Data Table on Japan - Market size and forecast 2023-2028 ($ million)
      • Exhibit 109: Chart on Japan - Year-over-year growth 2023-2028 (%)
      • Exhibit 110: Data Table on Japan - Year-over-year growth 2023-2028 (%)
    • 9.13 Market opportunity by geography
      • Exhibit 111: Market opportunity by geography ($ million)
      • Exhibit 112: Data Tables on Market opportunity by geography ($ million)
    • 12.14 UK - Market size and forecast (2023-2028)
      • Chart on UK - Market size and forecast (2023-2028) ($ million)
      • Data Table on UK - Market size and forecast (2023-2028) ($ million)
      • Chart on UK - Year-over-year growth (2023-2028) (%)
      • Data Table on UK - Year-over-year growth (2023-2028) (%)
    • 12.15 Italy - Market size and forecast (2023-2028)
      • Chart on Italy - Market size and forecast (2023-2028) ($ million)
      • Data Table on Italy - Market size and forecast (2023-2028) ($ million)
      • Chart on Italy - Year-over-year growth (2023-2028) (%)
      • Data Table on Italy - Year-over-year growth (2023-2028) (%)
    • 12.16 China - Market size and forecast (2023-2028)
      • Chart on China - Market size and forecast (2023-2028) ($ million)
      • Data Table on China - Market size and forecast (2023-2028) ($ million)
      • Chart on China - Year-over-year growth (2023-2028) (%)
      • Data Table on China - Year-over-year growth (2023-2028) (%)
    • 12.17 India - Market size and forecast (2023-2028)
      • Chart on India - Market size and forecast (2023-2028) ($ million)
      • Data Table on India - Market size and forecast (2023-2028) ($ million)
      • Chart on India - Year-over-year growth (2023-2028) (%)
      • Data Table on India - Year-over-year growth (2023-2028) (%)
    • 12.18 Brazil - Market size and forecast (2023-2028)
      • Chart on Brazil - Market size and forecast (2023-2028) ($ million)
      • Data Table on Brazil - Market size and forecast (2023-2028) ($ million)
      • Chart on Brazil - Year-over-year growth (2023-2028) (%)
      • Data Table on Brazil - Year-over-year growth (2023-2028) (%)
    • 12.19 Egypt - Market size and forecast (2023-2028)
      • Chart on Egypt - Market size and forecast (2023-2028) ($ million)
      • Data Table on Egypt - Market size and forecast (2023-2028) ($ million)
      • Chart on Egypt - Year-over-year growth (2023-2028) (%)
      • Data Table on Egypt - Year-over-year growth (2023-2028) (%)
    • 12.20 UAE - Market size and forecast (2023-2028)
      • Chart on UAE - Market size and forecast (2023-2028) ($ million)
      • Data Table on UAE - Market size and forecast (2023-2028) ($ million)
      • Chart on UAE - Year-over-year growth (2023-2028) (%)
      • Data Table on UAE - Year-over-year growth (2023-2028) (%)
    • 12.21 Oman - Market size and forecast (2023-2028)
      • Chart on Oman - Market size and forecast (2023-2028) ($ million)
      • Data Table on Oman - Market size and forecast (2023-2028) ($ million)
      • Chart on Oman - Year-over-year growth (2023-2028) (%)
      • Data Table on Oman - Year-over-year growth (2023-2028) (%)
    • 12.22 Argentina - Market size and forecast (2023-2028)
      • Chart on Argentina - Market size and forecast (2023-2028) ($ million)
      • Data Table on Argentina - Market size and forecast (2023-2028) ($ million)
      • Chart on Argentina - Year-over-year growth (2023-2028) (%)
      • Data Table on Argentina - Year-over-year growth (2023-2028) (%)
    • 12.23 KSA - Market size and forecast (2023-2028)
      • Chart on KSA - Market size and forecast (2023-2028) ($ million)
      • Data Table on KSA - Market size and forecast (2023-2028) ($ million)
      • Chart on KSA - Year-over-year growth (2023-2028) (%)
      • Data Table on KSA - Year-over-year growth (2023-2028) (%)
    • 12.24 Rest of World (ROW) - Market size and forecast (2023-2028)
      • Chart on Rest of World (ROW) - Market size and forecast (2023-2028) ($ million)
      • Data Table on Rest of World (ROW) - Market size and forecast (2023-2028) ($ million)
      • Chart on Rest of World (ROW) - Year-over-year growth (2023-2028) (%)
      • Data Table on Rest of World (ROW) - Year-over-year growth (2023-2028) (%)

    10 Drivers, Challenges, and Trends

    • 10.1 Market drivers
      • 10.2 Market challenges
        • 10.3 Impact of drivers and challenges
          • Exhibit 113: Impact of drivers and challenges in 2023 and 2028
        • 10.4 Market trends

          11 Vendor Landscape

          • 11.1 Overview
            • 11.2 Vendor landscape
              • Exhibit 114: Overview on Criticality of inputs and Factors of differentiation
            • 11.3 Landscape disruption
              • Exhibit 115: Overview on factors of disruption
            • 11.4 Industry risks
              • Exhibit 116: Impact of key risks on business

            12 Vendor Analysis

            • 12.1 Vendors covered
              • Exhibit 117: Vendors covered
            • 12.2 Market positioning of vendors
              • Exhibit 118: Matrix on vendor position and classification
            • 12.3 Amazon.com Inc.
              • Exhibit 119: Amazon.com Inc. - Overview
              • Exhibit 120: Amazon.com Inc. - Business segments
              • Exhibit 121: Amazon.com Inc. - Key news
              • Exhibit 122: Amazon.com Inc. - Key offerings
              • Exhibit 123: Amazon.com Inc. - Segment focus
            • 12.4 Arla Foods amba
              • Exhibit 124: Arla Foods amba - Overview
              • Exhibit 125: Arla Foods amba - Business segments
              • Exhibit 126: Arla Foods amba - Key offerings
              • Exhibit 127: Arla Foods amba - Segment focus
            • 12.5 Dairy Farmers of America Inc.
              • Exhibit 128: Dairy Farmers of America Inc. - Overview
              • Exhibit 129: Dairy Farmers of America Inc. - Product / Service
              • Exhibit 130: Dairy Farmers of America Inc. - Key offerings
            • 12.6 DANA Dairy Group Ltd.
              • Exhibit 131: DANA Dairy Group Ltd. - Overview
              • Exhibit 132: DANA Dairy Group Ltd. - Product / Service
              • Exhibit 133: DANA Dairy Group Ltd. - Key offerings
            • 12.7 Danone SA
              • Exhibit 134: Danone SA - Overview
              • Exhibit 135: Danone SA - Business segments
              • Exhibit 136: Danone SA - Key news
              • Exhibit 137: Danone SA - Key offerings
              • Exhibit 138: Danone SA - Segment focus
            • 12.8 Fonterra Cooperative Group Ltd.
              • Exhibit 139: Fonterra Cooperative Group Ltd. - Overview
              • Exhibit 140: Fonterra Cooperative Group Ltd. - Business segments
              • Exhibit 141: Fonterra Cooperative Group Ltd. - Key offerings
              • Exhibit 142: Fonterra Cooperative Group Ltd. - Segment focus
            • 12.9 General Mills Inc.
              • Exhibit 143: General Mills Inc. - Overview
              • Exhibit 144: General Mills Inc. - Business segments
              • Exhibit 145: General Mills Inc. - Key news
              • Exhibit 146: General Mills Inc. - Key offerings
              • Exhibit 147: General Mills Inc. - Segment focus
            • 12.10 Gujarat Cooperative Milk Marketing Federation Ltd.
              • Exhibit 148: Gujarat Cooperative Milk Marketing Federation Ltd. - Overview
              • Exhibit 149: Gujarat Cooperative Milk Marketing Federation Ltd. - Product / Service
              • Exhibit 150: Gujarat Cooperative Milk Marketing Federation Ltd. - Key offerings
            • 12.11 Land O Lakes Inc.
              • Exhibit 151: Land O Lakes Inc. - Overview
              • Exhibit 152: Land O Lakes Inc. - Product / Service
              • Exhibit 153: Land O Lakes Inc. - Key offerings
            • 12.12 Meiji Holdings Co. Ltd.
              • Exhibit 154: Meiji Holdings Co. Ltd. - Overview
              • Exhibit 155: Meiji Holdings Co. Ltd. - Business segments
              • Exhibit 156: Meiji Holdings Co. Ltd. - Key news
              • Exhibit 157: Meiji Holdings Co. Ltd. - Key offerings
              • Exhibit 158: Meiji Holdings Co. Ltd. - Segment focus
            • 12.13 Nestle SA
              • Exhibit 159: Nestle SA - Overview
              • Exhibit 160: Nestle SA - Business segments
              • Exhibit 161: Nestle SA - Key news
              • Exhibit 162: Nestle SA - Key offerings
              • Exhibit 163: Nestle SA - Segment focus
            • 12.14 Royal FrieslandCampina NV
              • Exhibit 164: Royal FrieslandCampina NV - Overview
              • Exhibit 165: Royal FrieslandCampina NV - Business segments
              • Exhibit 166: Royal FrieslandCampina NV - Key news
              • Exhibit 167: Royal FrieslandCampina NV - Key offerings
              • Exhibit 168: Royal FrieslandCampina NV - Segment focus
            • 12.15 Saputo Inc.
              • Exhibit 169: Saputo Inc. - Overview
              • Exhibit 170: Saputo Inc. - Business segments
              • Exhibit 171: Saputo Inc. - Key news
              • Exhibit 172: Saputo Inc. - Key offerings
              • Exhibit 173: Saputo Inc. - Segment focus
            • 12.16 Schreiber Foods Inc.
              • Exhibit 174: Schreiber Foods Inc. - Overview
              • Exhibit 175: Schreiber Foods Inc. - Product / Service
              • Exhibit 176: Schreiber Foods Inc. - Key offerings
            • 12.17 The Kroger Co.
              • Exhibit 177: The Kroger Co. - Overview
              • Exhibit 178: The Kroger Co. - Product / Service
              • Exhibit 179: The Kroger Co. - Key offerings

            13 Appendix

            • 13.1 Scope of the report
              • 13.2 Inclusions and exclusions checklist
                • Exhibit 180: Inclusions checklist
                • Exhibit 181: Exclusions checklist
              • 13.3 Currency conversion rates for US$
                • Exhibit 182: Currency conversion rates for US$
              • 13.4 Research methodology
                • Exhibit 183: Research methodology
                • Exhibit 184: Validation techniques employed for market sizing
                • Exhibit 185: Information sources
              • 13.5 List of abbreviations
                • Exhibit 186: List of abbreviations

              Research Methodology

              Technavio presents a detailed picture of the market by way of study, synthesis, and summation of data from multiple sources. The analysts have presented the various facets of the market with a particular focus on identifying the key industry influencers. The data thus presented is comprehensive, reliable, and the result of extensive research, both primary and secondary.

              INFORMATION SOURCES

              Primary sources

              • Manufacturers and suppliers
              • Channel partners
              • Industry experts
              • Strategic decision makers

              Secondary sources

              • Industry journals and periodicals
              • Government data
              • Financial reports of key industry players
              • Historical data
              • Press releases

              DATA ANALYSIS

              Data Synthesis

              • Collation of data
              • Estimation of key figures
              • Analysis of derived insights

              Data Validation

              • Triangulation with data models
              • Reference against proprietary databases
              • Corroboration with industry experts

              REPORT WRITING

              Qualitative

              • Market drivers
              • Market challenges
              • Market trends
              • Five forces analysis

              Quantitative

              • Market size and forecast
              • Market segmentation
              • Geographical insights
              • Competitive landscape

              Interested in this report?

              Get your sample now to see our research methodology and insights!

              Download Now

              Frequently Asked Questions

              Organic Dairy Products market growth will increase by $ 9091.89 mn during 2024-2028.

              The Organic Dairy Products market is expected to grow at a CAGR of 6.52% during 2024-2028.

              Organic Dairy Products market is segmented by Product( Organic milk, Organic yogurt, Organic cheese, Others) Distribution Channel( Offline, Online, APAC, South America, MEA)

              Agropur Dairy Cooperative, Amazon.com Inc., Arla Foods amba, Dairy Farmers of America Inc., DANA Dairy Group Ltd., Danone SA, Fonterra Cooperative Group Ltd., General Mills Inc., Gujarat Cooperative Milk Marketing Federation Ltd., Land O Lakes Inc., Meiji Holdings Co. Ltd., MVM Pack Holding AG, Nestle SA, Royal FrieslandCampina NV, Saputo Inc., Savencia SA, Schreiber Foods Inc., Sodiaal, The Kroger Co., Organic Valley are a few of the key vendors in the Organic Dairy Products market.

              North America will register the highest growth rate of 37% among the other regions. Therefore, the Organic Dairy Products market in North America is expected to garner significant business opportunities for the vendors during the forecast period.

              US, Canada, Germany, UK, Italy, France, China, India, Japan, Brazil, Egypt, UAE, Oman, Argentina, KSA, UAE, Brazil, Rest of World (ROW)

              • Increasing awareness of benefits of organic dairy productsThe increasing awareness about the health aspects of foods has increased the demand for organic products worldwide is the driving factor this market.
              • like organic dairy products. Consumers prefer organic dairy products for their several nutritional benefits. Organic milk provides higher levels of omega-3 fatty acids is the driving factor this market.
              • Conjugated Linoleic Acid (CLA) is the driving factor this market.
              • antioxidants is the driving factor this market.
              • and vitamins compared to conventional milk. Currently is the driving factor this market.
              • different hormones and chemicals that are hazardous to health are being mixed into milk products. The increased awareness among consumers about the harmful effects of chemicals present in regular/conventional milk has turned them toward organic milk. Countries like the US is the driving factor this market.
              • Germany is the driving factor this market.
              • and the UK are increasingly adopting organic milk consumption more than ever. Organic milk contains omega-3 is the driving factor this market.
              • which helps prevent various diseases and also reduces the incidence of heart disease is the driving factor this market.
              • inflammation is the driving factor this market.
              • cancer is the driving factor this market.
              • and arthritis. Recent studies suggest that a diet rich in omega-3 fatty acids reduces the chances of Amyotrophic lateral sclerosis (ALS). These benefits promote the consumption of organic milk products and other derived products is the driving factor this market.
              • such as organic cheese is the driving factor this market.
              • organic butter is the driving factor this market.
              • organic yogurt is the driving factor this market.
              • organic ice creams is the driving factor this market.
              • and others. Therefore is the driving factor this market.
              • the consumption of organic dairy products during the forecast period is expected to continue. In the manufacturing of non-organic/regular milk is the driving factor this market.
              • BGH (Bovine Growth Hormone) and rBST (recombinant bovine somatotropin) are the hormones used to increase milk production in cows. However is the driving factor this market.
              • this results in the growth of insulin-like IGF-1 in the milk is the driving factor this market.
              • which stays even after pasteurization and subsequently gets absorbed into the bloodstream of people. Japan is the driving factor this market.
              • Canada is the driving factor this market.
              • Australia is the driving factor this market.
              • and certain EU member countries have banned the consumption of non-organic IGF-1 milk due to alleged breast cancer risks. Organic products are normally considered healthier than their conventional counterparts owing to the absence of chemical pesticides is the driving factor this market.
              • fertilizers is the driving factor this market.
              • GMOs is the driving factor this market.
              • antibiotics is the driving factor this market.
              • and other harmful chemicals. Similarly is the driving factor this market.
              • organic milk is considered healthier than regular milk. Thus is the driving factor this market.
              • increasing awareness about the benefits of organic dairy products will drive the growth of the market in focus during the forecast period. is the driving factor this market.

              The Organic Dairy Products market vendors should focus on grabbing business opportunities from the Organic milk segment as it accounted for the largest market share in the base year.
              RIA - Research AI Assistant
              Ask RIA