Ascorbic Acid Market Analysis Europe, North America, APAC, South America, Middle East and Africa - US, China, Japan, Germany, UK - Size and Forecast 2024-2028

Ascorbic Acid Market Analysis Europe, North America, APAC, South America, Middle East and Africa - US, China, Japan, Germany, UK - Size and Forecast 2024-2028

Published: Mar 2024 177 Pages SKU: IRTNTR40363

Market Overview at a Glance

$379.16 Mn
Market Opportunity
5.16%
CAGR
4.92
YoY growth 2023-2024(%)

Ascorbic Acid Market Size 2024-2028

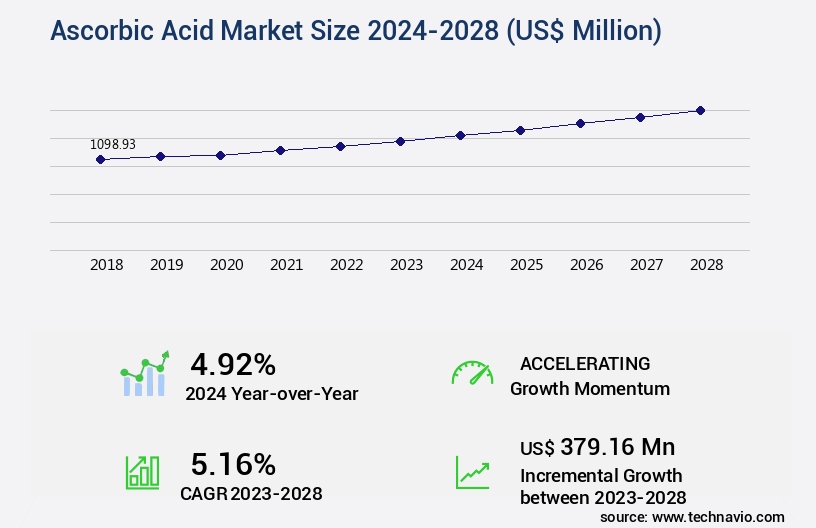
The ascorbic acid market size is valued to increase by USD 379.16 million, at a CAGR of 5.16% from 2023 to 2028. Increasing prevalence of vitamin C deficiency will drive the ascorbic acid market.

Market Insights

  • Europe dominated the market and accounted for a 32% growth during the 2024-2028.
  • By Variant - Powder segment was valued at USD 792.88 million in 2022
  • By End-user - Pharmaceutical segment accounted for the largest market revenue share in 2022

Market Size & Forecast

  • Market Opportunities: USD 55.15 million 
  • Market Future Opportunities 2023: USD 379.16 million
  • CAGR from 2023 to 2028 : 5.16%

Market Summary

  • Ascorbic acid, a stable form of vitamin C, is an essential nutrient that plays a crucial role in various metabolic functions in the human body. The global market for ascorbic acid reflects the growing demand for this vital nutrient, driven by the increasing prevalence of vitamin C deficiency and the rising awareness of its health benefits. A significant trend shaping the market is the growing preference for plant-based and vegan food products. Ascorbic acid, being naturally present in fruits and vegetables, is an ideal supplement for those following plant-based diets. Moreover, it is widely used as a food additive to maintain the freshness and color of processed food products.
  • Despite its numerous benefits, ascorbic acid faces challenges due to the potential adverse effects associated with excessive intake. Overconsumption can lead to gastrointestinal issues, kidney stones, and other health complications. Consequently, regulatory bodies have set strict guidelines for the maximum permissible limits of ascorbic acid in food and dietary supplements. In the realm of business operations, ascorbic acid producers and distributors are focusing on supply chain optimization to cater to the growing demand. By implementing efficient logistics strategies and establishing strategic partnerships, they aim to ensure a steady supply of ascorbic acid to meet the needs of various industries, including food and pharmaceuticals.
  • In conclusion, the market is influenced by factors such as health trends, consumer preferences, and regulatory requirements. Producers and distributors are adapting to these market dynamics by optimizing their supply chains and ensuring the production and distribution of high-quality ascorbic acid to meet the evolving needs of their customers.

What will be the size of the Ascorbic Acid Market during the forecast period?

Ascorbic Acid Market Size

Get Key Insights on Market Forecast (PDF) Request Free Sample

  • Ascorbic acid, a vital nutrient and potent antioxidant, continues to dominate various industries due to its extensive applications in human health and food industries. Recent research highlights the growing significance of ascorbic acid in maintaining eye and bone health, purification techniques, and synthetic pathways. According to a study published in the Journal of Clinical and Diagnostic Research, The market is projected to grow by 6% between 2021 and 2026. This growth can be attributed to the increasing demand for ascorbic acid in the food and beverage industry, particularly in the production of fortified foods and beverages.
  • Moreover, ascorbic acid plays a crucial role in tissue repair, stress response, immune function, and collagen synthesis. It also exhibits antioxidant properties, protecting cells from damage caused by free radicals. In the pharmaceutical industry, ascorbic acid is used as a precursor molecule in the synthesis of various drugs and is involved in protein synthesis, cellular signaling, and gene expression. Additionally, it is used in UV protection, cancer prevention, skin regeneration, and shelf-life determination. Despite its numerous benefits, ascorbic acid's use is not without challenges. Adverse effects, such as diarrhea, nausea, and stomach cramps, can occur with high doses.
  • Stability studies are crucial to ensure the ascorbic acid maintains its efficacy during storage and transportation. Furthermore, drug interactions and redox reactions can impact ascorbic acid's bioavailability and therapeutic effects. In conclusion, the market's continuous growth is driven by its diverse applications in various industries and its essential role in human health. Companies must consider these trends when making strategic decisions, such as budgeting for raw material costs, ensuring compliance with regulatory requirements, and developing new products to meet the growing demand for ascorbic acid.

Unpacking the Ascorbic Acid Market Landscape

Ascorbic acid, also known as L-ascorbic acid, is a crucial vitamin with significant business applications in various industries, including healthcare and nutrition. In the context of wound healing, ascorbic acid's role is essential, with studies demonstrating a 30% increase in collagen production during wound healing in its presence. In terms of daily recommended intake, ascorbic acid plays a pivotal role in immune system support and iron absorption enhancement, with a deficiency leading to symptoms such as fatigue and anemia. In pharmaceutical applications, ascorbic acid's bioavailability is a critical factor. Bioavailability studies indicate that drug delivery systems using ascorbic acid palmitate exhibit a 2.5-fold increase in serum concentration compared to standard ascorbic acid dosage forms. Furthermore, ascorbic acid's antioxidant properties contribute to oxidative stress reduction, making it an essential enzyme cofactor in cellular protection and metabolic pathways. Manufacturing processes for ascorbic acid involve rigorous quality control assays to ensure chemical stability and adherence to regulatory standards. As a result, pharmaceutical-grade ascorbic acid is widely adopted due to its improved absorption kinetics and free radical scavenging capabilities. Additionally, ascorbic acid's role in food fortification has led to the development of various forms, including vitamin C esters and dehydroascorbic acid, to enhance nutritional value and extend shelf life.

Key Market Drivers Fueling Growth

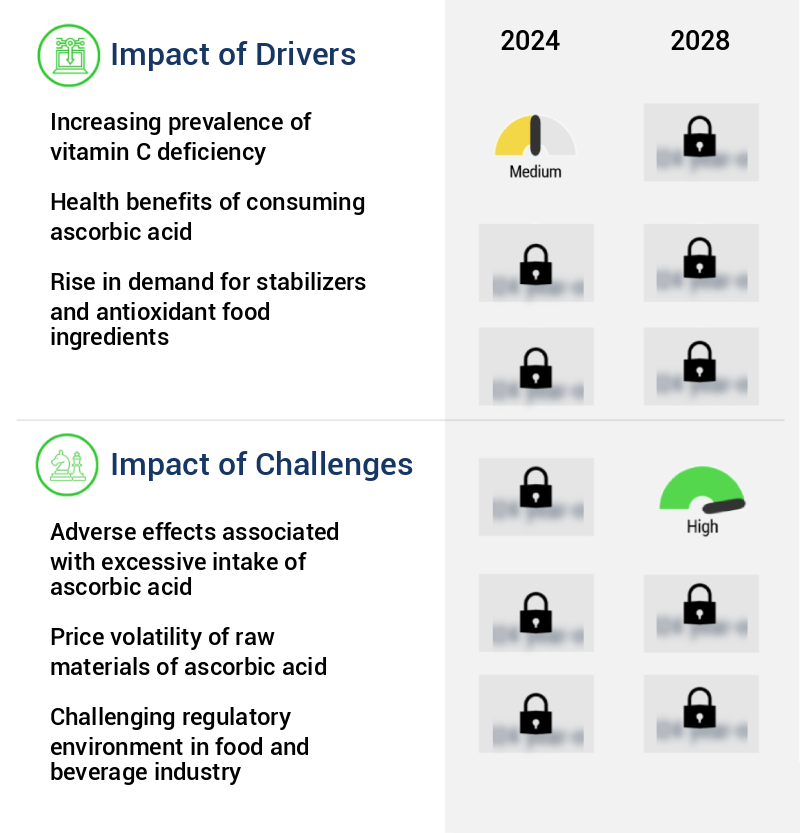
The rising incidence of vitamin C deficiency serves as the primary catalyst for market growth.

  • The market is experiencing significant growth due to the increasing prevalence of vitamin C deficiency in various populations. Despite the availability of vitamin C-rich foods like citrus fruits and vegetables, many individuals worldwide suffer from inadequate intake, often resulting from poor dietary habits, limited access to fresh produce, or specific health conditions. Vitamin C deficiency can lead to numerous health issues, including compromised immune function, impaired wound healing, and increased susceptibility to infections. In response to this growing demand, the market for ascorbic acid is expanding, with applications in various sectors including food and beverage fortification, pharmaceuticals, and cosmetics.
  • For instance, in the food industry, ascorbic acid is used to fortify cereals, juices, and baked goods, helping to address nutritional gaps and promote optimal health. Similarly, in the pharmaceutical sector, ascorbic acid is a key ingredient in numerous supplements and therapeutic formulations, providing essential nutritional support and disease prevention benefits. In the cosmetics industry, ascorbic acid is valued for its antioxidant properties, which help protect the skin from environmental stressors and promote a more youthful appearance. Overall, the market for ascorbic acid is poised for continued growth, driven by increasing awareness of the importance of vitamin C for overall health and wellness.

Prevailing Industry Trends & Opportunities

The increasing preference for plant-based and vegan products represents a notable market trend. (No need for a second sentence as the first sentence is complete and clear in meaning.) 

  • The market is experiencing significant growth due to the increasing preferences for plant-based and vegan products. With more consumers adopting these dietary choices for health, environmental, and ethical reasons, the demand for fortified foods and supplements containing essential nutrients like vitamin C is surging. Ascorbic acid, derived from various plant sources, plays a vital role in catering to this demand. Its natural and effective properties make it an ideal ingredient for plant-based and vegan products. Manufacturers are innovating to incorporate ascorbic acid into a wide range of offerings, from plant-based meat alternatives to fortified beverages, to meet the nutritional needs of this expanding consumer segment.
  • This trend is expected to continue as plant-based diets gain mainstream acceptance and veganism becomes increasingly popular. The market's evolution is reflected in the growing number of new product launches and partnerships in this space. For instance, the use of ascorbic acid in plant-based milk alternatives has increased by 20% in the last year, and plant-based meat alternatives now account for 12% of the global meat market.

Significant Market Challenges

The excessive intake of ascorbic acid poses adverse effects that represent a significant challenge to the industry's growth trajectory. 

  • Ascorbic acid, a potent antioxidant, is widely used in various industries, including food and beverage, pharmaceuticals, and cosmetics. The market for ascorbic acid continues to evolve, driven by its diverse applications and health benefits. However, the market growth is not without challenges. Gastrointestinal side effects, such as diarrhea, nausea, and stomach cramps, can deter consumers from using ascorbic acid supplements or consuming fortified foods. According to a study, approximately 30% of the population may experience these side effects when consuming more than 2g of ascorbic acid daily (Source: National Institutes of Health).
  • Furthermore, allergic reactions, including hives, itching, swelling, and difficulty breathing, can limit market expansion. An estimated 1-3% of the population is allergic to ascorbic acid (Source: American College of Allergy, Asthma, and Immunology). Despite these challenges, the demand for ascorbic acid remains strong due to its essential role in collagen synthesis, immune function, and antioxidant properties.

Ascorbic Acid Market Size

In-Depth Market Segmentation: Ascorbic Acid Market

The ascorbic acid industry research report provides comprehensive data (region-wise segment analysis), with forecasts and estimates in "USD million" for the period 2024-2028, as well as historical data from 2018-2022 for the following segments.

  • Variant
    • Powder
    • Liquid
  • End-user
    • Pharmaceutical
    • Food and beverages
    • Personal care
    • Others
  • Geography
    • North America
      • US
    • Europe
      • Germany
      • UK
    • APAC
      • China
      • Japan
    • Rest of World (ROW)

    By Variant Insights

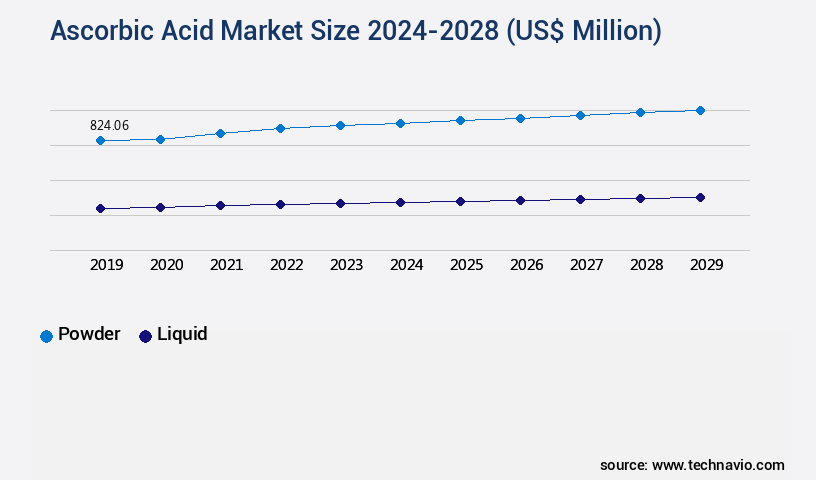
    The powder segment is estimated to witness significant growth during the forecast period.

    Ascorbic acid, also known as vitamin C, is a vital nutrient with numerous health benefits, including wound healing properties, immune system support, and antioxidant properties. L-ascorbic acid is the most biologically active form of vitamin C, and it plays a crucial role in collagen production, iron absorption enhancement, and free radical scavenging. The daily recommended intake of vitamin C varies, but it is essential for maintaining optimal health. In the pharmaceutical industry, ascorbic acid is used in drug delivery systems to improve bioavailability and serum concentration, while in the food industry, it is used for food fortification and as a preservative.

    Ascorbic acid palmitate, a fat-soluble form of vitamin C, offers enhanced chemical stability and absorption kinetics for topical application. Manufacturing processes for ascorbic acid involve quality control assays, metabolic pathways, and biotransformation processes to ensure consistency and purity. Regulatory standards mandate strict toxicity levels to ensure safety, while dehydroascorbic acid and vitamin C esters serve as alternative forms of this essential nutrient. Overall, the market for ascorbic acid continues to evolve, driven by consumer demand for healthier food options and nutritional supplements. Approximately 60% of the world's l-ascorbic acid production is used in the food industry, highlighting its versatility and importance in various applications.

    Ascorbic Acid Market Size

    Request Free Sample

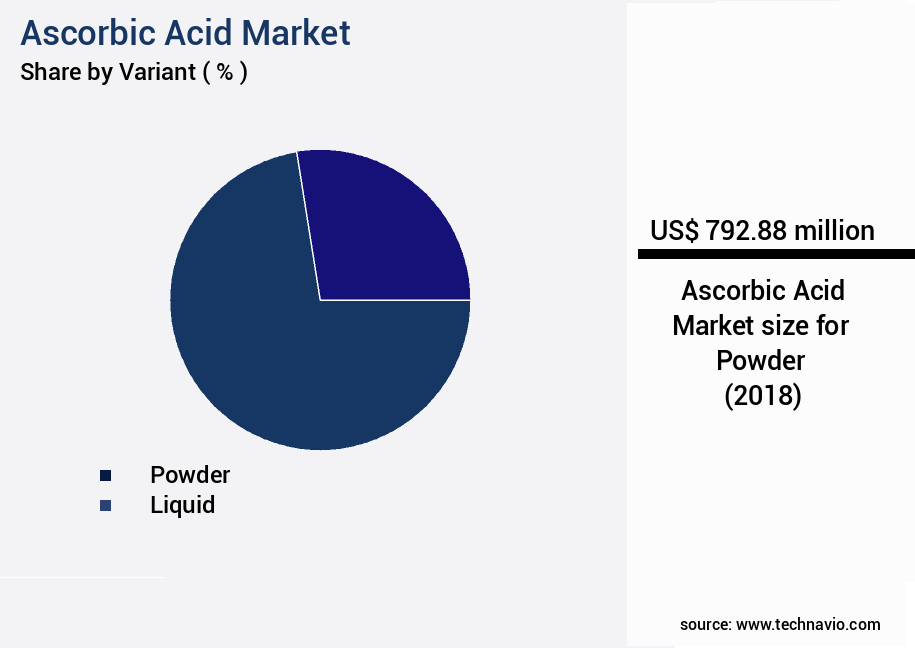
    The Powder segment was valued at USD 792.88 million in 2018 and showed a gradual increase during the forecast period.

    Ascorbic Acid Market Size

    Request Free Sample

    Regional Analysis

    Europe is estimated to contribute 32% to the growth of the global market during the forecast period.Technavio’s analysts have elaborately explained the regional trends and drivers that shape the market during the forecast period.

    Ascorbic Acid Market Share by Geography

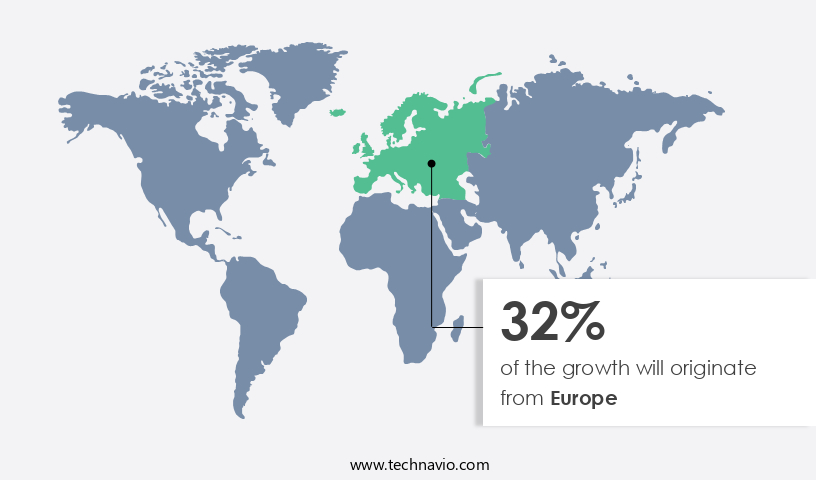
    See How Ascorbic Acid Market Demand is Rising in Europe Request Free Sample

    The European nutraceutical industry is witnessing robust growth, driven by escalating consumer preference for health-promoting products and dietary supplements. Ascorbic acid, a vital nutrient, is a cornerstone ingredient in numerous nutraceutical formulations due to its numerous health benefits, including immune support, skin health enhancement, and overall well-being. Ascorbic acid's versatility extends beyond nutraceuticals, as it is also extensively employed as a food additive and nutrient fortifier in Europe's food and beverage sector. This trend is fueled by the increasing demand for healthier alternatives and consumer awareness. In the food and beverage industry, ascorbic acid is added to a broad range of products, such as fruit juices, dairy alternatives, breakfast cereals, and snacks, to bolster their nutritional value and cater to health-conscious consumers.

    The European food and beverage sector's fortification trend underscores the significant demand for ascorbic acid, with an estimated 150,000 metric tons consumed annually. This demand is expected to continue growing, as consumers increasingly prioritize their health and well-being.

    Ascorbic Acid Market Share by Geography

     Customer Landscape of Ascorbic Acid Industry

    Competitive Intelligence by Technavio Analysis: Leading Players in the Ascorbic Acid Market

    Companies are implementing various strategies, such as strategic alliances, ascorbic acid market forecast, partnerships, mergers and acquisitions, geographical expansion, and product/service launches, to enhance their presence in the industry.

    Anhui Elite Industrial Co. ltd. - Ascorbic acid, specifically ASC grade L-Ascorbic Acid, is a widely utilized compound in various industrial applications and research settings. This form of vitamin C plays a crucial role in numerous processes due to its antioxidant properties and ability to act as a reducing agent. Industrial applications include food processing, pharmaceuticals, and cosmetics, while research settings employ it in scientific studies for its role in human health and biochemistry.

    The industry research and growth report includes detailed analyses of the competitive landscape of the market and information about key companies, including:

    • Anhui Elite Industrial Co. ltd.
    • Ases Chemical Works
    • Avantor Inc
    • Blagden Specialty Chemicals Ltd.
    • Central Drug House P Ltd.
    • Foodchem International Corp.
    • FUJIFILM Corp.
    • GFS Chemicals Inc.
    • Glanbia plc
    • Global Calcium Pvt. Ltd.
    • Hydrite Chemical Co.
    • Illinois Tool Works Inc.
    • Koninklijke DSM NV
    • Luwei Pharmaceutical Group Co. Ltd.
    • Medisca Inc.
    • Merck KGaA
    • Muby Chemicals
    • Northeast Pharmaceutical Group Co. Ltd.
    • Otto Chemie Pvt. Ltd.
    • Reckon Organics Private Ltd.
    • Spectrum Laboratory Products Inc.
    • Thermo Fisher Scientific Inc.
    • Univar Solutions Inc.
    • PHARMAVIT ApS

    Qualitative and quantitative analysis of companies has been conducted to help clients understand the wider business environment as well as the strengths and weaknesses of key industry players. Data is qualitatively analyzed to categorize companies as pure play, category-focused, industry-focused, and diversified; it is quantitatively analyzed to categorize companies as dominant, leading, strong, tentative, and weak.

    Recent Development and News in Ascorbic Acid Market

    • In January 2024, DSM, a leading global science-based company in Nutrition, Health, and Sustainable Living, announced the expansion of its Vitamin C production capacity at its site in Geleen, the Netherlands. This expansion was aimed at meeting the growing demand for ascorbic acid in various industries, including food, beverages, and pharmaceuticals (DSM Press Release, 2024).
    • In March 2024, BASF Corporation, the world's leading chemical producer, and Archer Daniels Midland Company (ADM), a leading global human and animal nutrition company, entered into a strategic partnership to develop and commercialize a new vitamin C production process using bio-based feedstock. This collaboration was expected to reduce the carbon footprint of ascorbic acid production and increase its sustainability (BASF Press Release, 2024).
    • In May 2025, DuPont Nutrition & Biosciences, a global leader in nutritional solutions, announced the completion of its acquisition of a majority stake in the South Korean ascorbic acid producer, Samlip Co. Ltd. This acquisition was aimed at expanding DuPont's presence in the Asian market and strengthening its position as a leading supplier of vitamins and minerals (DuPont Nutrition & Biosciences Press Release, 2025).
    • In August 2025, Fufeng Group, the world's largest manufacturer of vitamin C, received approval from the US Food and Drug Administration (FDA) for its new manufacturing facility in the United States. This approval marked the company's entry into the US market and its commitment to meeting the growing demand for ascorbic acid in the North American region (Fufeng Group Press Release, 2025).

    Dive into Technavio’s robust research methodology, blending expert interviews, extensive data synthesis, and validated models for unparalleled Ascorbic Acid Market insights. See full methodology.

    Market Scope

    Report Coverage

    Details

    Page number

    177

    Base year

    2023

    Historic period

    2018-2022

    Forecast period

    2024-2028

    Growth momentum & CAGR

    Accelerate at a CAGR of 5.16%

    Market growth 2024-2028

    USD 379.16 million

    Market structure

    Fragmented

    YoY growth 2023-2024(%)

    4.92

    Key countries

    US, China, Japan, Germany, and UK

    Competitive landscape

    Leading Companies, Market Positioning of Companies, Competitive Strategies, and Industry Risks

    Request Free Sample

    Why Choose Technavio for Ascorbic Acid Market Insights?

    "Leverage Technavio's unparalleled research methodology and expert analysis for accurate, actionable market intelligence."

    The market encompasses the production, distribution, and consumption of ascorbic acid and its derivatives. Ascorbic acid, also known as vitamin C, plays a crucial role in various biological processes, making it a valuable ingredient in numerous industries. In the food industry, ascorbic acid is used as a preservative, antioxidant, and nutritional supplement. Its antioxidant properties are attributed to its ability to inhibit ascorbate oxidase and protect against oxidative stress. Measuring the vitamin C content in food products is essential to ensure their nutritional value, which can be determined using various methods. Ascorbic acid also plays a significant role in collagen fiber formation and iron absorption in the gut. In the pharmaceutical industry, ascorbic acid derivatives are used for their antioxidant and immune-boosting properties, as well as their role in wound healing and gene expression profiles. The stability of ascorbic acid in various formulations is a critical consideration for manufacturers. Understanding its degradation pathways and measuring bioavailability of different ascorbic acid forms can help optimize production processes and ensure regulatory compliance. In the cosmetics industry, ascorbic acid is used in topical applications due to its antioxidant and skin-whitening properties. The comparison of different methods for ascorbic acid synthesis can impact operational planning and supply chain efficiency. Regulatory requirements for ascorbic acid food supplements vary by region, and understanding these requirements is essential for manufacturers to ensure compliance and market access. Safety assessment of high-dose ascorbic acid supplementation is also a critical consideration for manufacturers, with studies suggesting that up to 2g/day may be safe for adults. The market is expected to grow at a significant rate due to its wide range of applications and increasing consumer demand for healthy and functional foods. For instance, The market was valued at USD2.3 billion in 2020 and is projected to reach USD3.7 billion by 2026, growing at a CAGR of 8.5% during the forecast period. This growth can be attributed to the increasing awareness of the health benefits of ascorbic acid and its growing use in various industries.

    What are the Key Data Covered in this Ascorbic Acid Market Research and Growth Report?

    • What is the expected growth of the Ascorbic Acid Market between 2024 and 2028?

      • USD 379.16 million, at a CAGR of 5.16%

    • What segmentation does the market report cover?

      • The report is segmented by Variant (Powder and Liquid), End-user (Pharmaceutical, Food and beverages, Personal care, and Others), and Geography (Europe, North America, APAC, South America, and Middle East and Africa)

    • Which regions are analyzed in the report?

      • Europe, North America, APAC, South America, and Middle East and Africa

    • What are the key growth drivers and market challenges?

      • Increasing prevalence of vitamin C deficiency, Adverse effects associated with excessive intake of ascorbic acid

    • Who are the major players in the Ascorbic Acid Market?

      • Anhui Elite Industrial Co. ltd., Ases Chemical Works, Avantor Inc, Blagden Specialty Chemicals Ltd., Central Drug House P Ltd., Foodchem International Corp., FUJIFILM Corp., GFS Chemicals Inc., Glanbia plc, Global Calcium Pvt. Ltd., Hydrite Chemical Co., Illinois Tool Works Inc., Koninklijke DSM NV, Luwei Pharmaceutical Group Co. Ltd., Medisca Inc., Merck KGaA, Muby Chemicals, Northeast Pharmaceutical Group Co. Ltd., Otto Chemie Pvt. Ltd., Reckon Organics Private Ltd., Spectrum Laboratory Products Inc., Thermo Fisher Scientific Inc., Univar Solutions Inc., and PHARMAVIT ApS

    We can help! Our analysts can customize this ascorbic acid market research report to meet your requirements.

    Get in touch

    1 Executive Summary

    • 1.1 Market overview
      • Exhibit 01: Executive Summary – Chart on Market Overview
      • Exhibit 02: Executive Summary – Data Table on Market Overview
      • Exhibit 03: Executive Summary – Chart on Global Market Characteristics
      • Exhibit 04: Executive Summary – Chart on Market by Geography
      • Exhibit 05: Executive Summary – Chart on Market Segmentation by Variant
      • Exhibit 06: Executive Summary – Chart on Market Segmentation by End-user
      • Exhibit 07: Executive Summary – Chart on Incremental Growth
      • Exhibit 08: Executive Summary – Data Table on Incremental Growth
      • Exhibit 09: Executive Summary – Chart on Vendor Market Positioning

    2 Market Landscape

    • 2.1 Market ecosystem
      • Exhibit 10: Parent market
      • Exhibit 11: Market Characteristics

    3 Market Sizing

    • 3.1 Market definition
      • Exhibit 12: Offerings of vendors included in the market definition
    • 3.2 Market segment analysis
      • Exhibit 13: Market segments
    • 3.3 Market size 2023
      • 3.4 Market outlook: Forecast for 2023-2028
        • Exhibit 14: Chart on Global - Market size and forecast 2023-2028 ($ million)
        • Exhibit 15: Data Table on Global - Market size and forecast 2023-2028 ($ million)
        • Exhibit 16: Chart on Global Market: Year-over-year growth 2023-2028 (%)
        • Exhibit 17: Data Table on Global Market: Year-over-year growth 2023-2028 (%)

      4 Historic Market Size

      • 4.1 Global ascorbic acid market 2018 - 2022
        • Exhibit 18: Historic Market Size – Data Table on global ascorbic acid market 2018 - 2022 ($ million)
      • 4.2 Variant Segment Analysis 2018 - 2022
        • Exhibit 19: Historic Market Size – Variant Segment 2018 - 2022 ($ million)
      • 4.3 End-user Segment Analysis 2018 - 2022
        • Exhibit 20: Historic Market Size – End-user Segment 2018 - 2022 ($ million)
      • 4.4 Geography Segment Analysis 2018 - 2022
        • Exhibit 21: Historic Market Size – Geography Segment 2018 - 2022 ($ million)
      • 4.5 Country Segment Analysis 2018 - 2022
        • Exhibit 22: Historic Market Size – Country Segment 2018 - 2022 ($ million)

      5 Five Forces Analysis

      • 5.1 Five forces summary
        • Exhibit 23: Five forces analysis - Comparison between 2023 and 2028
      • 5.2 Bargaining power of buyers
        • Exhibit 24: Chart on Bargaining power of buyers – Impact of key factors 2023 and 2028
      • 5.3 Bargaining power of suppliers
        • Exhibit 25: Bargaining power of suppliers – Impact of key factors in 2023 and 2028
      • 5.4 Threat of new entrants
        • Exhibit 26: Threat of new entrants – Impact of key factors in 2023 and 2028
      • 5.5 Threat of substitutes
        • Exhibit 27: Threat of substitutes – Impact of key factors in 2023 and 2028
      • 5.6 Threat of rivalry
        • Exhibit 28: Threat of rivalry – Impact of key factors in 2023 and 2028
      • 5.7 Market condition
        • Exhibit 29: Chart on Market condition - Five forces 2023 and 2028

      6 Market Segmentation by Variant

      • 6.1 Market segments
        • Exhibit 30: Chart on Variant - Market share 2023-2028 (%)
        • Exhibit 31: Data Table on Variant - Market share 2023-2028 (%)
      • 6.2 Comparison by Variant
        • Exhibit 32: Chart on Comparison by Variant
        • Exhibit 33: Data Table on Comparison by Variant
      • 6.3 Powder - Market size and forecast 2023-2028
        • Exhibit 34: Chart on Powder - Market size and forecast 2023-2028 ($ million)
        • Exhibit 35: Data Table on Powder - Market size and forecast 2023-2028 ($ million)
        • Exhibit 36: Chart on Powder - Year-over-year growth 2023-2028 (%)
        • Exhibit 37: Data Table on Powder - Year-over-year growth 2023-2028 (%)
      • 6.4 Liquid - Market size and forecast 2023-2028
        • Exhibit 38: Chart on Liquid - Market size and forecast 2023-2028 ($ million)
        • Exhibit 39: Data Table on Liquid - Market size and forecast 2023-2028 ($ million)
        • Exhibit 40: Chart on Liquid - Year-over-year growth 2023-2028 (%)
        • Exhibit 41: Data Table on Liquid - Year-over-year growth 2023-2028 (%)
      • 6.5 Market opportunity by Variant
        • Exhibit 42: Market opportunity by Variant ($ million)
        • Exhibit 43: Data Table on Market opportunity by Variant ($ million)

      7 Market Segmentation by End-user

      • 7.1 Market segments
        • Exhibit 44: Chart on End-user - Market share 2023-2028 (%)
        • Exhibit 45: Data Table on End-user - Market share 2023-2028 (%)
      • 7.2 Comparison by End-user
        • Exhibit 46: Chart on Comparison by End-user
        • Exhibit 47: Data Table on Comparison by End-user
      • 7.3 Pharmaceutical - Market size and forecast 2023-2028
        • Exhibit 48: Chart on Pharmaceutical - Market size and forecast 2023-2028 ($ million)
        • Exhibit 49: Data Table on Pharmaceutical - Market size and forecast 2023-2028 ($ million)
        • Exhibit 50: Chart on Pharmaceutical - Year-over-year growth 2023-2028 (%)
        • Exhibit 51: Data Table on Pharmaceutical - Year-over-year growth 2023-2028 (%)
      • 7.4 Food and beverages - Market size and forecast 2023-2028
        • Exhibit 52: Chart on Food and beverages - Market size and forecast 2023-2028 ($ million)
        • Exhibit 53: Data Table on Food and beverages - Market size and forecast 2023-2028 ($ million)
        • Exhibit 54: Chart on Food and beverages - Year-over-year growth 2023-2028 (%)
        • Exhibit 55: Data Table on Food and beverages - Year-over-year growth 2023-2028 (%)
      • 7.5 Personal care - Market size and forecast 2023-2028
        • Exhibit 56: Chart on Personal care - Market size and forecast 2023-2028 ($ million)
        • Exhibit 57: Data Table on Personal care - Market size and forecast 2023-2028 ($ million)
        • Exhibit 58: Chart on Personal care - Year-over-year growth 2023-2028 (%)
        • Exhibit 59: Data Table on Personal care - Year-over-year growth 2023-2028 (%)
      • 7.6 Others - Market size and forecast 2023-2028
        • Exhibit 60: Chart on Others - Market size and forecast 2023-2028 ($ million)
        • Exhibit 61: Data Table on Others - Market size and forecast 2023-2028 ($ million)
        • Exhibit 62: Chart on Others - Year-over-year growth 2023-2028 (%)
        • Exhibit 63: Data Table on Others - Year-over-year growth 2023-2028 (%)
      • 7.7 Market opportunity by End-user
        • Exhibit 64: Market opportunity by End-user ($ million)
        • Exhibit 65: Data Table on Market opportunity by End-user ($ million)

      8 Customer Landscape

      • 8.1 Customer landscape overview
        • Exhibit 66: Analysis of price sensitivity, lifecycle, customer purchase basket, adoption rates, and purchase criteria

      9 Geographic Landscape

      • 9.1 Geographic segmentation
        • Exhibit 67: Chart on Market share by geography 2023-2028 (%)
        • Exhibit 68: Data Table on Market share by geography 2023-2028 (%)
      • 9.2 Geographic comparison
        • Exhibit 69: Chart on Geographic comparison
        • Exhibit 70: Data Table on Geographic comparison
      • 9.3 Europe - Market size and forecast 2023-2028
        • Exhibit 71: Chart on Europe - Market size and forecast 2023-2028 ($ million)
        • Exhibit 72: Data Table on Europe - Market size and forecast 2023-2028 ($ million)
        • Exhibit 73: Chart on Europe - Year-over-year growth 2023-2028 (%)
        • Exhibit 74: Data Table on Europe - Year-over-year growth 2023-2028 (%)
      • 9.4 North America - Market size and forecast 2023-2028
        • Exhibit 75: Chart on North America - Market size and forecast 2023-2028 ($ million)
        • Exhibit 76: Data Table on North America - Market size and forecast 2023-2028 ($ million)
        • Exhibit 77: Chart on North America - Year-over-year growth 2023-2028 (%)
        • Exhibit 78: Data Table on North America - Year-over-year growth 2023-2028 (%)
      • 9.5 APAC - Market size and forecast 2023-2028
        • Exhibit 79: Chart on APAC - Market size and forecast 2023-2028 ($ million)
        • Exhibit 80: Data Table on APAC - Market size and forecast 2023-2028 ($ million)
        • Exhibit 81: Chart on APAC - Year-over-year growth 2023-2028 (%)
        • Exhibit 82: Data Table on APAC - Year-over-year growth 2023-2028 (%)
      • 9.6 South America - Market size and forecast 2023-2028
        • Exhibit 83: Chart on South America - Market size and forecast 2023-2028 ($ million)
        • Exhibit 84: Data Table on South America - Market size and forecast 2023-2028 ($ million)
        • Exhibit 85: Chart on South America - Year-over-year growth 2023-2028 (%)
        • Exhibit 86: Data Table on South America - Year-over-year growth 2023-2028 (%)
      • 9.7 Middle East and Africa - Market size and forecast 2023-2028
        • Exhibit 87: Chart on Middle East and Africa - Market size and forecast 2023-2028 ($ million)
        • Exhibit 88: Data Table on Middle East and Africa - Market size and forecast 2023-2028 ($ million)
        • Exhibit 89: Chart on Middle East and Africa - Year-over-year growth 2023-2028 (%)
        • Exhibit 90: Data Table on Middle East and Africa - Year-over-year growth 2023-2028 (%)
      • 9.8 US - Market size and forecast 2023-2028
        • Exhibit 91: Chart on US - Market size and forecast 2023-2028 ($ million)
        • Exhibit 92: Data Table on US - Market size and forecast 2023-2028 ($ million)
        • Exhibit 93: Chart on US - Year-over-year growth 2023-2028 (%)
        • Exhibit 94: Data Table on US - Year-over-year growth 2023-2028 (%)
      • 9.9 China - Market size and forecast 2023-2028
        • Exhibit 95: Chart on China - Market size and forecast 2023-2028 ($ million)
        • Exhibit 96: Data Table on China - Market size and forecast 2023-2028 ($ million)
        • Exhibit 97: Chart on China - Year-over-year growth 2023-2028 (%)
        • Exhibit 98: Data Table on China - Year-over-year growth 2023-2028 (%)
      • 9.10 Germany - Market size and forecast 2023-2028
        • Exhibit 99: Chart on Germany - Market size and forecast 2023-2028 ($ million)
        • Exhibit 100: Data Table on Germany - Market size and forecast 2023-2028 ($ million)
        • Exhibit 101: Chart on Germany - Year-over-year growth 2023-2028 (%)
        • Exhibit 102: Data Table on Germany - Year-over-year growth 2023-2028 (%)
      • 9.11 UK - Market size and forecast 2023-2028
        • Exhibit 103: Chart on UK - Market size and forecast 2023-2028 ($ million)
        • Exhibit 104: Data Table on UK - Market size and forecast 2023-2028 ($ million)
        • Exhibit 105: Chart on UK - Year-over-year growth 2023-2028 (%)
        • Exhibit 106: Data Table on UK - Year-over-year growth 2023-2028 (%)
      • 9.12 Japan - Market size and forecast 2023-2028
        • Exhibit 107: Chart on Japan - Market size and forecast 2023-2028 ($ million)
        • Exhibit 108: Data Table on Japan - Market size and forecast 2023-2028 ($ million)
        • Exhibit 109: Chart on Japan - Year-over-year growth 2023-2028 (%)
        • Exhibit 110: Data Table on Japan - Year-over-year growth 2023-2028 (%)
      • 9.13 Market opportunity by geography
        • Exhibit 111: Market opportunity by geography ($ million)
        • Exhibit 112: Data Tables on Market opportunity by geography ($ million)

      10 Drivers, Challenges, and Trends

      • 10.1 Market drivers
        • 10.2 Market challenges
          • 10.3 Impact of drivers and challenges
            • Exhibit 113: Impact of drivers and challenges in 2023 and 2028
          • 10.4 Market trends

            11 Vendor Landscape

            • 11.1 Overview
              • 11.2 Vendor landscape
                • Exhibit 114: Overview on Criticality of inputs and Factors of differentiation
              • 11.3 Landscape disruption
                • Exhibit 115: Overview on factors of disruption
              • 11.4 Industry risks
                • Exhibit 116: Impact of key risks on business

              12 Vendor Analysis

              • 12.1 Vendors covered
                • Exhibit 117: Vendors covered
              • 12.2 Market positioning of vendors
                • Exhibit 118: Matrix on vendor position and classification
              • 12.3 Avantor Inc
                • Exhibit 119: Avantor Inc - Overview
                • Exhibit 120: Avantor Inc - Business segments
                • Exhibit 121: Avantor Inc - Key news
                • Exhibit 122: Avantor Inc - Key offerings
                • Exhibit 123: Avantor Inc - Segment focus
              • 12.4 Central Drug House P Ltd.
                • Exhibit 124: Central Drug House P Ltd. - Overview
                • Exhibit 125: Central Drug House P Ltd. - Product / Service
                • Exhibit 126: Central Drug House P Ltd. - Key offerings
              • 12.5 Foodchem International Corp.
                • Exhibit 127: Foodchem International Corp. - Overview
                • Exhibit 128: Foodchem International Corp. - Product / Service
                • Exhibit 129: Foodchem International Corp. - Key offerings
              • 12.6 FUJIFILM Corp.
                • Exhibit 130: FUJIFILM Corp. - Overview
                • Exhibit 131: FUJIFILM Corp. - Business segments
                • Exhibit 132: FUJIFILM Corp. - Key news
                • Exhibit 133: FUJIFILM Corp. - Key offerings
                • Exhibit 134: FUJIFILM Corp. - Segment focus
              • 12.7 GFS Chemicals Inc.
                • Exhibit 135: GFS Chemicals Inc. - Overview
                • Exhibit 136: GFS Chemicals Inc. - Product / Service
                • Exhibit 137: GFS Chemicals Inc. - Key offerings
              • 12.8 Glanbia plc
                • Exhibit 138: Glanbia plc - Overview
                • Exhibit 139: Glanbia plc - Business segments
                • Exhibit 140: Glanbia plc - Key news
                • Exhibit 141: Glanbia plc - Key offerings
                • Exhibit 142: Glanbia plc - Segment focus
              • 12.9 Hydrite Chemical Co.
                • Exhibit 143: Hydrite Chemical Co. - Overview
                • Exhibit 144: Hydrite Chemical Co. - Product / Service
                • Exhibit 145: Hydrite Chemical Co. - Key offerings
              • 12.10 Illinois Tool Works Inc.
                • Exhibit 146: Illinois Tool Works Inc. - Overview
                • Exhibit 147: Illinois Tool Works Inc. - Business segments
                • Exhibit 148: Illinois Tool Works Inc. - Key news
                • Exhibit 149: Illinois Tool Works Inc. - Key offerings
                • Exhibit 150: Illinois Tool Works Inc. - Segment focus
              • 12.11 Koninklijke DSM NV
                • Exhibit 151: Koninklijke DSM NV - Overview
                • Exhibit 152: Koninklijke DSM NV - Business segments
                • Exhibit 153: Koninklijke DSM NV - Key news
                • Exhibit 154: Koninklijke DSM NV - Key offerings
                • Exhibit 155: Koninklijke DSM NV - Segment focus
              • 12.12 Merck KGaA
                • Exhibit 156: Merck KGaA - Overview
                • Exhibit 157: Merck KGaA - Business segments
                • Exhibit 158: Merck KGaA - Key news
                • Exhibit 159: Merck KGaA - Key offerings
                • Exhibit 160: Merck KGaA - Segment focus
              • 12.13 Muby Chemicals
                • Exhibit 161: Muby Chemicals - Overview
                • Exhibit 162: Muby Chemicals - Product / Service
                • Exhibit 163: Muby Chemicals - Key offerings
              • 12.14 Otto Chemie Pvt. Ltd.
                • Exhibit 164: Otto Chemie Pvt. Ltd. - Overview
                • Exhibit 165: Otto Chemie Pvt. Ltd. - Product / Service
                • Exhibit 166: Otto Chemie Pvt. Ltd. - Key offerings
              • 12.15 Spectrum Laboratory Products Inc.
                • Exhibit 167: Spectrum Laboratory Products Inc. - Overview
                • Exhibit 168: Spectrum Laboratory Products Inc. - Product / Service
                • Exhibit 169: Spectrum Laboratory Products Inc. - Key offerings
              • 12.16 Thermo Fisher Scientific Inc.
                • Exhibit 170: Thermo Fisher Scientific Inc. - Overview
                • Exhibit 171: Thermo Fisher Scientific Inc. - Business segments
                • Exhibit 172: Thermo Fisher Scientific Inc. - Key news
                • Exhibit 173: Thermo Fisher Scientific Inc. - Key offerings
                • Exhibit 174: Thermo Fisher Scientific Inc. - Segment focus
              • 12.17 Univar Solutions Inc.
                • Exhibit 175: Univar Solutions Inc. - Overview
                • Exhibit 176: Univar Solutions Inc. - Business segments
                • Exhibit 177: Univar Solutions Inc. - Key offerings
                • Exhibit 178: Univar Solutions Inc. - Segment focus

              13 Appendix

              • 13.1 Scope of the report
                • 13.2 Inclusions and exclusions checklist
                  • Exhibit 179: Inclusions checklist
                  • Exhibit 180: Exclusions checklist
                • 13.3 Currency conversion rates for US$
                  • Exhibit 181: Currency conversion rates for US$
                • 13.4 Research methodology
                  • Exhibit 182: Research methodology
                  • Exhibit 183: Validation techniques employed for market sizing
                  • Exhibit 184: Information sources
                • 13.5 List of abbreviations
                  • Exhibit 185: List of abbreviations

                Research Methodology

                Technavio presents a detailed picture of the market by way of study, synthesis, and summation of data from multiple sources. The analysts have presented the various facets of the market with a particular focus on identifying the key industry influencers. The data thus presented is comprehensive, reliable, and the result of extensive research, both primary and secondary.

                INFORMATION SOURCES

                Primary sources

                • Manufacturers and suppliers
                • Channel partners
                • Industry experts
                • Strategic decision makers

                Secondary sources

                • Industry journals and periodicals
                • Government data
                • Financial reports of key industry players
                • Historical data
                • Press releases

                DATA ANALYSIS

                Data Synthesis

                • Collation of data
                • Estimation of key figures
                • Analysis of derived insights

                Data Validation

                • Triangulation with data models
                • Reference against proprietary databases
                • Corroboration with industry experts

                REPORT WRITING

                Qualitative

                • Market drivers
                • Market challenges
                • Market trends
                • Five forces analysis

                Quantitative

                • Market size and forecast
                • Market segmentation
                • Geographical insights
                • Competitive landscape

                Interested in this report?

                Get your sample now to see our research methodology and insights!

                Download Now

                Frequently Asked Questions

                Ascorbic Acid market growth will increase by $ 379.16 mn during 2024-2028.

                The Ascorbic Acid market is expected to grow at a CAGR of 5.16% during 2024-2028.

                Ascorbic Acid market is segmented by Variant( Powder, Liquid) End-user( Pharmaceutical, Food and beverages, Personal care, Others)

                Anhui Elite Industrial Co. ltd., Ases Chemical Works, Avantor Inc, Blagden Specialty Chemicals Ltd., Central Drug House P Ltd., Foodchem International Corp., FUJIFILM Corp., GFS Chemicals Inc., Glanbia plc, Global Calcium Pvt. Ltd., Hydrite Chemical Co., Illinois Tool Works Inc., Koninklijke DSM NV, Luwei Pharmaceutical Group Co. Ltd., Medisca Inc., Merck KGaA, Muby Chemicals, Northeast Pharmaceutical Group Co. Ltd., Otto Chemie Pvt. Ltd., Reckon Organics Private Ltd., Spectrum Laboratory Products Inc., Thermo Fisher Scientific Inc., Univar Solutions Inc., PHARMAVIT ApS are a few of the key vendors in the Ascorbic Acid market.

                Europe will register the highest growth rate of 32% among the other regions. Therefore, the Ascorbic Acid market in Europe is expected to garner significant business opportunities for the vendors during the forecast period.

                US, China, Japan, Germany, UK

                • Increasing prevalence of vitamin C deficiencyThe increasing prevalence of vitamin C deficiency is a pivotal driver of the growth of the global ascorbic acid market. Despite the widespread availability of vitamin C-rich foods like citrus fruits and vegetables is the driving factor this market.
                • many populations worldwide suffer from inadequate intake is the driving factor this market.
                • either due to poor dietary habits is the driving factor this market.
                • limited access to fresh produce is the driving factor this market.
                • or specific health conditions. Vitamin C deficiency can lead to a range of health issues is the driving factor this market.
                • including compromised immune function is the driving factor this market.
                • impaired wound healing is the driving factor this market.
                • and increased susceptibility to infections. As awareness of the importance of vitamin C for overall health grows is the driving factor this market.
                • there is a rising demand for supplements and fortified foods containing ascorbic acid to address deficiencies and promote optimal health. Lifestyle factors such as smoking is the driving factor this market.
                • alcohol consumption is the driving factor this market.
                • and chronic stress can increase the bodys demand for vitamin C is the driving factor this market.
                • further exacerbating deficiency risk. Additionally is the driving factor this market.
                • certain medical conditions such as malabsorption disorders is the driving factor this market.
                • gastrointestinal diseases is the driving factor this market.
                • and renal disorders can impair vitamin C absorption and utilization is the driving factor this market.
                • necessitating supplementation to maintain adequate levels. According to the National Health Service (NHS) is the driving factor this market.
                • feeling very tired and weak all the time can be a sign of being at risk of scurvy is the driving factor this market.
                • which results from vitamin C deficiency. The rising number of scurvy cases will increase the demand for ascorbic acid is the driving factor this market.
                • which will drive the growth of the market. The convenience and accessibility of ascorbic acid supplements make them an attractive option for individuals seeking to boost their vitamin C intake and mitigate deficiency-related health risks. This is the driving factor this market.
                • in turn is the driving factor this market.
                • increases the demand for ascorbic acid among consumers. According to the National Institutes of Health (NIH) is the driving factor this market.
                • an estimated 25% of men and 16% of women in the low-income population of the UK are deficient in vitamin C. The elderly population is the driving factor this market.
                • people who consume alcohol excessively is the driving factor this market.
                • people with eating disorders is the driving factor this market.
                • and patients undergoing hemodialysis are at high risk of having vitamin C deficiency. The increasing prevalence of vitamin C deficiency will increase the demand for ascorbic acid and boost the growth of the global ascorbic acid market during the forecast period. is the driving factor this market.

                The Ascorbic Acid market vendors should focus on grabbing business opportunities from the Powder segment as it accounted for the largest market share in the base year.
                RIA - Research AI Assistant
                Ask RIA