
What is the Ballistic Protective Equipment Market Size?
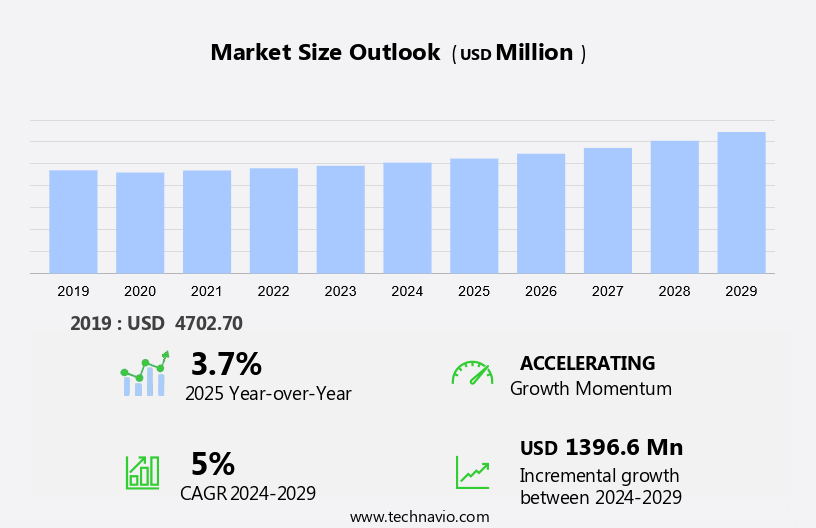
The ballistic protective equipment market size is forecast to increase by USD 1.39 billion, at a CAGR of 5% between 2024 and 2029. The market is experiencing significant growth due to several key factors. One of the primary drivers is the increased defense budgetary allocations in North America, which are leading to increased demand for advanced body armor and protective shields. Strategic partnerships between market players and defense organizations are also contributing to market growth, as they facilitate the development and deployment of innovative protective solutions. However, supply chain issues persist, as the production and distribution of ballistic protective equipment require specialized skills and resources. These challenges, coupled with the need for continuous innovation to meet evolving threat levels, make the market an intriguing and dynamic space to watch.
What will be the size of the Market during the forecast period?
Market Segmentation
The market research report provides comprehensive data (region-wise segment analysis), with forecasts and estimates in "USD billion" for the period 2025-2029, as well as historical data from 2019 - 2023 for the following segments.
- Material
- Aramid
- Composites
- UHMWPE
- Steel
- Ceramic
- Product Type
- Body armor
- Helmets
- Ballistic shields
- Others
- Geography
- North America
- Canada
- US
- Europe
- Germany
- UK
- France
- APAC
- China
- India
- South Korea
- Middle East and Africa
- South America
- North America
Which is the largest segment driving market growth?
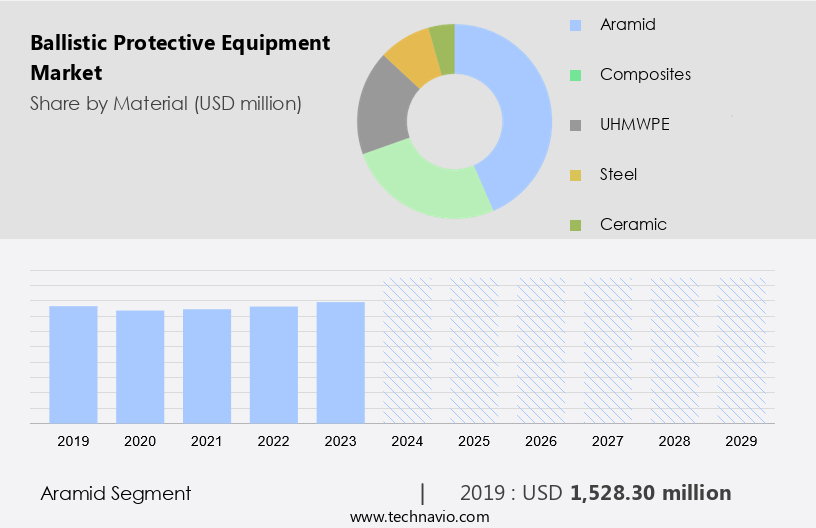
The aramid segment is estimated to witness significant growth during the forecast period. The market is driven by the increasing demand for gadgets and devices that offer ballistic resistance. This need is particularly prominent in the realm of transportation security, where ensuring safety from potential threats is paramount. Research and development efforts are focused on enhancing the ballistic protection capabilities of armor while maintaining a reasonable pace of growth. Aramid fibers, such as Kevlar, are a significant contributor to this market due to their exceptional strength-to-weight ratio and flexibility.
Get a glance at the market share of various regions. Download the PDF Sample
The aramid segment was valued at USD 1.53 billion in 2019. These fibers are capable of withstanding considerable stress without breaking, making them a preferred choice for ballistic protection applications. Their lightweight nature is also essential for maintaining mobility and comfort for the wearer. For instance, Kevlar vests are widely used by law enforcement and military personnel worldwide to protect against bullets from handguns and shrapnel from explosives. The European Norm (EN) sets the standard for ballistic resistance, ensuring customer needs are met while maintaining a competitive landscape.
Which region is leading the market?
For more insights on the market share of various regions, Request Free Sample
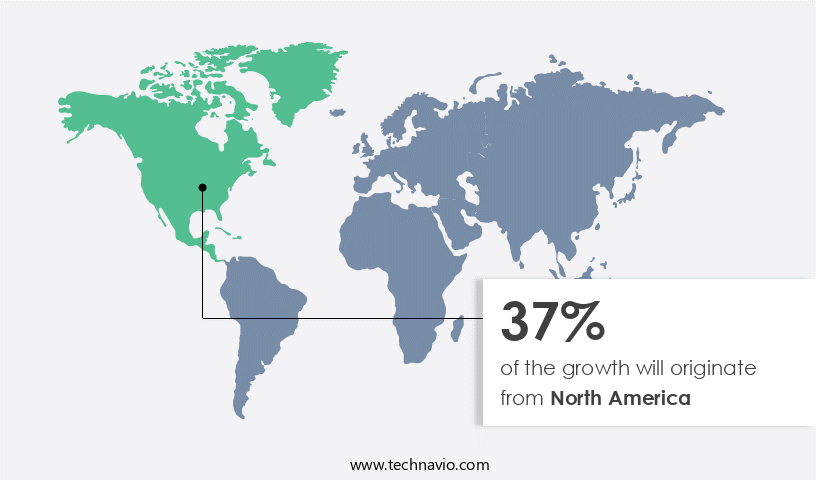
North America is estimated to contribute 37% to the growth of the global market during the forecast period. Technavio's analysts have elaborately explained the regional market trends and drivers that shape the market during the forecast period. The North American region holds a substantial position in the market due to substantial defense budgets and strategic investments in military capabilities. In 2024, Canada revealed a new defense sector vision, committing USD 8.1 billion over five years and USD 73 billion over 20 years to modernize and strengthen its military. This significant investment aims to provide advanced protective equipment and technologies. Airborne threats, including projectiles and programmable ammunition, are a major concern in irregular warfare and counterterrorism. To counteract these threats, ballistic protective equipment, such as body armors and vehicle protection systems, play a crucial role.
Ceramics, a primary material used in these protective solutions, offer high ballistic protection and are lightweight, making them ideal for military applications. The use of ceramics in ballistic protective equipment is expected to increase due to their superior protective capabilities and the growing demand for advanced protective solutions. In summary, the market is driven by substantial defense budgets and strategic investments in military capabilities. The increasing threat of airborne projectiles and programmable ammunition necessitates the use of advanced protective solutions, such as body armors and vehicle protection systems, made from materials like ceramics. These trends are expected to continue, driving the growth of the market in North America.
How do company ranking index and market positioning come to your aid?
Companies are implementing various strategies, such as strategic alliances, partnerships, mergers and acquisitions, geographical expansion, and product/service launches, to enhance their presence in the market.
ArmorSource LLC - This company offers ballistic protective equipment that are lightweight, comfortable helmets with superior ballistic protection and various accessories for customization.
Technavio provides the ranking index for the top 20 companies along with insights on the market positioning of:
- 3M Co.
- Avon Polymer Products Ltd.
- BAE Systems Plc
- BSST India Pvt Ltd.
- DuPont de Nemours Inc.
- ELMON SA
- EnGarde body armor
- Hardshell Ltd.
- Honeywell International Inc.
- Indian Armour Systems Pvt. Ltd.
- Mehler Systems
- MKU Ltd.
- Morgan Advanced Materials plc
- Point Blank Enterprises Inc.
- Revision Inc.
- Rheinmetall AG
- Safariland LLC
- Seyntex NV
- TenCate Protective Fabrics
Explore our company rankings and market positioning. Request Free Sample
How can Technavio assist you in making critical decisions?
What is the market structure and year-over-year growth of the Market?
|
Market structure |
Fragmented |
|
YoY growth 2024-2025 |
3.7 |
Market Dynamics
The market has witnessed significant growth in recent years, driven by the increasing demand for advanced body armor solutions from various sectors. This market caters to the needs of law enforcement agencies, military personnel, and civilian consumers who require protection against ballistic threats. Ballistic protective equipment refers to the armor and shields designed to withstand the impact of bullets, shrapnel, and other ballistic threats. The market is characterized by continuous innovation, with manufacturers focusing on developing lightweight, comfortable, and personalized solutions using advanced armor materials. Comfortable body armor is a crucial aspect of the market, as prolonged use can lead to fatigue and decreased performance. Manufacturers are addressing this challenge by incorporating composite materials and ergonomic designs to ensure optimal comfort and durability. Body armor regulations play a significant role in shaping the market. These regulations dictate the minimum ballistic resistance requirements for various applications, driving the need for next-generation armor solutions. Ballistic testing is a critical process to ensure that these solutions meet the required standards. Bulletproof vest technology has evolved significantly, with advancements in armor design and research leading to lighter, more effective solutions.
Lightweight armor solutions are increasingly popular due to their ease of use and improved mobility. Armor plating and ballistic panels are essential components of these solutions, offering superior ballistic resistance while maintaining a low weight. Ballistic shields are another crucial component of the market, providing protection against various ballistic threats, including missiles. These shields are designed to offer maximum protection while ensuring mobility and ease of use for the operator. The market for ballistic protective equipment is highly competitive, with numerous tactical gear suppliers offering customized solutions. Personalized solutions are increasingly popular due to their ability to cater to specific threat assessments and user requirements. Military technology and innovation continue to drive the market, with military equipment suppliers investing heavily in research and development. Our researchers analyzed the data with 2024 as the base year, along with the key drivers, trends, and challenges. A holistic analysis of drivers will help companies refine their marketing strategies to gain a competitive advantage.
What are the primary factors driving the market growth?
Increased defense budgetary allocations is notably driving market development. The market is experiencing significant growth due to increasing defense spending in various countries. In the US, the Defense Department's proposed budget for fiscal year 2024 is USD 849.8 billion, reflecting a substantial investment in defense operations. This budget allocation underscores the government's commitment to enhancing defense capabilities and driving demand for advanced ballistic protective equipment. Similar trends are observed in other regions, such as India, where the defense budget for fiscal years 2024 and 2025 is set at USD 74 billion. Technological innovation plays a crucial role in the market's pace of growth. Comfort and usability are key considerations in the development of modern ballistic protective equipment. Lightweight designs using high-performance fibers, such as aramid and ceramics, are gaining popularity.
These materials offer superior ballistic resistance while maintaining breathability and flexibility, making them ideal for military and law enforcement applications. Certifications and material weight are critical factors influencing the market. Ballistic protection materials must meet specific standards, such as the European Norm, to ensure they provide adequate protection against bullets, fragmentation, and other projectiles. Additionally, the trend towards lighter weight protective wear is driving research and development efforts in the industry. The defense sector's modernization and the integration of electronics into ballistic protective equipment are also key trends. This includes the development of programmable ammunition, which can be customized to specific threats, and ballistic protection materials with non-conductivity and piercing ballistic impact resistance. Thus, such factors are driving the growth of the market during the forecast period.
What are the significant trends being witnessed in the market?
Strategic partnerships are an emerging trend shaping market growth. The market is experiencing a notable trend of technological innovation and strategic partnerships to meet the growing demand for advanced, high-performance solutions. The partnership focuses on conducting feasibility studies and testing Defense Atomics' hardware, which integrates advanced graphene solutions. Compliance with stringent security protocols for classified government contracts is a priority. This alliance is one of several initiatives aimed at enhancing ballistic resistance, durability, and usability in body armor, helmet, and vehicle protection equipment.
Additionally, research and development in high-performance fibers, such as aramid and ceramics, continues to drive market growth. The defense sector, retail security, transportation security, and law enforcement are key end-users, with defense spending and counterterrorism being significant drivers. The European Norm, certifications, and customer needs continue to shape the market landscape, with lightweight designs, non-conductivity, and piercing ballistic impact being key considerations. Competition remains fierce, with inorganic growth strategies and modernization of weapon systems influencing market dynamics. Thus, such trends will shape the growth of the market during the forecast period.
What are the major market challenges?
Supply chain issues are a significant challenge hindering the market growth. The market is experiencing notable challenges in supplying and deploying innovative protective gear promptly. Other sectors, such as retail security and transportation security, also require advanced ballistic protective equipment to safeguard against various threats. In response, there is a growing emphasis on research and development, certifications, and lightweight designs to meet customer needs. The defense sector, including military and law enforcement, is a significant market for ballistic protective equipment. Usability, durability, and ballistic resistance are crucial factors in the selection of protective wear, such as body armor, helmets, and vehicle protection equipment. Modernization of weapon systems, including projectiles, fragmentation, and piercing ballistic impact, necessitates the development of high-performance materials, such as ceramics, aramid fiber, and rigid polymer chains. The European Norm and other certifications ensure the quality and safety of ballistic protection materials. Lightweight and breathable armor wear is gaining popularity due to its increased comfort and usability. Inorganic growth strategies, such as mergers and acquisitions, are common in the competitive market. The pace of growth in the market is driven by the increasing demand for protection against various threats, including bullets, weapons, and explosives.
Also, the market is influenced by defense spending, irregular warfare, and counterterrorism. The use of programmable ammunition and non-conductivity in ballistic protection materials is a significant trend. The market is diverse, encompassing body armors, bulletproof vests, helmets, and vehicle protection equipment. The market caters to various industries, including defense systems, electronics, and marine ships. The development of lightweight, modern designs and materials is a key focus area to meet the evolving needs of customers. In conclusion, the market is experiencing significant growth due to the increasing demand for protection against various threats. The market is driven by factors such as defense spending, technological innovation, and customer needs. The challenges in the defense supply chain and the importance of timely deployment of protective gear highlight the need for continued research and development in the field. Hence, the above factors will impede the growth of the market during the forecast period.
Exclusive Customer Landscape
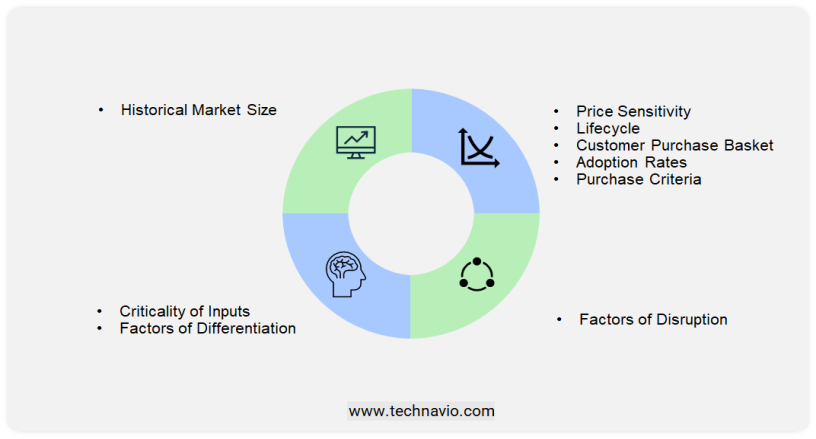
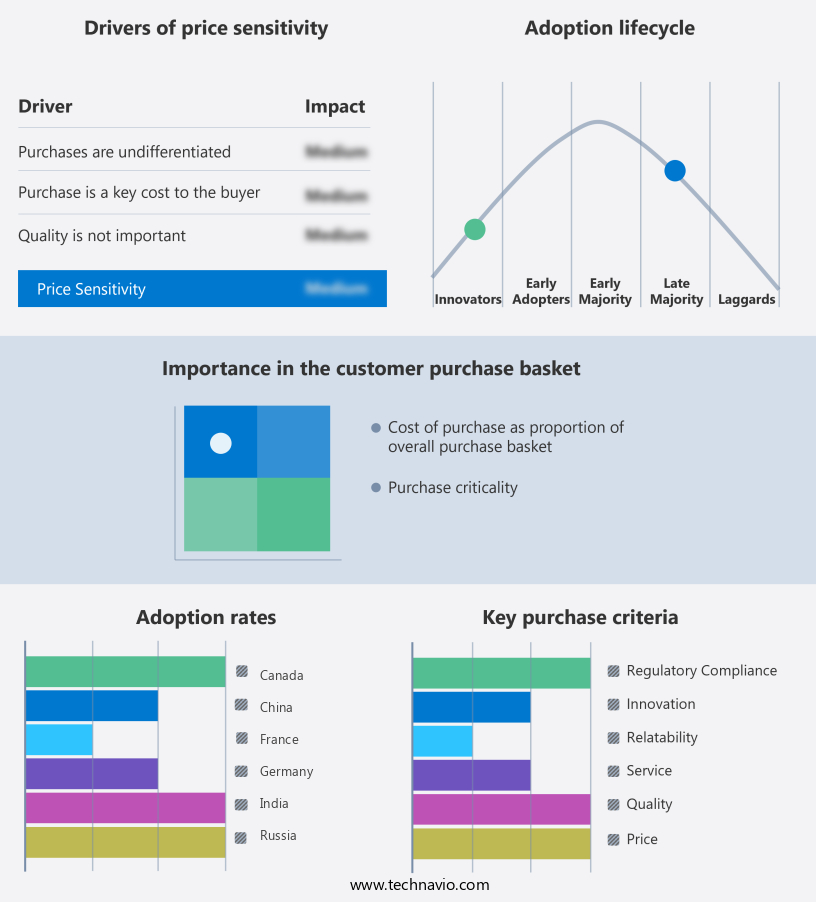
The market forecasting report includes the adoption lifecycle of the market research and growth, covering from the innovator's stage to the laggard's stage. It focuses on adoption rates in different regions based on penetration. Furthermore, the report also includes key purchase criteria and drivers of price sensitivity to help companies evaluate and develop their market growth analysis strategies.
Customer Landscape
Market Analyst Overview
The market is witnessing significant growth, driven by the increasing demand for body armor and vehicle protection equipment in various sectors. Comfort, technological innovation, and defense spending are the key market dynamics shaping the landscape. Comfort is a critical factor in the adoption of ballistic protective equipment. With the advancement in materials and designs, manufacturers are focusing on creating lightweight and breathable armor wear. High-performance fibers, such as aramid and ceramics, are being used to create protective wear that offers both ballistic protection and comfort. These materials provide excellent ballistic resistance while maintaining flexibility and allowing for better airflow, making them ideal for extended wear. Technological innovation is another significant driver of the market. Research and development activities are focused on developing lightweight, modern designs that offer superior ballistic protection. For instance, the use of electronics and gadgets, such as sensors and communication devices, is increasing in protective equipment to enhance usability and situational awareness.
Additionally, programmable ammunition and piercing ballistic impact materials are being researched to provide better protection against irregular warfare and national conflicts. Moreover, the need for ballistic protection in transportation security, counterterrorism, and marine ships is increasing, further driving the market growth. Certifications and material weight are essential considerations in the market. The European Norm (EN) and other certifications ensure that the equipment meets specific safety standards. Additionally, the weight of the protective equipment is a critical factor in its adoption, especially for military personnel and law enforcement agencies. Lightweight designs are preferred as they allow for easier mobility and longer wear times. The competition in the market is intense, with several players employing inorganic growth strategies, such as mergers and acquisitions, to expand their offerings and increase market share. However, the pace of growth in the market is expected to remain strong, driven by the increasing demand for ballistic protection in various sectors.
|
Market Scope |
|
|
Report Coverage |
Details |
|
Page number |
214 |
|
Base year |
2024 |
|
Historic period |
2019 - 2023 |
|
Forecast period |
2025-2029 |
|
Growth momentum & CAGR |
Accelerate at a CAGR of 5% |
|
Market growth 2025-2029 |
USD 1.39 billion |
|
Regional analysis |
North America, Europe, APAC, Middle East and Africa, and South America |
|
Performing market contribution |
North America at 37% |
|
Key countries |
US, China, Russia, India, UK, South Korea, Canada, France, Germany, and Saudi Arabia |
|
Competitive landscape |
Leading Companies, Market Positioning of Companies, Competitive Strategies, and Industry Risks |
|
Key companies profiled |
3M Co., ArmorSource LLC, Avon Polymer Products Ltd., BAE Systems Plc, BSST India Pvt Ltd., DuPont de Nemours Inc., ELMON SA, EnGarde body armor, Hardshell Ltd., Honeywell International Inc., Indian Armour Systems Pvt. Ltd., Mehler Systems, MKU Ltd., Morgan Advanced Materials plc, Point Blank Enterprises Inc., Revision Inc., Rheinmetall AG, Safariland LLC, Seyntex NV, and TenCate Protective Fabrics |
|
Market Segmentation |
Material (Aramid, Composites, UHMWPE, Steel, and Ceramic), Product Type (Body armor, Helmets, Ballistic shields, and Others), and Geography (North America, Europe, APAC, Middle East and Africa, and South America) |
|
Customization purview |
If our market report has not included the data that you are looking for, you can reach out to our analysts and get segments customized. |
What are the Key Data Covered in this Market Research Report?
- CAGR of the market during the market forecast period
- Detailed information on factors that will drive the market growth and forecasting between 2025 and 2029
- Precise estimation of the size of the market and its contribution of the market in focus to the parent market
- Accurate predictions about upcoming market growth and trends and changes in consumer behavior
- Growth of the market across North America, Europe, APAC, Middle East and Africa, and South America
- Thorough analysis of the market's competitive landscape and detailed information about companies
- Comprehensive analysis of factors that will challenge the growth of market companies
 RIA -
RIA - 
