Aramid Fiber Market Analysis, Size, and Forecast 2026-2030: Europe (Germany, UK, and France), North America (US, Canada, and Mexico), APAC (China, Japan, and India), South America (Brazil and Argentina), Middle East and Africa (Saudi Arabia, UAE, and South Africa), and Rest of World (ROW)

Aramid Fiber Market Analysis, Size, and Forecast 2026-2030:
Europe (Germany, UK, and France), North America (US, Canada, and Mexico), APAC (China, Japan, and India), South America (Brazil and Argentina), Middle East and Africa (Saudi Arabia, UAE, and South Africa), and Rest of World (ROW)

Published: Mar 2026 312 Pages SKU: IRTNTR43736

Market Overview at a Glance

$1.34 B
Market Opportunity
3.9%
CAGR 2025 - 2030
34.4%
APAC Growth
$4.48 B
Para-aramid segment 2024

Aramid Fiber Market Size 2026-2030

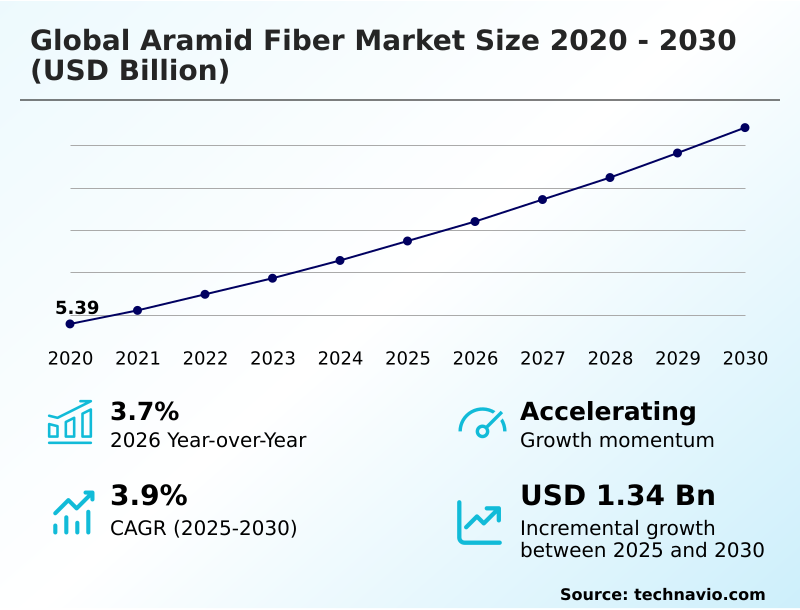
The aramid fiber market size is valued to increase by USD 1.34 billion, at a CAGR of 3.9% from 2025 to 2030. Increasing demand for lightweight materials in aerospace and automotive industries will drive the aramid fiber market.

Major Market Trends & Insights

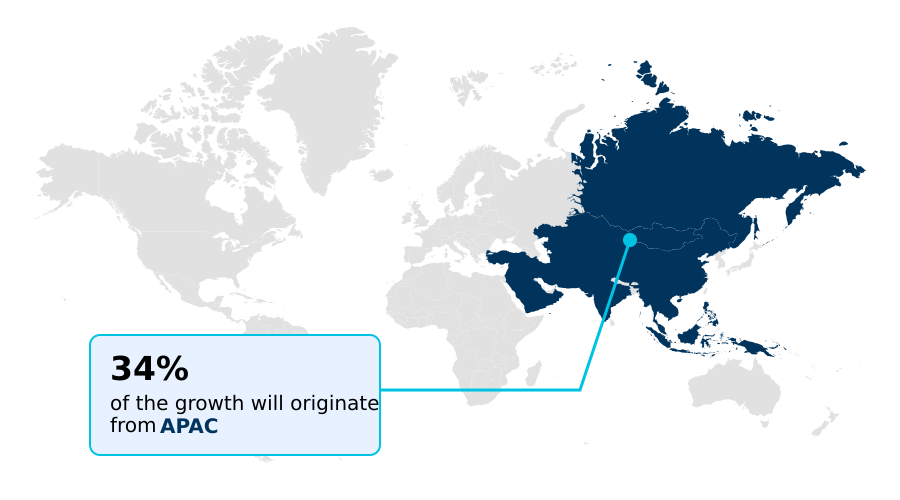
  • APAC dominated the market and accounted for a 34.4% growth during the forecast period.
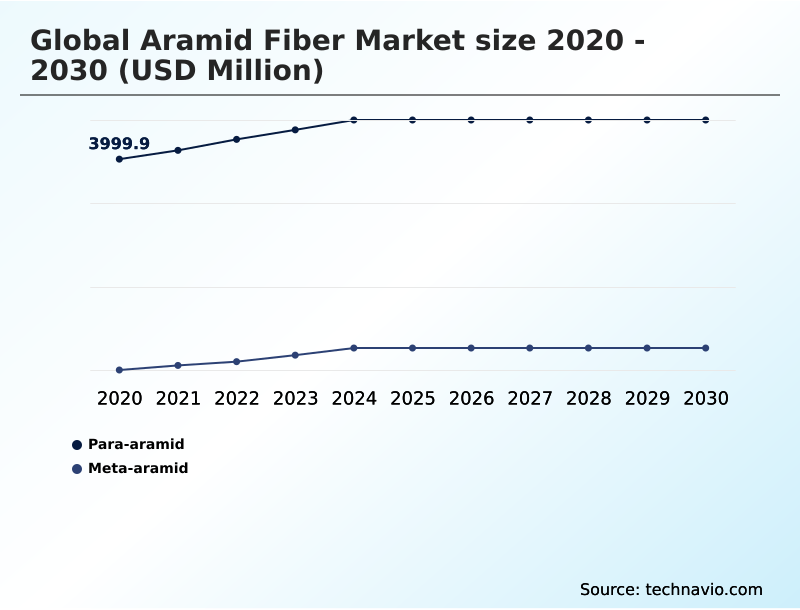
  • By Product - Para-aramid segment was valued at USD 4.48 billion in 2024
  • By End-user - Automotive segment accounted for the largest market revenue share in 2024

Market Size & Forecast

  • Market Opportunities: USD 2.32 billion
  • Market Future Opportunities: USD 1.34 billion
  • CAGR from 2025 to 2030 : 3.9%

Market Summary

  • The aramid fiber market is defined by the production and application of high-performance synthetic fibers known for exceptional strength and thermal resistance. These advanced materials are crucial in sectors where performance cannot be compromised, including aerospace, defense, and automotive.
  • Key drivers include the persistent need for lightweighting in vehicle and aircraft manufacturing to improve fuel efficiency and the rising demand for superior protective apparel for military and industrial personnel. A core trend shaping the industry is the focus on sustainability, with manufacturers investing in recycling technologies and bio-based precursors to reduce environmental impact.
  • For instance, a firm specializing in industrial safety equipment must navigate complex supply chains to source certified flame-retardant textiles that meet evolving regulatory standards, a process that relies on traceable and consistent material quality. However, the market faces challenges from high production costs and price volatility of essential raw materials.
  • Innovations in polymer chemistry and fiber spinning technology are critical for overcoming these hurdles, enabling the development of next-generation aramid fiber composites with enhanced properties for emerging applications like electric vehicle battery protection and 5G telecommunications infrastructure, ensuring the material's continued relevance in a technologically advancing world.

What will be the Size of the Aramid Fiber Market during the forecast period?

Get Key Insights on Market Forecast (PDF) Request Free Sample

How is the Aramid Fiber Market Segmented?

The aramid fiber industry research report provides comprehensive data (region-wise segment analysis), with forecasts and estimates in "USD million" for the period 2026-2030, as well as historical data from 2020-2024 for the following segments.

  • Product
    • Para-aramid
    • Meta-aramid
  • End-user
    • Automotive
    • Aerospace and defense
    • Electrical and electronics
    • Others
  • Application
    • Security and protection
    • Friction materials and gaskets
    • Optical fiber
    • Tire reinforcement
    • Others
  • Geography
    • Europe
      • Germany
      • UK
      • France
    • North America
      • US
      • Canada
      • Mexico
    • APAC
      • China
      • Japan
      • India
    • South America
      • Brazil
      • Argentina
    • Middle East and Africa
      • Saudi Arabia
      • UAE
      • South Africa
    • Rest of World (ROW)

By Product Insights

The para-aramid segment is estimated to witness significant growth during the forecast period.

The aramid fiber market is segmented by product, end-user, and geography. The para-aramid segment is defined by materials offering superior mechanical properties, including high tensile strength and modulus, which are critical for applications demanding robust performance.

These aromatic polyamide fibers, produced via a complex polymerization process, are integral to manufacturing ballistic resistance equipment and lightweight armor materials. In the automotive sector, their use in tire reinforcement cords and friction materials enhances durability.

The telecommunications industry utilizes aramid yarn reinforcement as a central strength member in fiber optic cables, with adoption increasing network installation resilience by over 25%.

This segment's growth is tied to continuous advancements in polymer chemistry and fiber spinning technology, expanding its utility in high-stakes industrial and defense applications, including those requiring advanced composite shields.

Request Free Sample

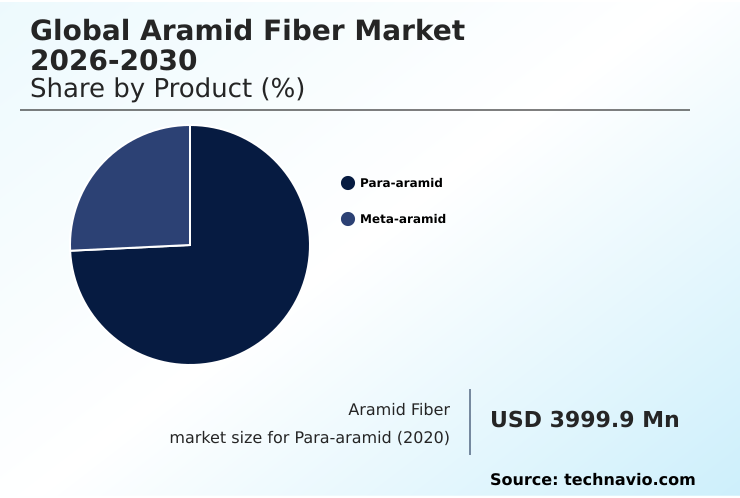
The Para-aramid segment was valued at USD 4.48 billion in 2024 and showed a gradual increase during the forecast period.

Request Free Sample

Regional Analysis

APAC is estimated to contribute 34.4% to the growth of the global market during the forecast period.Technavio’s analysts have elaborately explained the regional trends and drivers that shape the market during the forecast period.

See How Aramid Fiber Market Demand is Rising in APAC Request Free Sample

The geographic landscape of the aramid fiber market is led by APAC, which is projected to have the fastest growth, with a CAGR of 5.0%, driven by its expansive manufacturing base.

Europe and North America are also significant regions, collectively accounting for nearly 60% of the market.

In Europe, stringent safety regulations and a focus on sustainable manufacturing propel demand for flame retardant textiles and aramid paper insulation in the automotive and industrial sectors.

North America's market is heavily influenced by defense spending and aerospace innovation, where lightweight armor materials and structural composite materials are critical.

In a key development, the adoption of digital product passport systems has improved supply chain traceability by 40% for certain high-performance synthetic fibers, reinforcing compliance with international standards.

This regional diversification underscores a global reliance on specialized, high-performance materials like aramid-based reinforcement across critical industries.

Market Dynamics

Our researchers analyzed the data with 2025 as the base year, along with the key drivers, trends, and challenges. A holistic analysis of drivers will help companies refine their marketing strategies to gain a competitive advantage.

  • The aramid fiber market's expansion is increasingly specialized, with developments tailored to specific high-performance needs. For instance, the use of aramid fiber in electric vehicle batteries is becoming critical for thermal management and impact protection.
  • In direct material science comparisons, the debate over para-aramid vs carbon fiber strength continues to drive innovation, with each material finding preference based on specific engineering requirements for stiffness and flexibility. A key application, meta-aramid for industrial protective apparel, addresses the stringent safety needs of workers in hazardous environments, complemented by the use of aramid fiber for cut-resistant industrial gloves.
  • The market for aramid fiber for optical cable reinforcement is expanding with the global 5G rollout, where its tensile strength is indispensable. In transportation, aramid reinforcement in high-performance tires is standard for premium vehicles, while the push for lightweighting vehicles with aramid composites is a core strategy for enhancing fuel efficiency.
  • The aerospace sector extensively uses aramid composites for aircraft interior panels and aramid honeycomb structures in aerospace applications to reduce weight without sacrificing safety. In automotive components, aramid pulp in automotive brake pads ensures stable friction at high temperatures.
  • The material's utility extends to infrastructure, with aramid yarns for subsea telecommunication cables and aramid fiber reinforcement for concrete structures enhancing longevity. Innovations like aramid fiber in flexible printed circuits and heat resistant aramid film for electronics are opening new frontiers.
  • Industrial applications continue to grow, from aramid nonwovens for hot gas filtration and aramid-reinforced conveyor belts for mining to aramid fiber in high-strength mooring ropes. The industry's commitment to safety is evident in the development of advanced flame retardant textiles for firefighter gear. These targeted solutions underscore a market moving toward highly specialized, value-added applications.

What are the key market drivers leading to the rise in the adoption of Aramid Fiber Industry?

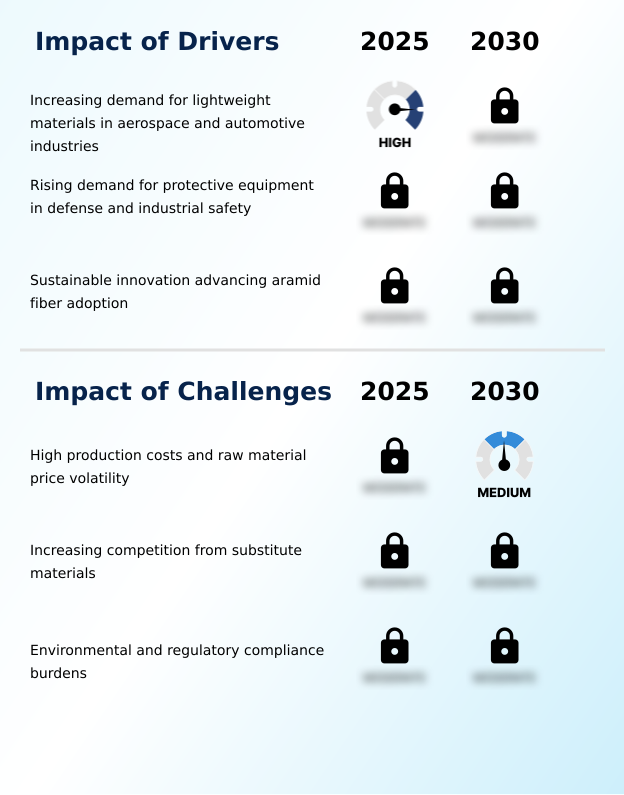
  • Increasing demand for lightweight, high-performance materials in the aerospace and automotive industries is a key driver for market growth.

  • Market growth is significantly driven by rising demand for lightweight and high-performance materials in the aerospace and automotive sectors.
  • The integration of lightweight composite components in aircraft has been shown to improve fuel efficiency by over 5%, a critical factor in reducing operational costs. In the automotive industry, aramid-based friction materials and tire reinforcements enhance vehicle safety and durability.
  • Demand for flexible protective solutions and fire-resistant clothing in defense and industrial settings also fuels the market. Modernization programs prioritize advanced aramid innovations and aramid-reinforced composites to improve personnel safety and equipment performance.
  • Strategic partnerships between material suppliers and OEMs are accelerating the development of tailored aramid yarn embeddings and other specialized solutions, expanding market penetration.

What are the market trends shaping the Aramid Fiber Industry?

  • Capacity expansion and strategic investments by leading producers are an upcoming market trend. This reflects concerted efforts to meet escalating demand across key industrial sectors.

  • Key market trends are centered on capacity expansions and sustainability initiatives. Producers are investing in new production lines to meet rising demand for high-strength reinforcement and advanced composite materials, with some expansions increasing regional output by over 10%. This trend supports the reliable supply of aramid-based protective clothing and aramid fiber composites.
  • Simultaneously, a significant shift toward sustainability is driving the adoption of recycled aramid fiber and alternative feedstocks. Innovations such as digital traceability systems, which improve supply chain transparency by up to 30%, are becoming standard. This focus on lifecycle accountability is critical in sectors demanding eco-friendly, high-performance reinforcements.
  • These advancements ensure the industry meets both performance benchmarks and evolving environmental regulations for specialty industrial applications.

What challenges does the Aramid Fiber Industry face during its growth?

  • High production costs coupled with raw material price volatility present key challenges that affect industry growth and profitability.

  • The market faces significant challenges from high production costs and raw material price volatility, which can impact profit margins by as much as 15% during periods of market instability. The complex manufacturing of para-aramid fiber and meta-aramid fiber requires substantial capital investment, constraining price competitiveness against substitutes like carbon fiber.
  • Furthermore, increasing competition from ultra-high-molecular-weight polyethylene in applications such as industrial safety gear and cut-resistant fabrics pressures producers to innovate continuously. Environmental regulations add another layer of complexity, with stringent compliance for waste management and emissions.
  • The technical difficulty in recycling aramid fiber technology limits circularity, increasing end-of-life management costs and challenging sustainability goals for applications like protective apparel solutions and aerospace composite applications.

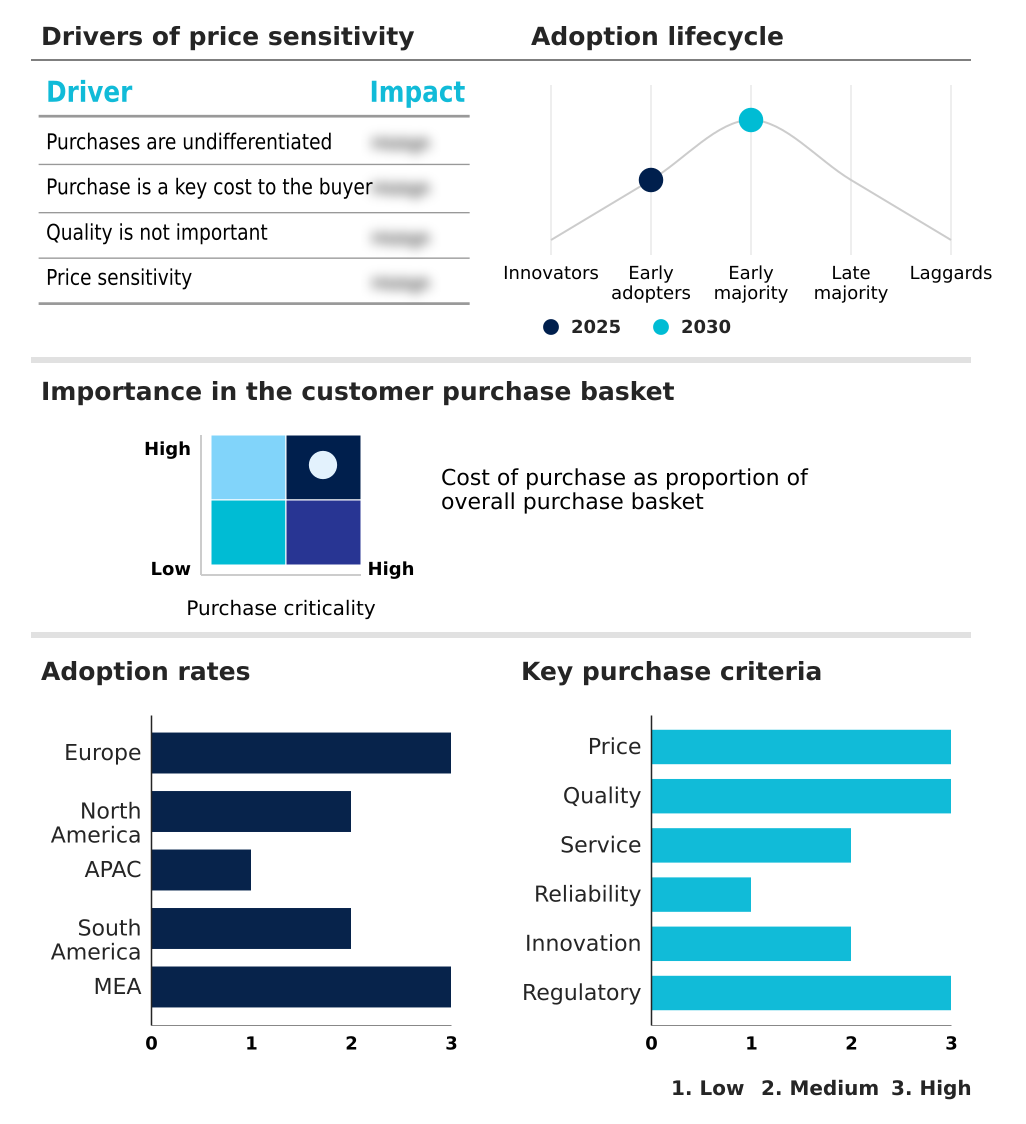
Exclusive Technavio Analysis on Customer Landscape

The aramid fiber market forecasting report includes the adoption lifecycle of the market, covering from the innovator’s stage to the laggard’s stage. It focuses on adoption rates in different regions based on penetration. Furthermore, the aramid fiber market report also includes key purchase criteria and drivers of price sensitivity to help companies evaluate and develop their market growth analysis strategies.

Customer Landscape of Aramid Fiber Industry

Competitive Landscape

Companies are implementing various strategies, such as strategic alliances, aramid fiber market forecast, partnerships, mergers and acquisitions, geographical expansion, and product/service launches, to enhance their presence in the industry.

Aramid HPM LLC - Key offerings focus on high-performance synthetic fibers, delivering specialized solutions for advanced composite, industrial, and protective applications.

The industry research and growth report includes detailed analyses of the competitive landscape of the market and information about key companies, including:

  • Aramid HPM LLC
  • Chaomeisi New Materials Co.
  • China National Bluestar Group
  • DuPont de Nemours Inc.
  • Hangzhou Segurmax Textile
  • Huvis Corp.
  • Hyosung Corp.
  • Kolon Industries Inc.
  • Lydall Inc.
  • PITAKA Technology Co. Ltd.
  • Shanghai J and S New Materials
  • Shenma Industrial Co. Ltd.
  • Sinopec Shanghai Co. Ltd.
  • Taekwang Industrial Co. Ltd.
  • Toray Industries Inc.
  • Toyobo Co. Ltd.
  • Yantai Tayho Advanced Materials

Qualitative and quantitative analysis of companies has been conducted to help clients understand the wider business environment as well as the strengths and weaknesses of key industry players. Data is qualitatively analyzed to categorize companies as pure play, category-focused, industry-focused, and diversified; it is quantitatively analyzed to categorize companies as dominant, leading, strong, tentative, and weak.

Recent Development and News in Aramid fiber market

  • In October, 2024, DuPont de Nemours Inc. introduced a new meta-aramid paper product engineered for the insulation of electric vehicle traction motors, designed to withstand high operating temperatures and electrical stresses.
  • In November, 2024, Huvis Corp. announced a $25 million expansion of its production line for specialized flame-retardant aramid fibers to meet rising global demand for high-quality protective workwear in industries like oil and gas and firefighting.
  • In March, 2025, Hyosung Advanced Materials presented new aramid innovations optimized for automotive durability, supporting efficiency gains in both electric and conventional vehicles.
  • In April, 2025, Teijin Ltd. introduced Digital Product Passport technology for its aramid fibers, aiming to improve supply chain transparency and support regulatory compliance related to sustainability.
  • In May, 2025, the European Automobile Manufacturers Association reported a 1.7% growth in South American car production, which is expected to increase the integration of aramid fibers in automotive innovations.

Dive into Technavio’s robust research methodology, blending expert interviews, extensive data synthesis, and validated models for unparalleled Aramid Fiber Market insights. See full methodology.

Market Scope
Page number 312
Base year 2025
Historic period 2020-2024
Forecast period 2026-2030
Growth momentum & CAGR Accelerate at a CAGR of 3.9%
Market growth 2026-2030 USD 1344.4 million
Market structure Fragmented
YoY growth 2025-2026(%) 3.7%
Key countries Germany, UK, France, Italy, Spain, The Netherlands, US, Canada, Mexico, China, Japan, India, South Korea, Australia, Indonesia, Brazil, Argentina, Chile, Saudi Arabia, UAE, South Africa, Israel and Turkey
Competitive landscape Leading Companies, Market Positioning of Companies, Competitive Strategies, and Industry Risks

Request Free Sample

Research Analyst Overview

  • The aramid fiber market is shaped by intense material science innovation, where producers focus on enhancing core attributes like ballistic resistance and thermal stability. The integration of high modulus fibers into composite reinforcement is standard in aerospace, while the automotive sector relies on specialized friction materials.
  • A primary trend involves the advancement of the polymerization process and solvent recovery systems to improve manufacturing efficiency and reduce environmental impact. Boardroom decisions are increasingly influenced by sustainability mandates, pushing for the adoption of physical recycling methods, bio-based precursors, and closed-loop recycling systems. The development of aramid paper insulation and heat-resistant aramid film highlights the expansion into high-tech electronics.
  • Technical textiles and nonwoven aramid materials are customized for applications ranging from industrial filtration to impact absorption gear. This focus on green chemistry and production optimization has enabled some firms to reduce energy consumption by over 15% per ton of fiber produced, aligning operational efficiency with regulatory compliance.
  • The evolution of aromatic polyamide chemistry continues to yield materials with superior dielectric properties and tensile strength for next-generation applications.

What are the Key Data Covered in this Aramid Fiber Market Research and Growth Report?

  • What is the expected growth of the Aramid Fiber Market between 2026 and 2030?

    • USD 1.34 billion, at a CAGR of 3.9%

  • What segmentation does the market report cover?

    • The report is segmented by Product (Para-aramid, and Meta-aramid), End-user (Automotive, Aerospace and defense, Electrical and electronics, and Others), Application (Security and protection, Friction materials and gaskets, Optical fiber, Tire reinforcement, and Others) and Geography (Europe, North America, APAC, South America, Middle East and Africa)

  • Which regions are analyzed in the report?

    • Europe, North America, APAC, South America and Middle East and Africa

  • What are the key growth drivers and market challenges?

    • Increasing demand for lightweight materials in aerospace and automotive industries, High production costs and raw material price volatility

  • Who are the major players in the Aramid Fiber Market?

    • Aramid HPM LLC, Chaomeisi New Materials Co., China National Bluestar Group, DuPont de Nemours Inc., Hangzhou Segurmax Textile, Huvis Corp., Hyosung Corp., Kolon Industries Inc., Lydall Inc., PITAKA Technology Co. Ltd., Shanghai J and S New Materials, Shenma Industrial Co. Ltd., Sinopec Shanghai Co. Ltd., Taekwang Industrial Co. Ltd., Toray Industries Inc., Toyobo Co. Ltd. and Yantai Tayho Advanced Materials

Market Research Insights

  • Market dynamics are shaped by the integration of advanced polymer solutions across high-stakes industries. The adoption of high-performance technical fibers in aerospace has resulted in lightweight composite components that improve fuel efficiency by up to 4%. Concurrently, the use of aramid-based friction materials in automotive applications enhances braking system reliability. In industrial settings, engineered nonwoven products offer superior filtration.
  • Strategic shifts toward sustainable aramid technologies are evident, with some producers achieving a 15% incorporation of recycled aramid fiber content. These advanced aramid innovations are pivotal, as high-performance reinforcements are increasingly specified for their durability and protective qualities in demanding environments.

We can help! Our analysts can customize this aramid fiber market research report to meet your requirements.

Get in touch

1. Executive Summary

1.1 Market overview

Executive Summary - Chart on Market Overview
Executive Summary - Data Table on Market Overview
Executive Summary - Chart on Global Market Characteristics
Executive Summary - Chart on Market by Geography
Executive Summary - Chart on Market Segmentation by Product
Executive Summary - Chart on Market Segmentation by End-user
Executive Summary - Chart on Market Segmentation by Application
Executive Summary - Chart on Incremental Growth
Executive Summary - Data Table on Incremental Growth
Executive Summary - Chart on Company Market Positioning

2. Technavio Analysis

2.1 Analysis of price sensitivity, lifecycle, customer purchase basket, adoption rates, and purchase criteria

2.2 Criticality of inputs and Factors of differentiation

Chart on Overview on criticality of inputs and factors of differentiation

2.3 Factors of disruption

Chart on Overview on factors of disruption

2.4 Impact of drivers and challenges

Chart on Impact of drivers and challenges in 2025 and 2030

3. Market Landscape

3.1 Market ecosystem

Chart on Parent Market
Data Table on - Parent Market

3.2 Market characteristics

Chart on Market characteristics analysis

3.3 Value chain analysis

Chart on Value chain analysis

4. Market Sizing

4.1 Market definition

Data Table on Offerings of companies included in the market definition

4.2 Market segment analysis

Market segments

4.3 Market size 2025

4.4 Market outlook: Forecast for 2025-2030

Chart on Global - Market size and forecast 2025-2030 ($ million)
Data Table on Global - Market size and forecast 2025-2030 ($ million)
Chart on Global Market: Year-over-year growth 2025-2030 (%)
Data Table on Global Market: Year-over-year growth 2025-2030 (%)

5. Historic Market Size

5.1 Global Aramid Fiber Market 2020 - 2024

Historic Market Size - Data Table on Global Aramid Fiber Market 2020 - 2024 ($ million)

5.2 Product segment analysis 2020 - 2024

Historic Market Size - Product Segment 2020 - 2024 ($ million)

5.3 End-user segment analysis 2020 - 2024

Historic Market Size - End-user Segment 2020 - 2024 ($ million)

5.4 Application segment analysis 2020 - 2024

Historic Market Size - Application Segment 2020 - 2024 ($ million)

5.5 Geography segment analysis 2020 - 2024

Historic Market Size - Geography Segment 2020 - 2024 ($ million)

5.6 Country segment analysis 2020 - 2024

Historic Market Size - Country Segment 2020 - 2024 ($ million)

6. Qualitative Analysis

6.1 Impact of AI on Global Aramid Fiber Market

7. Five Forces Analysis

7.1 Five forces summary

Five forces analysis - Comparison between 2025 and 2030

7.2 Bargaining power of buyers

Bargaining power of buyers - Impact of key factors 2025 and 2030

7.3 Bargaining power of suppliers

Bargaining power of suppliers - Impact of key factors in 2025 and 2030

7.4 Threat of new entrants

Threat of new entrants - Impact of key factors in 2025 and 2030

7.5 Threat of substitutes

Threat of substitutes - Impact of key factors in 2025 and 2030

7.6 Threat of rivalry

Threat of rivalry - Impact of key factors in 2025 and 2030

7.7 Market condition

Chart on Market condition - Five forces 2025 and 2030

8. Market Segmentation by Product

8.1 Market segments

Chart on Product - Market share 2025-2030 (%)
Data Table on Product - Market share 2025-2030 (%)

8.2 Comparison by Product

Chart on Comparison by Product
Data Table on Comparison by Product

8.3 Para-aramid - Market size and forecast 2025-2030

Chart on Para-aramid - Market size and forecast 2025-2030 ($ million)
Data Table on Para-aramid - Market size and forecast 2025-2030 ($ million)
Chart on Para-aramid - Year-over-year growth 2025-2030 (%)
Data Table on Para-aramid - Year-over-year growth 2025-2030 (%)

8.4 Meta-aramid - Market size and forecast 2025-2030

Chart on Meta-aramid - Market size and forecast 2025-2030 ($ million)
Data Table on Meta-aramid - Market size and forecast 2025-2030 ($ million)
Chart on Meta-aramid - Year-over-year growth 2025-2030 (%)
Data Table on Meta-aramid - Year-over-year growth 2025-2030 (%)

8.5 Market opportunity by Product

Market opportunity by Product ($ million)
Data Table on Market opportunity by Product ($ million)

9. Market Segmentation by End-user

9.1 Market segments

Chart on End-user - Market share 2025-2030 (%)
Data Table on End-user - Market share 2025-2030 (%)

9.2 Comparison by End-user

Chart on Comparison by End-user
Data Table on Comparison by End-user

9.3 Automotive - Market size and forecast 2025-2030

Chart on Automotive - Market size and forecast 2025-2030 ($ million)
Data Table on Automotive - Market size and forecast 2025-2030 ($ million)
Chart on Automotive - Year-over-year growth 2025-2030 (%)
Data Table on Automotive - Year-over-year growth 2025-2030 (%)

9.4 Aerospace and defense - Market size and forecast 2025-2030

Chart on Aerospace and defense - Market size and forecast 2025-2030 ($ million)
Data Table on Aerospace and defense - Market size and forecast 2025-2030 ($ million)
Chart on Aerospace and defense - Year-over-year growth 2025-2030 (%)
Data Table on Aerospace and defense - Year-over-year growth 2025-2030 (%)

9.5 Electrical and electronics - Market size and forecast 2025-2030

Chart on Electrical and electronics - Market size and forecast 2025-2030 ($ million)
Data Table on Electrical and electronics - Market size and forecast 2025-2030 ($ million)
Chart on Electrical and electronics - Year-over-year growth 2025-2030 (%)
Data Table on Electrical and electronics - Year-over-year growth 2025-2030 (%)

9.6 Others - Market size and forecast 2025-2030

Chart on Others - Market size and forecast 2025-2030 ($ million)
Data Table on Others - Market size and forecast 2025-2030 ($ million)
Chart on Others - Year-over-year growth 2025-2030 (%)
Data Table on Others - Year-over-year growth 2025-2030 (%)

9.7 Market opportunity by End-user

Market opportunity by End-user ($ million)
Data Table on Market opportunity by End-user ($ million)

10. Market Segmentation by Application

10.1 Market segments

Chart on Application - Market share 2025-2030 (%)
Data Table on Application - Market share 2025-2030 (%)

10.2 Comparison by Application

Chart on Comparison by Application
Data Table on Comparison by Application

10.3 Security and protection - Market size and forecast 2025-2030

Chart on Security and protection - Market size and forecast 2025-2030 ($ million)
Data Table on Security and protection - Market size and forecast 2025-2030 ($ million)
Chart on Security and protection - Year-over-year growth 2025-2030 (%)
Data Table on Security and protection - Year-over-year growth 2025-2030 (%)

10.4 Friction materials and gaskets - Market size and forecast 2025-2030

Chart on Friction materials and gaskets - Market size and forecast 2025-2030 ($ million)
Data Table on Friction materials and gaskets - Market size and forecast 2025-2030 ($ million)
Chart on Friction materials and gaskets - Year-over-year growth 2025-2030 (%)
Data Table on Friction materials and gaskets - Year-over-year growth 2025-2030 (%)

10.5 Optical fiber - Market size and forecast 2025-2030

Chart on Optical fiber - Market size and forecast 2025-2030 ($ million)
Data Table on Optical fiber - Market size and forecast 2025-2030 ($ million)
Chart on Optical fiber - Year-over-year growth 2025-2030 (%)
Data Table on Optical fiber - Year-over-year growth 2025-2030 (%)

10.6 Tire reinforcement - Market size and forecast 2025-2030

Chart on Tire reinforcement - Market size and forecast 2025-2030 ($ million)
Data Table on Tire reinforcement - Market size and forecast 2025-2030 ($ million)
Chart on Tire reinforcement - Year-over-year growth 2025-2030 (%)
Data Table on Tire reinforcement - Year-over-year growth 2025-2030 (%)

10.7 Others - Market size and forecast 2025-2030

Chart on Others - Market size and forecast 2025-2030 ($ million)
Data Table on Others - Market size and forecast 2025-2030 ($ million)
Chart on Others - Year-over-year growth 2025-2030 (%)
Data Table on Others - Year-over-year growth 2025-2030 (%)

10.8 Market opportunity by Application

Market opportunity by Application ($ million)
Data Table on Market opportunity by Application ($ million)

11. Customer Landscape

11.1 Customer landscape overview

Analysis of price sensitivity, lifecycle, customer purchase basket, adoption rates, and purchase criteria

12. Geographic Landscape

12.1 Geographic segmentation

Chart on Market share by geography 2025-2030 (%)
Data Table on Market share by geography 2025-2030 (%)

12.2 Geographic comparison

Chart on Geographic comparison
Data Table on Geographic comparison

12.3 Europe - Market size and forecast 2025-2030

Chart on Europe - Market size and forecast 2025-2030 ($ million)
Data Table on Europe - Market size and forecast 2025-2030 ($ million)
Chart on Europe - Year-over-year growth 2025-2030 (%)
Data Table on Europe - Year-over-year growth 2025-2030 (%)
Chart on Regional Comparison - Europe
Data Table on Regional Comparison - Europe

12.3.1 Germany - Market size and forecast 2025-2030

Chart on Germany - Market size and forecast 2025-2030 ($ million)
Data Table on Germany - Market size and forecast 2025-2030 ($ million)
Chart on Germany - Year-over-year growth 2025-2030 (%)
Data Table on Germany - Year-over-year growth 2025-2030 (%)

12.3.2 UK - Market size and forecast 2025-2030

Chart on UK - Market size and forecast 2025-2030 ($ million)
Data Table on UK - Market size and forecast 2025-2030 ($ million)
Chart on UK - Year-over-year growth 2025-2030 (%)
Data Table on UK - Year-over-year growth 2025-2030 (%)

12.3.3 France - Market size and forecast 2025-2030

Chart on France - Market size and forecast 2025-2030 ($ million)
Data Table on France - Market size and forecast 2025-2030 ($ million)
Chart on France - Year-over-year growth 2025-2030 (%)
Data Table on France - Year-over-year growth 2025-2030 (%)

12.3.4 Italy - Market size and forecast 2025-2030

Chart on Italy - Market size and forecast 2025-2030 ($ million)
Data Table on Italy - Market size and forecast 2025-2030 ($ million)
Chart on Italy - Year-over-year growth 2025-2030 (%)
Data Table on Italy - Year-over-year growth 2025-2030 (%)

12.3.5 Spain - Market size and forecast 2025-2030

Chart on Spain - Market size and forecast 2025-2030 ($ million)
Data Table on Spain - Market size and forecast 2025-2030 ($ million)
Chart on Spain - Year-over-year growth 2025-2030 (%)
Data Table on Spain - Year-over-year growth 2025-2030 (%)

12.3.6 The Netherlands - Market size and forecast 2025-2030

Chart on The Netherlands - Market size and forecast 2025-2030 ($ million)
Data Table on The Netherlands - Market size and forecast 2025-2030 ($ million)
Chart on The Netherlands - Year-over-year growth 2025-2030 (%)
Data Table on The Netherlands - Year-over-year growth 2025-2030 (%)

12.4 North America - Market size and forecast 2025-2030

Chart on North America - Market size and forecast 2025-2030 ($ million)
Data Table on North America - Market size and forecast 2025-2030 ($ million)
Chart on North America - Year-over-year growth 2025-2030 (%)
Data Table on North America - Year-over-year growth 2025-2030 (%)
Chart on Regional Comparison - North America
Data Table on Regional Comparison - North America

12.4.1 US - Market size and forecast 2025-2030

Chart on US - Market size and forecast 2025-2030 ($ million)
Data Table on US - Market size and forecast 2025-2030 ($ million)
Chart on US - Year-over-year growth 2025-2030 (%)
Data Table on US - Year-over-year growth 2025-2030 (%)

12.4.2 Canada - Market size and forecast 2025-2030

Chart on Canada - Market size and forecast 2025-2030 ($ million)
Data Table on Canada - Market size and forecast 2025-2030 ($ million)
Chart on Canada - Year-over-year growth 2025-2030 (%)
Data Table on Canada - Year-over-year growth 2025-2030 (%)

12.4.3 Mexico - Market size and forecast 2025-2030

Chart on Mexico - Market size and forecast 2025-2030 ($ million)
Data Table on Mexico - Market size and forecast 2025-2030 ($ million)
Chart on Mexico - Year-over-year growth 2025-2030 (%)
Data Table on Mexico - Year-over-year growth 2025-2030 (%)

12.5 APAC - Market size and forecast 2025-2030

Chart on APAC - Market size and forecast 2025-2030 ($ million)
Data Table on APAC - Market size and forecast 2025-2030 ($ million)
Chart on APAC - Year-over-year growth 2025-2030 (%)
Data Table on APAC - Year-over-year growth 2025-2030 (%)
Chart on Regional Comparison - APAC
Data Table on Regional Comparison - APAC

12.5.1 China - Market size and forecast 2025-2030

Chart on China - Market size and forecast 2025-2030 ($ million)
Data Table on China - Market size and forecast 2025-2030 ($ million)
Chart on China - Year-over-year growth 2025-2030 (%)
Data Table on China - Year-over-year growth 2025-2030 (%)

12.5.2 Japan - Market size and forecast 2025-2030

Chart on Japan - Market size and forecast 2025-2030 ($ million)
Data Table on Japan - Market size and forecast 2025-2030 ($ million)
Chart on Japan - Year-over-year growth 2025-2030 (%)
Data Table on Japan - Year-over-year growth 2025-2030 (%)

12.5.3 India - Market size and forecast 2025-2030

Chart on India - Market size and forecast 2025-2030 ($ million)
Data Table on India - Market size and forecast 2025-2030 ($ million)
Chart on India - Year-over-year growth 2025-2030 (%)
Data Table on India - Year-over-year growth 2025-2030 (%)

12.5.4 South Korea - Market size and forecast 2025-2030

Chart on South Korea - Market size and forecast 2025-2030 ($ million)
Data Table on South Korea - Market size and forecast 2025-2030 ($ million)
Chart on South Korea - Year-over-year growth 2025-2030 (%)
Data Table on South Korea - Year-over-year growth 2025-2030 (%)

12.5.5 Australia - Market size and forecast 2025-2030

Chart on Australia - Market size and forecast 2025-2030 ($ million)
Data Table on Australia - Market size and forecast 2025-2030 ($ million)
Chart on Australia - Year-over-year growth 2025-2030 (%)
Data Table on Australia - Year-over-year growth 2025-2030 (%)

12.5.6 Indonesia - Market size and forecast 2025-2030

Chart on Indonesia - Market size and forecast 2025-2030 ($ million)
Data Table on Indonesia - Market size and forecast 2025-2030 ($ million)
Chart on Indonesia - Year-over-year growth 2025-2030 (%)
Data Table on Indonesia - Year-over-year growth 2025-2030 (%)

12.6 South America - Market size and forecast 2025-2030

Chart on South America - Market size and forecast 2025-2030 ($ million)
Data Table on South America - Market size and forecast 2025-2030 ($ million)
Chart on South America - Year-over-year growth 2025-2030 (%)
Data Table on South America - Year-over-year growth 2025-2030 (%)
Chart on Regional Comparison - South America
Data Table on Regional Comparison - South America

12.6.1 Brazil - Market size and forecast 2025-2030

Chart on Brazil - Market size and forecast 2025-2030 ($ million)
Data Table on Brazil - Market size and forecast 2025-2030 ($ million)
Chart on Brazil - Year-over-year growth 2025-2030 (%)
Data Table on Brazil - Year-over-year growth 2025-2030 (%)

12.6.2 Argentina - Market size and forecast 2025-2030

Chart on Argentina - Market size and forecast 2025-2030 ($ million)
Data Table on Argentina - Market size and forecast 2025-2030 ($ million)
Chart on Argentina - Year-over-year growth 2025-2030 (%)
Data Table on Argentina - Year-over-year growth 2025-2030 (%)

12.6.3 Chile - Market size and forecast 2025-2030

Chart on Chile - Market size and forecast 2025-2030 ($ million)
Data Table on Chile - Market size and forecast 2025-2030 ($ million)
Chart on Chile - Year-over-year growth 2025-2030 (%)
Data Table on Chile - Year-over-year growth 2025-2030 (%)

12.7 Middle East and Africa - Market size and forecast 2025-2030

Chart on Middle East and Africa - Market size and forecast 2025-2030 ($ million)
Data Table on Middle East and Africa - Market size and forecast 2025-2030 ($ million)
Chart on Middle East and Africa - Year-over-year growth 2025-2030 (%)
Data Table on Middle East and Africa - Year-over-year growth 2025-2030 (%)
Chart on Regional Comparison - Middle East and Africa
Data Table on Regional Comparison - Middle East and Africa

12.7.1 Saudi Arabia - Market size and forecast 2025-2030

Chart on Saudi Arabia - Market size and forecast 2025-2030 ($ million)
Data Table on Saudi Arabia - Market size and forecast 2025-2030 ($ million)
Chart on Saudi Arabia - Year-over-year growth 2025-2030 (%)
Data Table on Saudi Arabia - Year-over-year growth 2025-2030 (%)

12.7.2 UAE - Market size and forecast 2025-2030

Chart on UAE - Market size and forecast 2025-2030 ($ million)
Data Table on UAE - Market size and forecast 2025-2030 ($ million)
Chart on UAE - Year-over-year growth 2025-2030 (%)
Data Table on UAE - Year-over-year growth 2025-2030 (%)

12.7.3 South Africa - Market size and forecast 2025-2030

Chart on South Africa - Market size and forecast 2025-2030 ($ million)
Data Table on South Africa - Market size and forecast 2025-2030 ($ million)
Chart on South Africa - Year-over-year growth 2025-2030 (%)
Data Table on South Africa - Year-over-year growth 2025-2030 (%)

12.7.4 Israel - Market size and forecast 2025-2030

Chart on Israel - Market size and forecast 2025-2030 ($ million)
Data Table on Israel - Market size and forecast 2025-2030 ($ million)
Chart on Israel - Year-over-year growth 2025-2030 (%)
Data Table on Israel - Year-over-year growth 2025-2030 (%)

12.7.5 Turkey - Market size and forecast 2025-2030

Chart on Turkey - Market size and forecast 2025-2030 ($ million)
Data Table on Turkey - Market size and forecast 2025-2030 ($ million)
Chart on Turkey - Year-over-year growth 2025-2030 (%)
Data Table on Turkey - Year-over-year growth 2025-2030 (%)

12.8 Market opportunity by geography

Market opportunity by geography ($ million)
Data Tables on Market opportunity by geography ($ million)

13. Drivers, Challenges, and Opportunity

13.1 Market drivers

Increasing demand for lightweight materials in aerospace and automotive industries
Rising demand for protective equipment in defense and industrial safety
Sustainable innovation advancing aramid fiber adoption

13.2 Market challenges

High production costs and raw material price volatility
Increasing competition from substitute materials
Environmental and regulatory compliance burdens

13.3 Impact of drivers and challenges

Impact of drivers and challenges in 2025 and 2030

13.4 Market opportunities

Capacity expansion and strategic investments by leading producers
Advancements in recycling and traceability technologies
Increasing integration in emerging high-performance applications

14. Competitive Landscape

14.1 Overview

14.2

Overview on criticality of inputs and factors of differentiation

14.3 Landscape disruption

Overview on factors of disruption

14.4 Industry risks

Impact of key risks on business

15. Competitive Analysis

15.1 Companies profiled

Companies covered

15.2 Company ranking index

15.3 Market positioning of companies

Matrix on companies position and classification

15.4 Aramid HPM LLC

Aramid HPM LLC - Overview
Aramid HPM LLC - Product / Service
Aramid HPM LLC - Key offerings
SWOT

15.5 China National Bluestar Group

China National Bluestar Group - Overview
China National Bluestar Group - Product / Service
China National Bluestar Group - Key offerings
SWOT

15.6 DuPont de Nemours Inc.

DuPont de Nemours Inc. - Overview
DuPont de Nemours Inc. - Business segments
DuPont de Nemours Inc. - Key news
DuPont de Nemours Inc. - Key offerings
DuPont de Nemours Inc. - Segment focus
SWOT

15.7 Hangzhou Segurmax Textile

Hangzhou Segurmax Textile - Overview
Hangzhou Segurmax Textile - Product / Service
Hangzhou Segurmax Textile - Key offerings
SWOT

15.8 Huvis Corp.

Huvis Corp. - Overview
Huvis Corp. - Product / Service
Huvis Corp. - Key offerings
SWOT

15.9 Hyosung Corp.

Hyosung Corp. - Overview
Hyosung Corp. - Product / Service
Hyosung Corp. - Key offerings
SWOT

15.10 Kolon Industries Inc.

Kolon Industries Inc. - Overview
Kolon Industries Inc. - Business segments
Kolon Industries Inc. - Key offerings
Kolon Industries Inc. - Segment focus
SWOT

15.11 Lydall Inc.

Lydall Inc. - Overview
Lydall Inc. - Product / Service
Lydall Inc. - Key offerings
SWOT

15.12 PITAKA Technology Co. Ltd.

PITAKA Technology Co. Ltd. - Overview
PITAKA Technology Co. Ltd. - Product / Service
PITAKA Technology Co. Ltd. - Key offerings
SWOT

15.13 Shenma Industrial Co. Ltd.

Shenma Industrial Co. Ltd. - Overview
Shenma Industrial Co. Ltd. - Product / Service
Shenma Industrial Co. Ltd. - Key offerings
SWOT

15.14 Sinopec Shanghai Co. Ltd.

Sinopec Shanghai Co. Ltd. - Overview
Sinopec Shanghai Co. Ltd. - Business segments
Sinopec Shanghai Co. Ltd. - Key news
Sinopec Shanghai Co. Ltd. - Key offerings
Sinopec Shanghai Co. Ltd. - Segment focus
SWOT

15.15 Taekwang Industrial Co. Ltd.

Taekwang Industrial Co. Ltd. - Overview
Taekwang Industrial Co. Ltd. - Product / Service
Taekwang Industrial Co. Ltd. - Key offerings
SWOT

15.16 Toray Industries Inc.

Toray Industries Inc. - Overview
Toray Industries Inc. - Business segments
Toray Industries Inc. - Key news
Toray Industries Inc. - Key offerings
Toray Industries Inc. - Segment focus
SWOT

15.17 Toyobo Co. Ltd.

Toyobo Co. Ltd. - Overview
Toyobo Co. Ltd. - Business segments
Toyobo Co. Ltd. - Key offerings
Toyobo Co. Ltd. - Segment focus
SWOT

15.18 Yantai Tayho Advanced Materials

Yantai Tayho Advanced Materials - Overview
Yantai Tayho Advanced Materials - Product / Service
Yantai Tayho Advanced Materials - Key offerings
SWOT

16. Appendix

16.1 Scope of the report

Market definition
Objectives
Notes and caveats

16.2 Inclusions and exclusions checklist

Inclusions checklist
Exclusions checklist

16.3 Currency conversion rates for US$

16.4 Research methodology

16.5 Data procurement

Information sources

16.6 Data validation

16.7 Validation techniques employed for market sizing

16.8 Data synthesis

16.9 360 degree market analysis

16.10 List of abbreviations

Research Methodology

Technavio presents a detailed picture of the market by way of study, synthesis, and summation of data from multiple sources. The analysts have presented the various facets of the market with a particular focus on identifying the key industry influencers. The data thus presented is comprehensive, reliable, and the result of extensive research, both primary and secondary.

INFORMATION SOURCES

Primary sources

  • Manufacturers and suppliers
  • Channel partners
  • Industry experts
  • Strategic decision makers

Secondary sources

  • Industry journals and periodicals
  • Government data
  • Financial reports of key industry players
  • Historical data
  • Press releases

DATA ANALYSIS

Data Synthesis

  • Collation of data
  • Estimation of key figures
  • Analysis of derived insights

Data Validation

  • Triangulation with data models
  • Reference against proprietary databases
  • Corroboration with industry experts

REPORT WRITING

Qualitative

  • Market drivers
  • Market challenges
  • Market trends
  • Five forces analysis

Quantitative

  • Market size and forecast
  • Market segmentation
  • Geographical insights
  • Competitive landscape

Interested in this report?

Get your sample now to see our research methodology and insights!

Download Now

Frequently Asked Questions

Aramid Fiber market growth will increase by USD 1344.4 million during 2026-2030.

The Aramid Fiber market is expected to grow at a CAGR of 3.9% during 2026-2030.

Aramid Fiber market is segmented by Product (Para-aramid, Meta-aramid) End-user (Automotive, Aerospace and defense, Electrical and electronics, Others) Application (Security and protection, Friction materials and gaskets, Optical fiber, Tire reinforcement, Others)

Aramid HPM LLC, Chaomeisi New Materials Co., China National Bluestar Group, DuPont de Nemours Inc., Hangzhou Segurmax Textile, Huvis Corp., Hyosung Corp., Kolon Industries Inc., Lydall Inc., PITAKA Technology Co. Ltd., Shanghai J and S New Materials, Shenma Industrial Co. Ltd., Sinopec Shanghai Co. Ltd., Taekwang Industrial Co. Ltd., Toray Industries Inc., Toyobo Co. Ltd., Yantai Tayho Advanced Materials are a few of the key vendors in the Aramid Fiber market.

APAC will register the highest growth rate of 34.4% among the other regions. Therefore, the Aramid Fiber market in APAC is expected to garner significant business opportunities for the vendors during the forecast period.

Germany, UK, France, Italy, Spain, The Netherlands, US, Canada, Mexico, China, Japan, India, South Korea, Australia, Indonesia, Brazil, Argentina, Chile, Saudi Arabia, UAE, South Africa, Israel, Turkey

  • Increasing demand for lightweight materials in aerospace and automotive industries is the driving factor this market.

The Aramid Fiber market vendors should focus on grabbing business opportunities from the Product segment as it accounted for the largest market share in the base year.