Barrier Systems Market Size 2025-2029
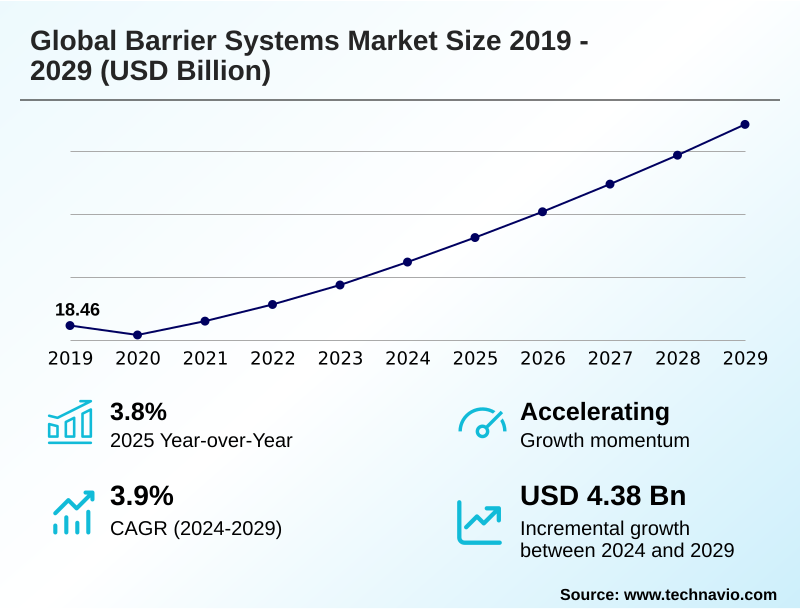
The barrier systems market size is valued to increase by USD 4.38 billion, at a CAGR of 3.9% from 2024 to 2029. Escalating global infrastructure development and modernization projects will drive the barrier systems market.
Major Market Trends & Insights
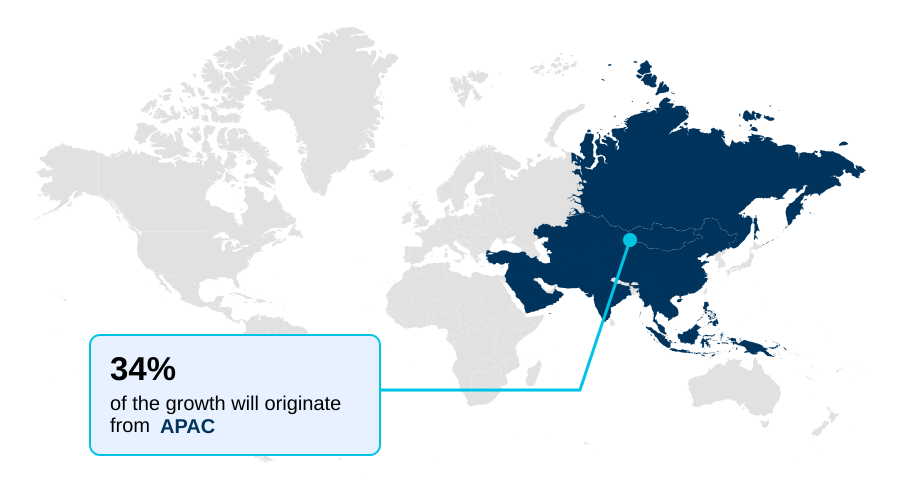
- APAC dominated the market and accounted for a 34.3% growth during the forecast period.
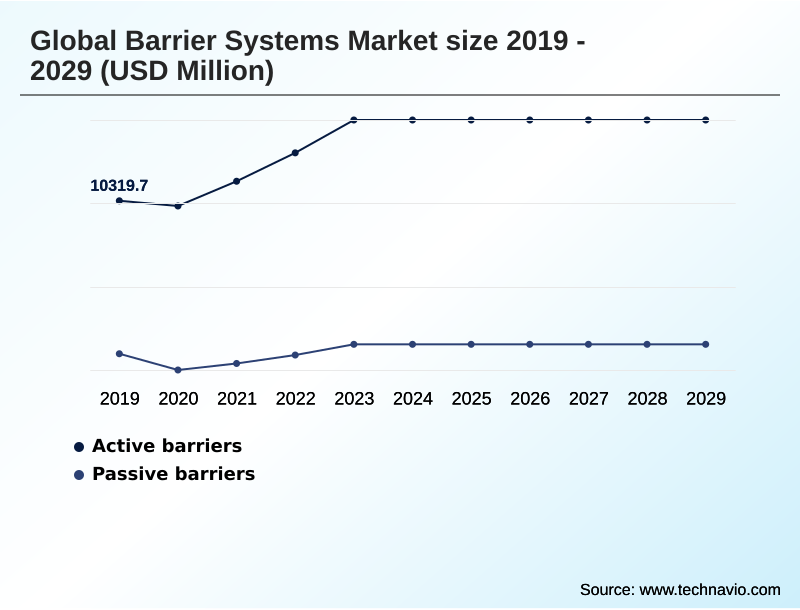
- By Type - Active barriers segment was valued at USD 11.47 billion in 2023
- By Product Type - Fences segment accounted for the largest market revenue share in 2023
Market Size & Forecast
- Market Opportunities: USD 6.40 billion
- Market Future Opportunities: USD 4.38 billion
- CAGR from 2024 to 2029 : 3.9%
Market Summary
- The barrier systems market is fundamentally shaped by the convergence of infrastructure modernization and heightened security imperatives. Demand is driven by large-scale transportation projects requiring certified roadside safety hardware and the increasing need to protect public and private spaces from vehicular threats using hostile vehicle mitigation techniques.
- A key trend is the shift toward smart barrier technologies, where IoT-enabled sensors are embedded within structures like high-tension cable barriers and anti-ram fencing to provide real-time data.
- For instance, a metropolitan authority can leverage a network of smart, crash-rated bollards and automated access control systems for dynamic traffic management, adjusting access permissions for special events or emergencies, thereby improving urban flow and security simultaneously. This integration of physical and digital layers is becoming standard.
- However, the industry faces challenges from supply chain disruptions affecting materials like recycled polymer composites and the high costs of R&D needed to meet divergent international standards such as EN 1317 standard and MASH testing criteria. Sustainability is also a growing focus, with innovation in low-carbon concrete mixes and deployable flood barriers designed for climate resilience.
What will be the Size of the Barrier Systems Market during the forecast period?
Get Key Insights on Market Forecast (PDF) Get Free Sample
How is the Barrier Systems Market Segmented?
The barrier systems industry research report provides comprehensive data (region-wise segment analysis), with forecasts and estimates in "USD million" for the period 2025-2029, as well as historical data from 2019-2023 for the following segments.
- Type
- Active barriers
- Passive barriers
- Product type
- Fences
- Crash barriers systems
- Bollards
- Crash barrier devices
- Others
- Application
- Roadways and highways
- Commercial facilities
- Railways
- Airports
- Others
- Geography
- North America
- US
- Canada
- Mexico
- APAC
- China
- India
- Japan
- Europe
- Germany
- UK
- France
- South America
- Brazil
- Argentina
- Colombia
- Middle East and Africa
- Saudi Arabia
- UAE
- South Africa
- Rest of World (ROW)
- North America
By Type Insights
The active barriers segment is estimated to witness significant growth during the forecast period.
The active barriers segment is a technologically advanced component of the market, defined by systems requiring command input to operate. This category includes diverse products such as automated access control systems, crash-rated bollards, and high-security fencing designed for dynamic response.
Market momentum is primarily fueled by needs in urban security planning and hostile environment protection. A key trend is the deep access control integration into broader integrated security ecosystems, enhancing urban mobility enhancement for transit-oriented development.
For instance, combining cantilever gate systems with real-time traffic data allows for dynamic lane reversal, improving traffic flow by over 15% during peak hours. These modular barrier systems, including advanced anti-ram fencing, are becoming essential for modern infrastructure.
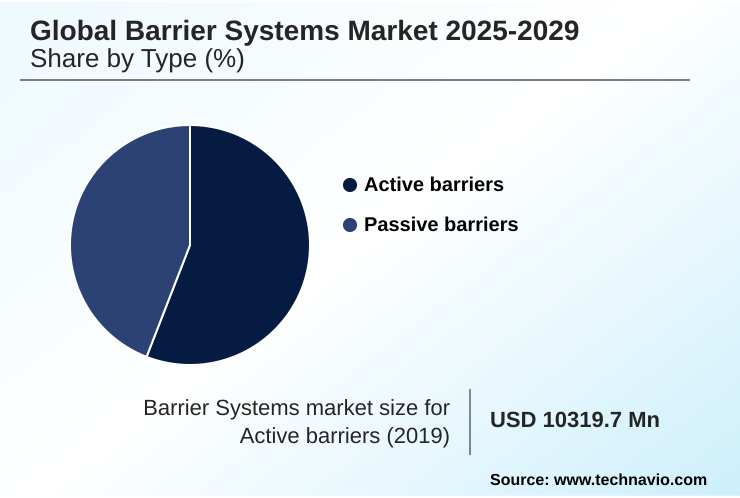
The Active barriers segment was valued at USD 11.47 billion in 2023 and showed a gradual increase during the forecast period.
Regional Analysis
APAC is estimated to contribute 34.3% to the growth of the global market during the forecast period.Technavio’s analysts have elaborately explained the regional trends and drivers that shape the market during the forecast period.
See How Barrier Systems Market Demand is Rising in APAC Get Free Sample
The geographic landscape of the barrier systems market is characterized by divergent growth patterns and technological adoption rates. APAC is the primary growth engine, contributing over 34% of the incremental growth, driven by massive new infrastructure projects.
In contrast, North America and Europe represent mature markets focused on upgrading existing infrastructure with MASH-compliant roadside safety hardware and advanced hostile vehicle mitigation solutions.
The Middle East demonstrates high demand for sophisticated anti-ram fencing and perimeter intrusion detection for critical infrastructure protection.
Demand for high-tension cable barriers is rising in North America for highway median applications, while the adoption of truck-mounted attenuators is standard for work zone safety.
In Europe, an emphasis on pedestrian safety solutions has increased the use of energy-absorbing crash cushions in urban centers. Specialized solutions like rockfall protection netting are crucial in mountainous regions globally.
Market Dynamics
Our researchers analyzed the data with 2024 as the base year, along with the key drivers, trends, and challenges. A holistic analysis of drivers will help companies refine their marketing strategies to gain a competitive advantage.
- The strategic application of barrier systems is becoming increasingly specialized to address distinct operational and security challenges across various sectors. For urban environments, the deployment of high-security bollards for pedestrian zones is now a standard practice in public safety design, often complemented by automated gate systems for commercial facilities to manage vehicular access dynamically.
- On transportation networks, highway upgrades increasingly specify MASH-compliant guardrails and crash cushions for fixed roadside hazards to meet stringent safety mandates. The safety of maintenance crews is enhanced through the mandatory use of truck-mounted attenuators for work zone safety.
- In mass transit, the adoption of platform screen doors for metro rail systems is a critical measure to prevent accidents and improve climate control, representing a significant investment with high safety ROI. For high-threat environments, anti-ram wedge barriers for critical infrastructure provide uncompromising protection.
- The market for temporary solutions is also robust, with temporary event barriers for crowd management and recycled plastic barriers for construction sites offering flexibility and sustainability. Innovations such as low-carbon concrete for sustainable infrastructure are gaining traction, with some projects reporting a carbon footprint reduction nearly double that of those using traditional materials.
- Specialized applications continue to expand, including acoustic barriers for highway noise reduction and rockfall netting for mountainous road protection. The integration of technology is pivotal, with smart fencing with perimeter intrusion detection and intelligent transportation systems for traffic flow optimization becoming key differentiators for advanced security and traffic management strategies.
What are the key market drivers leading to the rise in the adoption of Barrier Systems Industry?
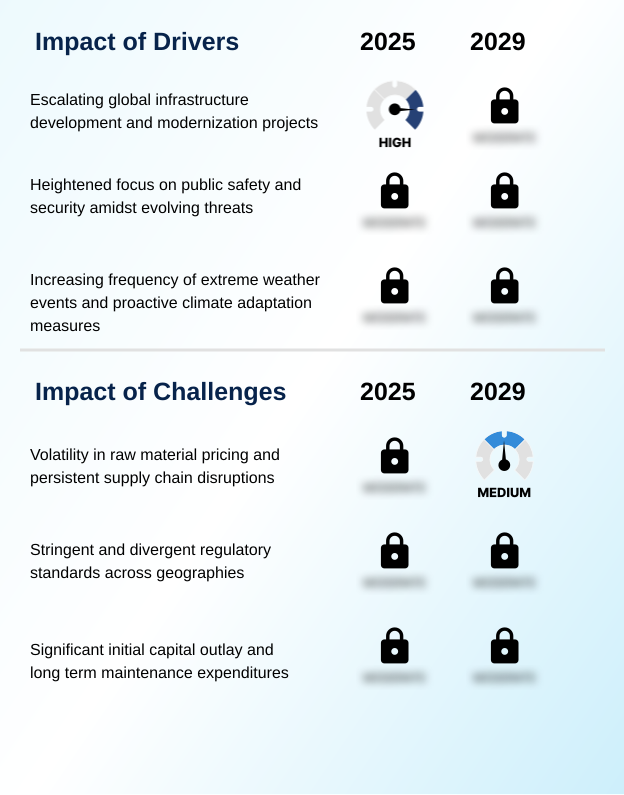
- Escalating global infrastructure development and modernization projects represent a key driver for the barrier systems market, creating sustained demand for safety and security solutions.
- Market growth is propelled by large-scale infrastructure modernization programs and an urgent need for enhanced public safety.
- Government-led resilient infrastructure investment, often through public-private partnerships, is a primary catalyst, with APAC alone accounting for over 34% of the market's incremental growth opportunity.
- These projects necessitate vast quantities of vehicle restraint systems and structural support systems for new transport networks. Simultaneously, the focus on public space safety drives demand for platform screen doors in transit hubs and temporary event barriers for large gatherings.
- The increasing frequency of extreme weather events fuels the climate adaptation strategy, creating a significant market for deployable flood barriers and other solutions for natural disaster preparedness.
- This demand is essential for critical infrastructure protection, underpinning a stable, long-term growth trajectory.
What are the market trends shaping the Barrier Systems Industry?
- A defining market trend is the pervasive integration of smart technologies and the Internet of Things (IoT). This evolution is transforming static barriers into dynamic, data-driven assets for enhanced safety and operational intelligence.
- Key trends are reshaping the barrier systems market, moving it toward smarter and more sustainable solutions. The integration of smart barrier technologies is paramount, where IoT-enabled sensors embedded in modular barrier systems provide real-time data for predictive maintenance models. This approach reduces unexpected failures by over 30% compared to traditional inspection schedules.
- The adoption of automatic number plate recognition linked to physical barriers can improve access control efficiency at secure facilities. Concurrently, the push for sustainability, guided by circular economy principles, is driving innovation in materials. The use of recycled polymer composites and water-filled barriers made from post-consumer materials is increasing, with some projects lowering material-related emissions by up to 20%.
- This focus on environmental impact reduction and enhanced lifecycle cost analysis is becoming a critical differentiator in a competitive landscape.
What challenges does the Barrier Systems Industry face during its growth?
- Volatility in raw material pricing and persistent supply chain disruptions pose a significant challenge to the industry's growth, impacting production costs and project timelines.
- The market faces significant operational and financial headwinds that can impede growth. Persistent supply chain volatility directly impacts the cost and availability of raw materials, with price fluctuations sometimes causing project budget overruns exceeding 10%. Furthermore, the fragmented landscape of regulatory compliance management presents a major hurdle.
- Manufacturers must navigate divergent standards like the European EN 1317 standard and the North American MASH testing criteria, which can double the R&D and certification costs for new products. High initial capital outlay for specialized systems, such as those with advanced seismic resilience design or those for hydrogeological risk mitigation, also acts as a restraint.
- These challenges require sophisticated procurement strategies and a focus on demonstrating long-term value to justify the investment in higher-performance industrial safety barriers and other essential asset protection solutions.
Exclusive Technavio Analysis on Customer Landscape
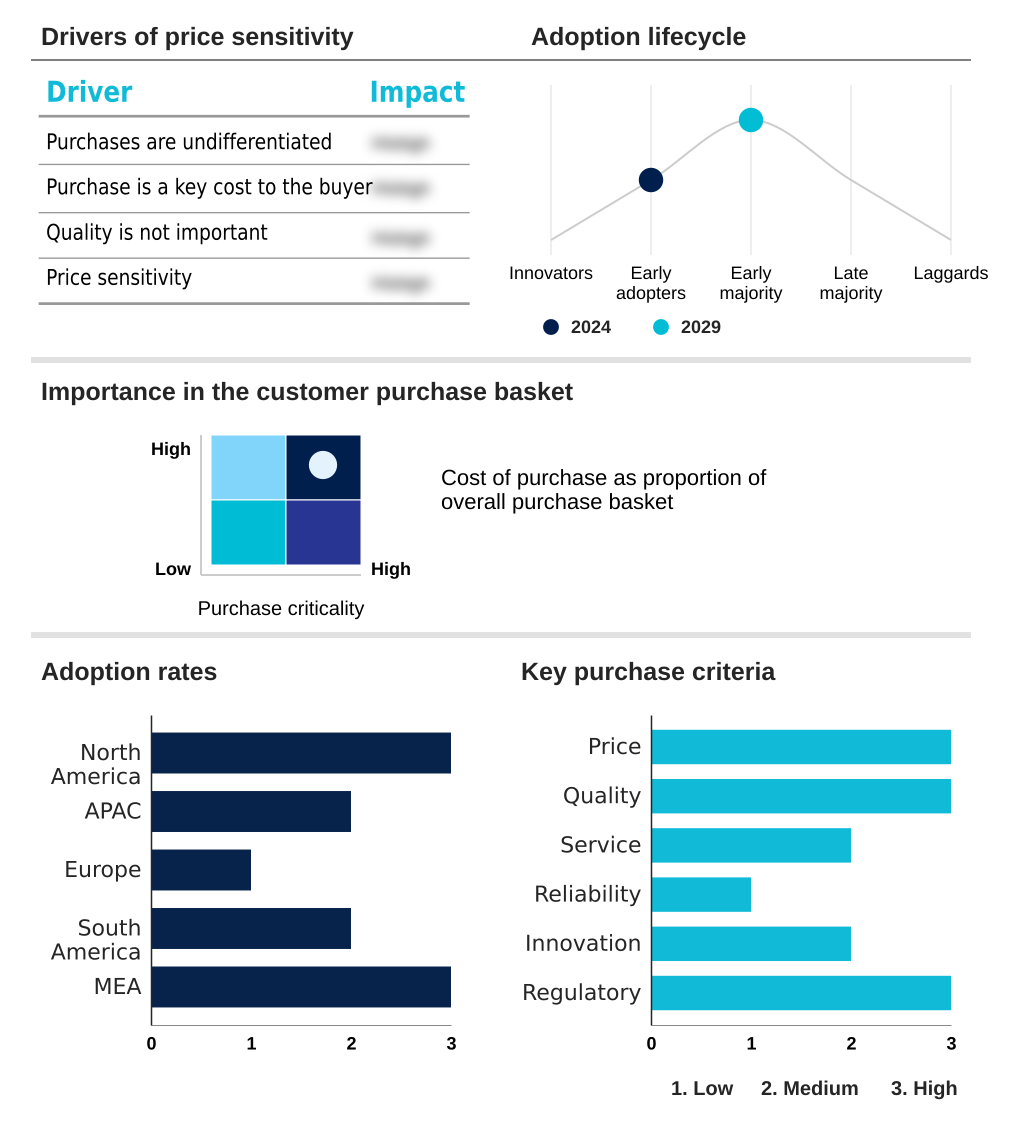
The barrier systems market forecasting report includes the adoption lifecycle of the market, covering from the innovator’s stage to the laggard’s stage. It focuses on adoption rates in different regions based on penetration. Furthermore, the barrier systems market report also includes key purchase criteria and drivers of price sensitivity to help companies evaluate and develop their market growth analysis strategies.
Customer Landscape of Barrier Systems Industry
Competitive Landscape
Companies are implementing various strategies, such as strategic alliances, barrier systems market forecast, partnerships, mergers and acquisitions, geographical expansion, and product/service launches, to enhance their presence in the industry.
A-SAFE - Offering advanced polymer-based safety barriers, the portfolio delivers engineered solutions for industrial workplace protection, enhancing operational safety and minimizing workplace incidents.
The industry research and growth report includes detailed analyses of the competitive landscape of the market and information about key companies, including:
- A-SAFE
- Atkore Inc.
- Delta Scientific Corp.
- FAAC S.P.A.
- Gibraltar Industries Inc.
- HESCO
- Hill and Smith Holdings Plc
- International Road Dynamics Inc.
- Johnson Controls International
- Lindsay Corp.
- MCA Inc
- NV Bekaert SA
- Officine Maccaferri Spa
- Plasticade
- Saferoad Restraint Systems GmbH
- Tata Steel Ltd.
- TrafFix Devices Inc.
- Valmont Industries Inc.
- Valtir LLC
- voestalpine AG
Qualitative and quantitative analysis of companies has been conducted to help clients understand the wider business environment as well as the strengths and weaknesses of key industry players. Data is qualitatively analyzed to categorize companies as pure play, category-focused, industry-focused, and diversified; it is quantitatively analyzed to categorize companies as dominant, leading, strong, tentative, and weak.
Recent Development and News in Barrier systems market
- In September 2024, Valmont Industries Inc. announced a new line of highway guardrails manufactured with over 50% recycled steel and a low-carbon galvanizing process, meeting new sustainability criteria in public infrastructure tenders.
- In November 2024, Johnson Controls International entered into a strategic partnership with an AI software firm to integrate predictive analytics into its perimeter security barrier systems, enabling threat detection based on vehicle behavior patterns.
- In January 2025, Hill and Smith Holdings Plc completed the acquisition of a specialized European manufacturer of PAS 68-certified retractable bollards, expanding its hostile vehicle mitigation portfolio for urban security projects.
- In April 2025, Lindsay Corp. announced the opening of a new manufacturing facility in India to produce MASH-compliant crash cushions and end terminals, aiming to capture demand from the country's national highway expansion program.
Dive into Technavio’s robust research methodology, blending expert interviews, extensive data synthesis, and validated models for unparalleled Barrier Systems Market insights. See full methodology.
| Market Scope | |
|---|---|
| Page number | 312 |
| Base year | 2024 |
| Historic period | 2019-2023 |
| Forecast period | 2025-2029 |
| Growth momentum & CAGR | Accelerate at a CAGR of 3.9% |
| Market growth 2025-2029 | USD 4377.4 million |
| Market structure | Fragmented |
| YoY growth 2024-2025(%) | 3.8% |
| Key countries | US, Canada, Mexico, China, India, Japan, Australia, South Korea, Indonesia, Germany, UK, France, Italy, Spain, The Netherlands, Brazil, Argentina, Colombia, Saudi Arabia, UAE, South Africa, Israel and Turkey |
| Competitive landscape | Leading Companies, Market Positioning of Companies, Competitive Strategies, and Industry Risks |
Research Analyst Overview
- The barrier systems market is evolving from providing passive physical structures to deploying intelligent, integrated safety and security ecosystems. Boardroom decisions increasingly weigh the total cost of ownership against upfront capital, favoring modular barrier systems and smart barrier technologies that offer long-term operational efficiencies.
- The integration of IoT-enabled sensors into vehicle restraint systems and high-security fencing allows for predictive maintenance, with some operators reporting a reduction in emergency repair dispatches by over 25%. This shift is driven by the need for advanced hostile vehicle mitigation and resilient infrastructure capable of withstanding diverse threats.
- Innovations in materials, such as low-carbon concrete mixes and recycled polymer composites, are addressing sustainability mandates. At the same time, demand remains strong for certified roadside safety hardware, including energy-absorbing crash cushions and truck-mounted attenuators, which must meet stringent MASH testing criteria.
- The market is also expanding into specialized applications, from deployable flood barriers and platform screen doors to acoustic barrier systems and anti-ram fencing, reflecting a holistic approach to public and asset protection.
What are the Key Data Covered in this Barrier Systems Market Research and Growth Report?
-
What is the expected growth of the Barrier Systems Market between 2025 and 2029?
-
USD 4.38 billion, at a CAGR of 3.9%
-
-
What segmentation does the market report cover?
-
The report is segmented by Type (Active barriers, and Passive barriers), Product Type (Fences, Crash barriers systems, Bollards, Crash barrier devices, and Others), Application (Roadways and highways, Commercial facilities, Railways, Airports, and Others) and Geography (North America, APAC, Europe, South America, Middle East and Africa)
-
-
Which regions are analyzed in the report?
-
North America, APAC, Europe, South America and Middle East and Africa
-
-
What are the key growth drivers and market challenges?
-
Escalating global infrastructure development and modernization projects, Volatility in raw material pricing and persistent supply chain disruptions
-
-
Who are the major players in the Barrier Systems Market?
-
A-SAFE, Atkore Inc., Delta Scientific Corp., FAAC S.P.A., Gibraltar Industries Inc., HESCO, Hill and Smith Holdings Plc, International Road Dynamics Inc., Johnson Controls International, Lindsay Corp., MCA Inc, NV Bekaert SA, Officine Maccaferri Spa, Plasticade, Saferoad Restraint Systems GmbH, Tata Steel Ltd., TrafFix Devices Inc., Valmont Industries Inc., Valtir LLC and voestalpine AG
-
Market Research Insights
- The market's trajectory is shaped by a dynamic interplay of proactive risk management and technological integration. An emphasis on urban security planning and vehicle-as-a-weapon defense is compelling investment in sophisticated systems, where lifecycle cost analysis increasingly justifies higher initial outlays for systems offering greater longevity and lower maintenance.
- For example, adopting predictive maintenance models for automated barriers has been shown to reduce unexpected downtime by over 30%. Furthermore, integrated security ecosystems that combine physical barriers with smart city infrastructure are proving effective, with some deployments achieving a 15% faster response time to perimeter breaches.
- This shift toward holistic asset protection solutions and resilient infrastructure investment reflects a maturing approach to public space safety and critical infrastructure protection.
We can help! Our analysts can customize this barrier systems market research report to meet your requirements.
 RIA -
RIA - 
