Battery Market In Telecommunication Industry Size 2025-2029
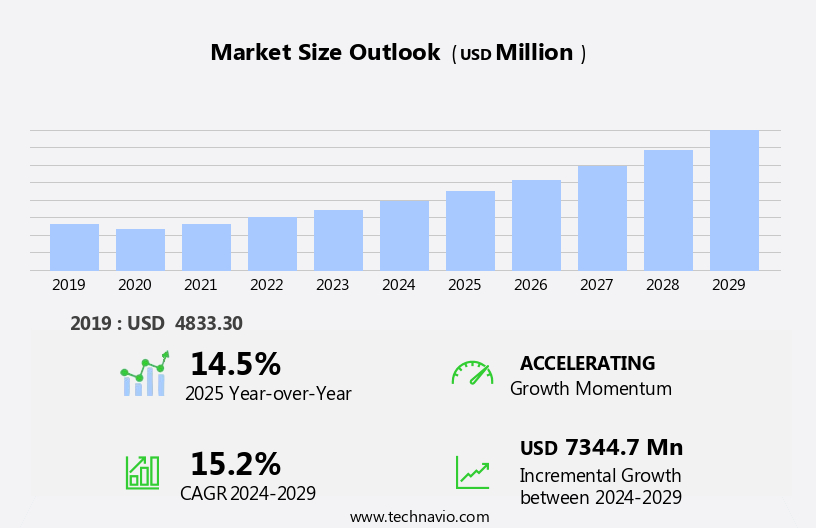
The battery market size in telecommunication industry is forecast to increase by USD 7.34 billion at a CAGR of 15.2% between 2024 and 2029.
- The market is experiencing significant growth, driven by the increasing power consumption in the telecommunications industry. This trend is being fueled by the proliferation of 5G networks and the Internet of Things (IoT), which require more power to support their operations. Additionally, the decline in lithium-ion battery prices and diesel prices is making these energy sources more cost-effective for telecom companies, further boosting market growth. However, challenges such as the need for reliable and long-lasting batteries, as well as the environmental concerns surrounding battery disposal, remain key obstacles to market expansion.
- Companies in the telecommunications sector seeking to capitalize on this market opportunity must focus on developing innovative battery solutions that address these challenges while meeting the increasing power demands of their networks. Strategic partnerships, research and development investments, and a commitment to sustainability will be essential for success in this dynamic and evolving market.
What will be the Size of the Battery Market In Telecommunication Industry during the forecast period?

Request Free Sample
- The market encompasses various battery types, including lithium-ion, lead-acid, flow, nickel-metal hydride, sodium-sulfur, zinc-manganese dioxide, and SLI batteries. These batteries cater to diverse applications, such as consumer electronics, portable devices, industrial equipment, power tools, automotive needs, and grid storage. The market's growth is driven by the increasing demand for sustainable transportation, renewable energy infrastructure, and carbon emissions reduction.
- Electric vehicles, a significant segment, necessitate large-scale battery production capacity to meet growing consumer demand. Battery innovations continue to emerge, with advancements in energy storage solutions and sustainable energy sources shaping the market's future direction. Overall, the telecommunication industry battery market is poised for significant expansion, fueled by the global shift towards sustainable and efficient energy solutions.
How is this Battery Market In Telecommunication Industry segmented?
The market research report provides comprehensive data (region-wise segment analysis), with forecasts and estimates in "USD billion" for the period 2025-2029, as well as historical data from 2019-2023 for the following segments.
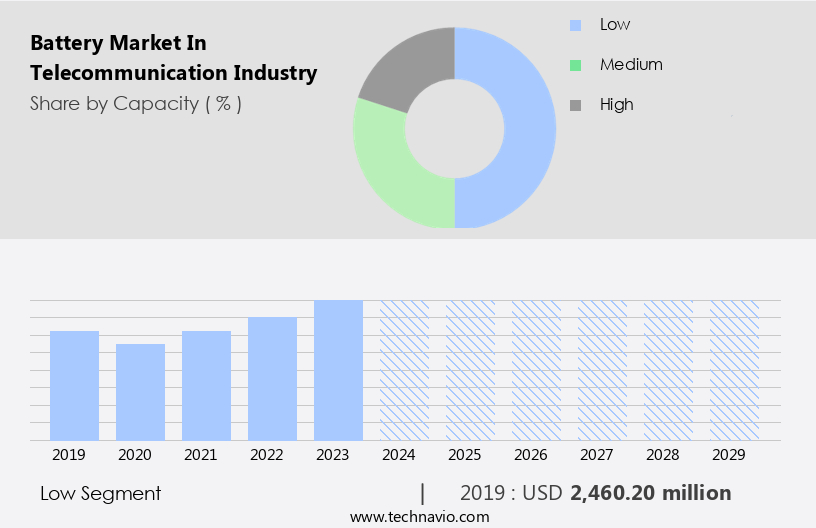
- Capacity
- Product
- Lead-acid battery
- Li-ion battery
- Others
- Application
- Base stations
- Backup power systems
- Data centers
- Small cells
- Mobile devices
- End-user
- Mobile network operators (MNOs)
- Internet service providers (ISPs)
- Data center operators
- Government/enterprises
- Technology
- Traditional
- Advanced
- Renewable integration
- Geography
- APAC
- Australia
- China
- India
- Japan
- South Korea
- North America
- Europe
- Middle East and Africa
- South America
By Capacity Insights
The low segment is estimated to witness significant growth during the forecast period. The low capacity battery segment, which includes rechargeable batteries with a lower charge capacity, primarily serves the market for portable electronic devices such as smartphones, laptops, and power banks. The increasing global demand for these devices, fueled by the expanding population and rural infrastructure projects, will drive the growth of this segment in the telecommunication industry market between 2025 and 2029. Furthermore, the accelerated development of telecommunication infrastructure and the expanding renewable energy sector will increase the demand for energy storage solutions, benefiting the low capacity battery segment. Lithium-ion batteries, a popular choice for portable electronics due to their high energy density and fast charging speed, dominate this segment.
Other battery types, including lead-acid, flow, nickel-metal hybrid, sodium-sulfur, zinc-manganese dioxide, and SLI batteries, also find applications in specific niches within the telecommunication industry. The global battery market in the telecommunication industry is expected to grow significantly due to the increasing demand for energy storage solutions in renewable energy projects, backup power solutions, and the automotive sector. The market is further driven by the need for sustainable transportation, grid storage, and consumer electronics, as well as the shift towards sustainable materials and ethical sourcing practices in battery production. Lithium-ion battery recycling and the development of solid-state and lithium-sulfur batteries are key areas of focus for future research and innovation.

Get a glance at the market report of share of various segments Request Free Sample
The low segment was valued at USD 2.46 billion in 2019 and showed a gradual increase during the forecast period.
Regional Analysis
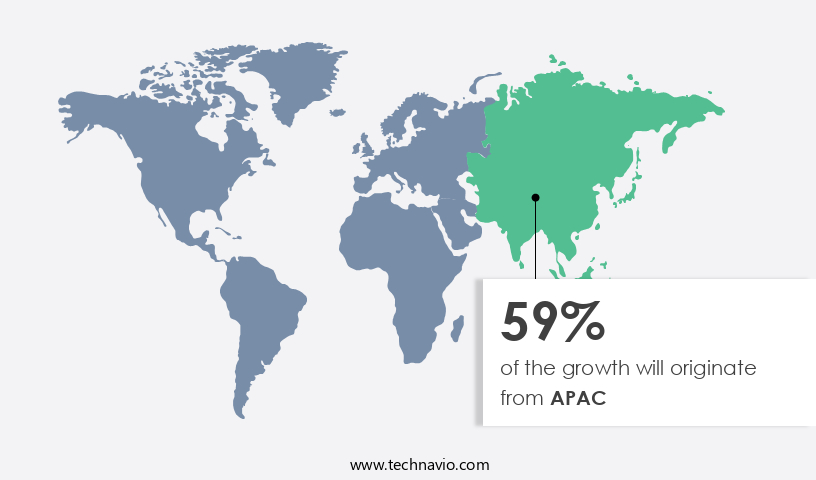
APAC is estimated to contribute 59% to the growth of the global market during the forecast period. Technavio's analysts have elaborately explained the regional trends and drivers that shape the market during the market forecast period.

For more insights on the market size of various regions, Request Free Sample
The telecommunication industry battery market in APAC is projected to experience substantial growth from 2025 to 2029, fueled by the expansion of 5G infrastructure and the rising demand for sustainable energy solutions. China, in particular, is anticipated to lead this growth, with a projected 5G user penetration rate surpassing 85% by 2027, according to the Global Times. The country aims to install 38 5G base stations per 10,000 residents by then, with 5G connections expected to account for 75% of mobile internet traffic. Furthermore, the number of IoT devices connected via 5G is projected to exceed 100 million. This growth is influenced by the increasing adoption of electric vehicles (EVs) and the integration of renewable energy infrastructure, including grid storage and sustainable transportation.
In addition, battery production capacity is expanding to meet the demands of these sectors, with lithium-ion batteries being the most commonly used due to their energy density and charging speed. Other battery types, such as lead-acid, flow, nickel-metal hybrid, sodium-sulfur, zinc-manganese dioxide, SLI, automotive, portable, industrial, power tools, electric vehicles, and primary and secondary batteries, are also in demand for various applications. The market is further driven by the need for backup power solutions, lithium-ion battery recycling, and the use of sustainable materials in battery production. The integration of smart homes, IoT devices, wireless networking, portable electronics, household electronic devices, and battery recycling also contributes to the market's growth.
Market Dynamics
Our researchers analyzed the data with 2024 as the base year, along with the key drivers, trends, and challenges. A holistic analysis of drivers will help companies refine their marketing strategies to gain a competitive advantage.
What are the key market drivers leading to the rise in the adoption of Battery In Telecommunication Industry Industry?
- Increase in power consumption is the key driver of the market. The global battery market in the telecommunication industry is experiencing significant growth due to the increasing energy demand driven by population growth and urbanization. This rise in power consumption has resulted in frequent power outages and heavy loads during peak hours in various countries. One of the primary reasons for these outages is the considerable loss of electricity during transmission and distribution from power plants.
- In response to this rising demand, Amara Raja Batteries announced plans to expand its manufacturing capacity in India to meet the increasing need for telecom batteries. This expansion underscores the importance of reliable battery solutions to mitigate power outages and ensure uninterrupted telecommunications services.
What are the market trends shaping the Battery In Telecommunication Industry Industry?
- Declining Li-ion battery prices is the upcoming market trend. The market has witnessed a significant shift towards the adoption of lithium-ion (Li-ion) batteries due to their advantages over traditional lead-acid batteries. One of the primary factors driving this trend is the continuous price reduction of Li-ion batteries. Over the past decade, Li-ion battery prices have dropped by approximately 80%, making them increasingly cost-competitive.
- Manufacturers, such as Panasonic and LG, are investing in technological advancements to further decrease costs and enhance battery performance. By January 2025, these companies aim to achieve year-over-year cost reductions. Li-ion batteries offer several advantages over lead-acid batteries, including higher energy density, longer lifespan, and faster charging capabilities. These benefits have made Li-ion batteries the preferred choice for telecommunication applications, contributing to their increasing market penetration.
What challenges does the Battery In Telecommunication Industry Industry face during its growth?
- The decline in diesel prices is a key challenge affecting the industry's growth. The market has experienced notable growth due to the cost-saving benefits of using battery systems in telecom towers. However, the market's expansion has been affected by the continuous decrease in diesel prices since 2012. This price decline has diminished the value proposition for switching to new power systems, resulting in extended payback periods.
- For instance, Exide Industries introduced a new line of lead-acid batteries in January 2025, designed to offer a cost-effective backup power solution for telecom towers. Despite this innovation, the ongoing decline in diesel prices remains a significant challenge for the market's growth. This trend underscores the importance of monitoring energy market dynamics to optimize the adoption of battery systems in the telecommunications industry.
Exclusive Customer Landscape
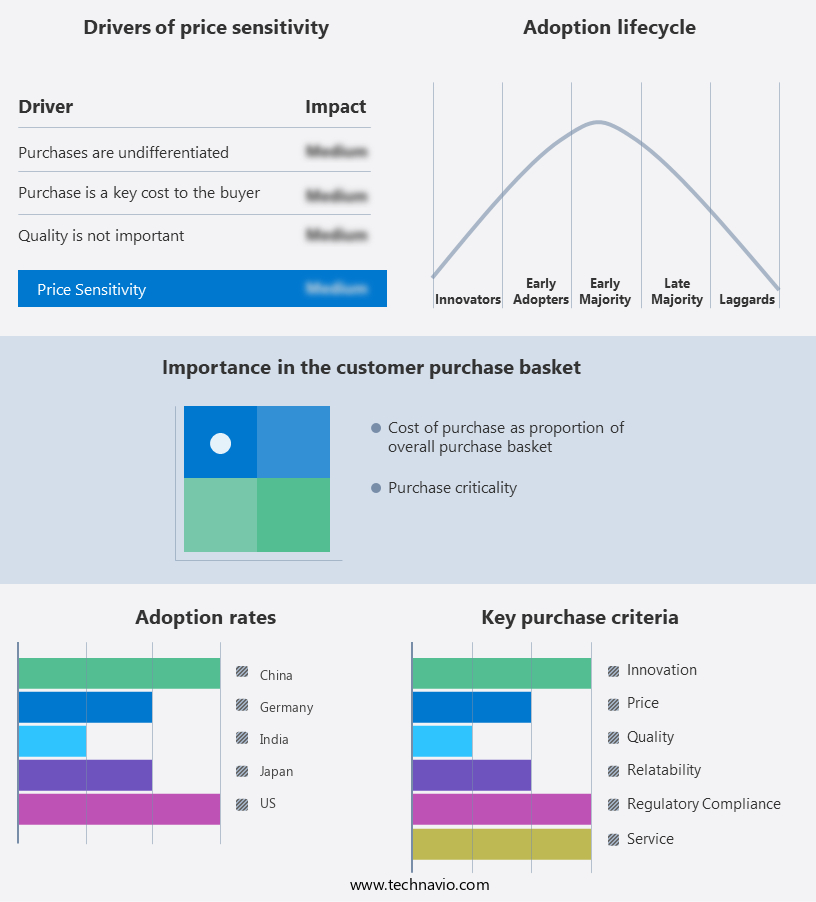
The market forecasting report includes the adoption lifecycle of the market, covering from the innovator's stage to the laggard's stage. It focuses on adoption rates in different regions based on penetration. Furthermore, the market report also includes key purchase criteria and drivers of price sensitivity to help companies evaluate and develop their market growth analysis strategies.

Customer Landscape
Key Companies & Market Insights
Companies are implementing various strategies, such as strategic alliances, battery market in telecommunication industry forecast, partnerships, mergers and acquisitions, geographical expansion, and product/service launches, to enhance their presence in the industry.
Accumulatorenwerke HOPPECKE Carl Zoellner and Sohn GmbH - The company offers Battery for telecommunications such as grid power VRM ,net power and grid power VM.
The market research and growth report includes detailed analyses of the competitive landscape of the market and information about key companies, including:
- Amara Raja Batteries Ltd.
- C and D Technologies Inc.
- East Penn Manufacturing Co. Inc.
- EnerSys
- Exide Industries Ltd.
- GS Yuasa International Ltd.
- HBL Power Systems Ltd.
- Kabra Extrusiontechnik Ltd.
- Leoch International Technology Ltd.
- LG Corp.
- Panasonic Holdings Corp.
- Star Battery Ltd.
- Victron Energy BV
- Zhejiang Narada Power Source Co. Ltd.
Qualitative and quantitative analysis of companies has been conducted to help clients understand the wider business environment as well as the strengths and weaknesses of key industry players. Data is qualitatively analyzed to categorize companies as pure play, category-focused, industry-focused, and diversified; it is quantitatively analyzed to categorize companies as dominant, leading, strong, tentative, and weak.
Research Analyst Overview
The market has grown significantly in recent years, driven by the increasing demand for sustainable transportation, renewable energy infrastructure, and the proliferation of consumer electronics. This trend is expected to continue as the world transitions towards more sustainable energy sources and decreases its carbon emissions. Batteries play a crucial role in various applications within the telecommunication sector. In the realm of transportation, the adoption of electric vehicles (EVs) is on the rise, leading to an increased demand for high-performance batteries. These batteries must offer a long lifespan, high energy density, and fast charging speeds to meet the needs of consumers and businesses.
In the context of renewable energy, batteries serve as essential energy storage solutions for intermittent sources such as solar and wind power. They help maintain a consistent power supply and ensure the stability of the grid. The most commonly used batteries for this purpose are lithium-ion batteries, flow batteries, nickel-metal hydride batteries, sodium-sulfur batteries, zinc-manganese dioxide batteries, and lead-acid batteries. The telecommunication industry's battery market is diverse, with applications ranging from automotive and industrial sectors to portable electronics and smart homes. Automotive batteries require high energy density and long lifespan, while industrial batteries must be strong and able to withstand heavy usage.
Portable batteries, on the other hand, prioritize compact size and lightweight design. The demand for batteries is not limited to the telecommunication industry alone. The growing popularity of renewable energy projects and backup power solutions has led to a rise in battery production capacity. This trend is expected to continue as the world moves towards more sustainable energy sources and decreases its reliance on fossil fuels. Battery chemistries continue to evolve, with solid-state batteries and lithium-sulfur batteries gaining significant attention due to their high energy density and potential for longer battery life. However, the production and recycling of these batteries pose unique challenges that must be addressed to ensure their widespread adoption.
In addition, transportation demand for energy-efficient batteries is driving innovations, including flow batteries, nickel-metal hybrid batteries, sodium-sulfur batteries, and zinc-manganese dioxide batteries. These technologies are vital for telecom power systems, supporting network infrastructure and managing data usage and signal strength. Battery applications, such as power tool batteries and electric vehicle batteries, are seeing increased adoption. Furthermore, supply chain sustainability and recycling methods are becoming critical in reducing costs. The rise in battery demand is also influencing lithium prices, impacting primary batteries like alkaline batteries. With a focus on economic activity and battery technology, cost reduction efforts are key to sustaining growth in the telecom sector.
Market Scope
|
Report Coverage
|
Details
|
Page number
|
266
|
Base year
|
2024
|
Historic period
|
2019-2023 |
Forecast period
|
2025-2029
|
Growth momentum & CAGR
|
Accelerate at a CAGR of 15.2%
|
Market Growth 2025-2029
|
USD 7.34 billion
|
Market structure
|
Fragmented
|
YoY growth 2024-2025(%)
|
14.5
|
Key countries
|
US, China, India, Japan, Germany, UK, Canada, South Korea, France, and Australia
|
Competitive landscape
|
Leading Companies, Market Positioning of Companies, Competitive Strategies, and Industry Risks
|
Request Free Sample
What are the Key Data Covered in this Battery Market In Telecommunication Industry Research and Growth Report?
- CAGR of the Battery In Telecommunication Industry industry during the forecast period
- Detailed information on factors that will drive the market growth and forecasting between 2025 and 2029
- Precise estimation of the size of the market and its contribution of the industry in focus to the parent market
- Accurate predictions about upcoming growth and trends and changes in consumer behaviour
- Growth of the market across APAC, North America, Europe, Middle East and Africa, and South America
- Thorough analysis of the market's competitive landscape and detailed information about companies
- Comprehensive analysis of factors that will challenge the battery market in telecommunication industry growth of industry companies
We can help! Our analysts can customize this battery market in telecommunication industry research report to meet your requirements.
Get in touch
1 Executive Summary
- 1.1 Market overview
- Executive Summary - Chart on Market Overview
- Executive Summary - Data Table on Market Overview
- Executive Summary - Chart on Global Market Characteristics
- Executive Summary - Chart on Market by Geography
- Executive Summary - Chart on Market Segmentation by Capacity
- Executive Summary - Chart on Market Segmentation by Product
- Executive Summary - Chart on Market Segmentation by Application
- Executive Summary - Chart on Market Segmentation by End-user
- Executive Summary - Chart on Market Segmentation by Technology
- Executive Summary - Chart on Incremental Growth
- Executive Summary - Data Table on Incremental Growth
- Executive Summary - Chart on Company Market Positioning
2 Technavio Analysis
- 2.1 Analysis of price sensitivity, lifecycle, customer purchase basket, adoption rates, and purchase criteria
- Analysis of price sensitivity, lifecycle, customer purchase basket, adoption rates, and purchase criteria
- 2.2 Criticality of inputs and Factors of differentiation
- Overview on criticality of inputs and factors of differentiation
- 2.3 Factors of disruption
- Overview on factors of disruption
- 2.4 Impact of drivers and challenges
- Impact of drivers and challenges in 2024 and 2029
3 Market Landscape
- 3.1 Market ecosystem
- Parent Market
- Data Table on - Parent Market
- 3.2 Market characteristics
- Market characteristics analysis
4 Market Sizing
- 4.1 Market definition
- Offerings of companies included in the market definition
- 4.2 Market segment analysis
- 4.4 Market outlook: Forecast for 2024-2029
- Chart on Global - Market size and forecast 2024-2029 ($ million)
- Data Table on Global - Market size and forecast 2024-2029 ($ million)
- Chart on Global Market: Year-over-year growth 2024-2029 (%)
- Data Table on Global Market: Year-over-year growth 2024-2029 (%)
5 Historic Market Size
- 5.1 Global Battery Market In Telecommunication Industry 2019 - 2023
- Historic Market Size - Data Table on Global Battery Market In Telecommunication Industry 2019 - 2023 ($ million)
- 5.2 Capacity segment analysis 2019 - 2023
- Historic Market Size - Capacity Segment 2019 - 2023 ($ million)
- 5.3 Product segment analysis 2019 - 2023
- Historic Market Size - Product Segment 2019 - 2023 ($ million)
- 5.4 Application segment analysis 2019 - 2023
- Historic Market Size - Application Segment 2019 - 2023 ($ million)
- 5.5 End-user segment analysis 2019 - 2023
- Historic Market Size - End-user Segment 2019 - 2023 ($ million)
- 5.6 Technology segment analysis 2019 - 2023
- Historic Market Size - Technology Segment 2019 - 2023 ($ million)
- 5.7 Geography segment analysis 2019 - 2023
- Historic Market Size - Geography Segment 2019 - 2023 ($ million)
- 5.8 Country segment analysis 2019 - 2023
- Historic Market Size - Country Segment 2019 - 2023 ($ million)
6 Qualitative Analysis
- 6.1 Impact of AI in global battery market for the telecommunication industry
7 Five Forces Analysis
- 7.1 Five forces summary
- Five forces analysis - Comparison between 2024 and 2029
- 7.2 Bargaining power of buyers
- Bargaining power of buyers - Impact of key factors 2024 and 2029
- 7.3 Bargaining power of suppliers
- Bargaining power of suppliers - Impact of key factors in 2024 and 2029
- 7.4 Threat of new entrants
- Threat of new entrants - Impact of key factors in 2024 and 2029
- 7.5 Threat of substitutes
- Threat of substitutes - Impact of key factors in 2024 and 2029
- 7.6 Threat of rivalry
- Threat of rivalry - Impact of key factors in 2024 and 2029
- 7.7 Market condition
- Chart on Market condition - Five forces 2024 and 2029
8 Market Segmentation by Capacity
- 8.1 Market segments
- Chart on Capacity - Market share 2024-2029 (%)
- Data Table on Capacity - Market share 2024-2029 (%)
- 8.2 Comparison by Capacity
- Chart on Comparison by Capacity
- Data Table on Comparison by Capacity
- 8.3 Low - Market size and forecast 2024-2029
- Chart on Low - Market size and forecast 2024-2029 ($ million)
- Data Table on Low - Market size and forecast 2024-2029 ($ million)
- Chart on Low - Year-over-year growth 2024-2029 (%)
- Data Table on Low - Year-over-year growth 2024-2029 (%)
- 8.4 Medium - Market size and forecast 2024-2029
- Chart on Medium - Market size and forecast 2024-2029 ($ million)
- Data Table on Medium - Market size and forecast 2024-2029 ($ million)
- Chart on Medium - Year-over-year growth 2024-2029 (%)
- Data Table on Medium - Year-over-year growth 2024-2029 (%)
- 8.5 High - Market size and forecast 2024-2029
- Chart on High - Market size and forecast 2024-2029 ($ million)
- Data Table on High - Market size and forecast 2024-2029 ($ million)
- Chart on High - Year-over-year growth 2024-2029 (%)
- Data Table on High - Year-over-year growth 2024-2029 (%)
- 8.6 Market opportunity by Capacity
- Market opportunity by Capacity ($ million)
- Data Table on Market opportunity by Capacity ($ million)
9 Market Segmentation by Product
- 9.1 Market segments
- Chart on Product - Market share 2024-2029 (%)
- Data Table on Product - Market share 2024-2029 (%)
- 9.2 Comparison by Product
- Chart on Comparison by Product
- Data Table on Comparison by Product
- 9.3 Lead-acid battery - Market size and forecast 2024-2029
- Chart on Lead-acid battery - Market size and forecast 2024-2029 ($ million)
- Data Table on Lead-acid battery - Market size and forecast 2024-2029 ($ million)
- Chart on Lead-acid battery - Year-over-year growth 2024-2029 (%)
- Data Table on Lead-acid battery - Year-over-year growth 2024-2029 (%)
- 9.4 Li-ion battery - Market size and forecast 2024-2029
- Chart on Li-ion battery - Market size and forecast 2024-2029 ($ million)
- Data Table on Li-ion battery - Market size and forecast 2024-2029 ($ million)
- Chart on Li-ion battery - Year-over-year growth 2024-2029 (%)
- Data Table on Li-ion battery - Year-over-year growth 2024-2029 (%)
- 9.5 Others - Market size and forecast 2024-2029
- Chart on Others - Market size and forecast 2024-2029 ($ million)
- Data Table on Others - Market size and forecast 2024-2029 ($ million)
- Chart on Others - Year-over-year growth 2024-2029 (%)
- Data Table on Others - Year-over-year growth 2024-2029 (%)
- 9.6 Market opportunity by Product
- Market opportunity by Product ($ million)
- Data Table on Market opportunity by Product ($ million)
10 Market Segmentation by Application
- 10.1 Market segments
- Chart on Application - Market share 2024-2029 (%)
- Data Table on Application - Market share 2024-2029 (%)
- 10.2 Comparison by Application
- Chart on Comparison by Application
- Data Table on Comparison by Application
- 10.3 Base stations - Market size and forecast 2024-2029
- Chart on Base stations - Market size and forecast 2024-2029 ($ million)
- Data Table on Base stations - Market size and forecast 2024-2029 ($ million)
- Chart on Base stations - Year-over-year growth 2024-2029 (%)
- Data Table on Base stations - Year-over-year growth 2024-2029 (%)
- 10.4 Backup power systems - Market size and forecast 2024-2029
- Chart on Backup power systems - Market size and forecast 2024-2029 ($ million)
- Data Table on Backup power systems - Market size and forecast 2024-2029 ($ million)
- Chart on Backup power systems - Year-over-year growth 2024-2029 (%)
- Data Table on Backup power systems - Year-over-year growth 2024-2029 (%)
- 10.5 Data centers - Market size and forecast 2024-2029
- Chart on Data centers - Market size and forecast 2024-2029 ($ million)
- Data Table on Data centers - Market size and forecast 2024-2029 ($ million)
- Chart on Data centers - Year-over-year growth 2024-2029 (%)
- Data Table on Data centers - Year-over-year growth 2024-2029 (%)
- 10.6 Small cells - Market size and forecast 2024-2029
- Chart on Small cells - Market size and forecast 2024-2029 ($ million)
- Data Table on Small cells - Market size and forecast 2024-2029 ($ million)
- Chart on Small cells - Year-over-year growth 2024-2029 (%)
- Data Table on Small cells - Year-over-year growth 2024-2029 (%)
- 10.7 Mobile devices - Market size and forecast 2024-2029
- Chart on Mobile devices - Market size and forecast 2024-2029 ($ million)
- Data Table on Mobile devices - Market size and forecast 2024-2029 ($ million)
- Chart on Mobile devices - Year-over-year growth 2024-2029 (%)
- Data Table on Mobile devices - Year-over-year growth 2024-2029 (%)
- 10.8 Market opportunity by Application
- Market opportunity by Application ($ million)
- Data Table on Market opportunity by Application ($ million)
11 Market Segmentation by End-user
- 11.1 Market segments
- Chart on End-user - Market share 2024-2029 (%)
- Data Table on End-user - Market share 2024-2029 (%)
- 11.2 Comparison by End-user
- Chart on Comparison by End-user
- Data Table on Comparison by End-user
- 11.3 Mobile network operators (MNOs) - Market size and forecast 2024-2029
- Chart on Mobile network operators (MNOs) - Market size and forecast 2024-2029 ($ million)
- Data Table on Mobile network operators (MNOs) - Market size and forecast 2024-2029 ($ million)
- Chart on Mobile network operators (MNOs) - Year-over-year growth 2024-2029 (%)
- Data Table on Mobile network operators (MNOs) - Year-over-year growth 2024-2029 (%)
- 11.4 Internet service providers (ISPs) - Market size and forecast 2024-2029
- Chart on Internet service providers (ISPs) - Market size and forecast 2024-2029 ($ million)
- Data Table on Internet service providers (ISPs) - Market size and forecast 2024-2029 ($ million)
- Chart on Internet service providers (ISPs) - Year-over-year growth 2024-2029 (%)
- Data Table on Internet service providers (ISPs) - Year-over-year growth 2024-2029 (%)
- 11.5 Data center operators - Market size and forecast 2024-2029
- Chart on Data center operators - Market size and forecast 2024-2029 ($ million)
- Data Table on Data center operators - Market size and forecast 2024-2029 ($ million)
- Chart on Data center operators - Year-over-year growth 2024-2029 (%)
- Data Table on Data center operators - Year-over-year growth 2024-2029 (%)
- 11.6 Government/enterprises - Market size and forecast 2024-2029
- Chart on Government/enterprises - Market size and forecast 2024-2029 ($ million)
- Data Table on Government/enterprises - Market size and forecast 2024-2029 ($ million)
- Chart on Government/enterprises - Year-over-year growth 2024-2029 (%)
- Data Table on Government/enterprises - Year-over-year growth 2024-2029 (%)
- 11.7 Market opportunity by End-user
- Market opportunity by End-user ($ million)
- Data Table on Market opportunity by End-user ($ million)
12 Market Segmentation by Technology
- 12.1 Market segments
- Chart on Technology - Market share 2024-2029 (%)
- Data Table on Technology - Market share 2024-2029 (%)
- 12.2 Comparison by Technology
- Chart on Comparison by Technology
- Data Table on Comparison by Technology
- 12.3 Traditional - Market size and forecast 2024-2029
- Chart on Traditional - Market size and forecast 2024-2029 ($ million)
- Data Table on Traditional - Market size and forecast 2024-2029 ($ million)
- Chart on Traditional - Year-over-year growth 2024-2029 (%)
- Data Table on Traditional - Year-over-year growth 2024-2029 (%)
- 12.4 Advanced - Market size and forecast 2024-2029
- Chart on Advanced - Market size and forecast 2024-2029 ($ million)
- Data Table on Advanced - Market size and forecast 2024-2029 ($ million)
- Chart on Advanced - Year-over-year growth 2024-2029 (%)
- Data Table on Advanced - Year-over-year growth 2024-2029 (%)
- 12.5 Renewable integration - Market size and forecast 2024-2029
- Chart on Renewable integration - Market size and forecast 2024-2029 ($ million)
- Data Table on Renewable integration - Market size and forecast 2024-2029 ($ million)
- Chart on Renewable integration - Year-over-year growth 2024-2029 (%)
- Data Table on Renewable integration - Year-over-year growth 2024-2029 (%)
- 12.6 Market opportunity by Technology
- Market opportunity by Technology ($ million)
- Data Table on Market opportunity by Technology ($ million)
13 Customer Landscape
- 13.1 Customer landscape overview
- Analysis of price sensitivity, lifecycle, customer purchase basket, adoption rates, and purchase criteria
14 Geographic Landscape
- 14.1 Geographic segmentation
- Chart on Market share by geography 2024-2029 (%)
- Data Table on Market share by geography 2024-2029 (%)
- 14.2 Geographic comparison
- Chart on Geographic comparison
- Data Table on Geographic comparison
- 14.3 APAC - Market size and forecast 2024-2029
- Chart on APAC - Market size and forecast 2024-2029 ($ million)
- Data Table on APAC - Market size and forecast 2024-2029 ($ million)
- Chart on APAC - Year-over-year growth 2024-2029 (%)
- Data Table on APAC - Year-over-year growth 2024-2029 (%)
- 14.4 North America - Market size and forecast 2024-2029
- Chart on North America - Market size and forecast 2024-2029 ($ million)
- Data Table on North America - Market size and forecast 2024-2029 ($ million)
- Chart on North America - Year-over-year growth 2024-2029 (%)
- Data Table on North America - Year-over-year growth 2024-2029 (%)
- 14.5 Europe - Market size and forecast 2024-2029
- Chart on Europe - Market size and forecast 2024-2029 ($ million)
- Data Table on Europe - Market size and forecast 2024-2029 ($ million)
- Chart on Europe - Year-over-year growth 2024-2029 (%)
- Data Table on Europe - Year-over-year growth 2024-2029 (%)
- 14.6 Middle East and Africa - Market size and forecast 2024-2029
- Chart on Middle East and Africa - Market size and forecast 2024-2029 ($ million)
- Data Table on Middle East and Africa - Market size and forecast 2024-2029 ($ million)
- Chart on Middle East and Africa - Year-over-year growth 2024-2029 (%)
- Data Table on Middle East and Africa - Year-over-year growth 2024-2029 (%)
- 14.7 South America - Market size and forecast 2024-2029
- Chart on South America - Market size and forecast 2024-2029 ($ million)
- Data Table on South America - Market size and forecast 2024-2029 ($ million)
- Chart on South America - Year-over-year growth 2024-2029 (%)
- Data Table on South America - Year-over-year growth 2024-2029 (%)
- 14.8 China - Market size and forecast 2024-2029
- Chart on China - Market size and forecast 2024-2029 ($ million)
- Data Table on China - Market size and forecast 2024-2029 ($ million)
- Chart on China - Year-over-year growth 2024-2029 (%)
- Data Table on China - Year-over-year growth 2024-2029 (%)
- 14.9 US - Market size and forecast 2024-2029
- Chart on US - Market size and forecast 2024-2029 ($ million)
- Data Table on US - Market size and forecast 2024-2029 ($ million)
- Chart on US - Year-over-year growth 2024-2029 (%)
- Data Table on US - Year-over-year growth 2024-2029 (%)
- 14.10 India - Market size and forecast 2024-2029
- Chart on India - Market size and forecast 2024-2029 ($ million)
- Data Table on India - Market size and forecast 2024-2029 ($ million)
- Chart on India - Year-over-year growth 2024-2029 (%)
- Data Table on India - Year-over-year growth 2024-2029 (%)
- 14.11 Japan - Market size and forecast 2024-2029
- Chart on Japan - Market size and forecast 2024-2029 ($ million)
- Data Table on Japan - Market size and forecast 2024-2029 ($ million)
- Chart on Japan - Year-over-year growth 2024-2029 (%)
- Data Table on Japan - Year-over-year growth 2024-2029 (%)
- 14.12 South Korea - Market size and forecast 2024-2029
- Chart on South Korea - Market size and forecast 2024-2029 ($ million)
- Data Table on South Korea - Market size and forecast 2024-2029 ($ million)
- Chart on South Korea - Year-over-year growth 2024-2029 (%)
- Data Table on South Korea - Year-over-year growth 2024-2029 (%)
- 14.13 Germany - Market size and forecast 2024-2029
- Chart on Germany - Market size and forecast 2024-2029 ($ million)
- Data Table on Germany - Market size and forecast 2024-2029 ($ million)
- Chart on Germany - Year-over-year growth 2024-2029 (%)
- Data Table on Germany - Year-over-year growth 2024-2029 (%)
- 14.14 UK - Market size and forecast 2024-2029
- Chart on UK - Market size and forecast 2024-2029 ($ million)
- Data Table on UK - Market size and forecast 2024-2029 ($ million)
- Chart on UK - Year-over-year growth 2024-2029 (%)
- Data Table on UK - Year-over-year growth 2024-2029 (%)
- 14.15 Canada - Market size and forecast 2024-2029
- Chart on Canada - Market size and forecast 2024-2029 ($ million)
- Data Table on Canada - Market size and forecast 2024-2029 ($ million)
- Chart on Canada - Year-over-year growth 2024-2029 (%)
- Data Table on Canada - Year-over-year growth 2024-2029 (%)
- 14.16 Australia - Market size and forecast 2024-2029
- Chart on Australia - Market size and forecast 2024-2029 ($ million)
- Data Table on Australia - Market size and forecast 2024-2029 ($ million)
- Chart on Australia - Year-over-year growth 2024-2029 (%)
- Data Table on Australia - Year-over-year growth 2024-2029 (%)
- 14.17 France - Market size and forecast 2024-2029
- Chart on France - Market size and forecast 2024-2029 ($ million)
- Data Table on France - Market size and forecast 2024-2029 ($ million)
- Chart on France - Year-over-year growth 2024-2029 (%)
- Data Table on France - Year-over-year growth 2024-2029 (%)
- 14.18 Market opportunity by geography
- Market opportunity by geography ($ million)
- Data Tables on Market opportunity by geography ($ million)
15 Drivers, Challenges, and Opportunity/Restraints
- 15.3 Impact of drivers and challenges
- Impact of drivers and challenges in 2024 and 2029
- 15.4 Market opportunities/restraints
16 Competitive Landscape
- 16.2 Competitive Landscape
- Overview on criticality of inputs and factors of differentiation
- 16.3 Landscape disruption
- Overview on factors of disruption
- 16.4 Industry risks
- Impact of key risks on business
17 Competitive Analysis
- 17.2 Company ranking index
- 17.3 Market positioning of companies
- Matrix on companies position and classification
- 17.4 Accumulatorenwerke HOPPECKE Carl Zoellner and Sohn GmbH
- Accumulatorenwerke HOPPECKE Carl Zoellner and Sohn GmbH - Overview
- Accumulatorenwerke HOPPECKE Carl Zoellner and Sohn GmbH - Product / Service
- Accumulatorenwerke HOPPECKE Carl Zoellner and Sohn GmbH - Key offerings
- SWOT
- 17.5 Amara Raja Batteries Ltd.
- Amara Raja Batteries Ltd. - Overview
- Amara Raja Batteries Ltd. - Product / Service
- Amara Raja Batteries Ltd. - Key offerings
- SWOT
- 17.6 C and D Technologies Inc.
- C and D Technologies Inc. - Overview
- C and D Technologies Inc. - Product / Service
- C and D Technologies Inc. - Key offerings
- SWOT
- 17.7 East Penn Manufacturing Co. Inc.
- East Penn Manufacturing Co. Inc. - Overview
- East Penn Manufacturing Co. Inc. - Product / Service
- East Penn Manufacturing Co. Inc. - Key news
- East Penn Manufacturing Co. Inc. - Key offerings
- SWOT
- 17.8 EnerSys
- EnerSys - Overview
- EnerSys - Business segments
- EnerSys - Key news
- EnerSys - Key offerings
- EnerSys - Segment focus
- SWOT
- 17.9 Exide Industries Ltd.
- Exide Industries Ltd. - Overview
- Exide Industries Ltd. - Product / Service
- Exide Industries Ltd. - Key news
- Exide Industries Ltd. - Key offerings
- SWOT
- 17.10 GS Yuasa International Ltd.
- GS Yuasa International Ltd. - Overview
- GS Yuasa International Ltd. - Business segments
- GS Yuasa International Ltd. - Key news
- GS Yuasa International Ltd. - Key offerings
- GS Yuasa International Ltd. - Segment focus
- SWOT
- 17.11 HBL Power Systems Ltd.
- HBL Power Systems Ltd. - Overview
- HBL Power Systems Ltd. - Business segments
- HBL Power Systems Ltd. - Key offerings
- HBL Power Systems Ltd. - Segment focus
- SWOT
- 17.12 Kabra Extrusiontechnik Ltd.
- Kabra Extrusiontechnik Ltd. - Overview
- Kabra Extrusiontechnik Ltd. - Product / Service
- Kabra Extrusiontechnik Ltd. - Key offerings
- SWOT
- 17.13 Leoch International Technology Ltd.
- Leoch International Technology Ltd. - Overview
- Leoch International Technology Ltd. - Product / Service
- Leoch International Technology Ltd. - Key offerings
- SWOT
- 17.14 LG Corp.
- LG Corp. - Overview
- LG Corp. - Product / Service
- LG Corp. - Key offerings
- SWOT
- 17.15 Panasonic Holdings Corp.
- Panasonic Holdings Corp. - Overview
- Panasonic Holdings Corp. - Business segments
- Panasonic Holdings Corp. - Key news
- Panasonic Holdings Corp. - Key offerings
- Panasonic Holdings Corp. - Segment focus
- SWOT
- 17.16 Star Battery Ltd.
- Star Battery Ltd. - Overview
- Star Battery Ltd. - Product / Service
- Star Battery Ltd. - Key offerings
- SWOT
- 17.17 Victron Energy BV
- Victron Energy BV - Overview
- Victron Energy BV - Product / Service
- Victron Energy BV - Key offerings
- SWOT
- 17.18 Zhejiang Narada Power Source Co. Ltd.
- Zhejiang Narada Power Source Co. Ltd. - Overview
- Zhejiang Narada Power Source Co. Ltd. - Business segments
- Zhejiang Narada Power Source Co. Ltd. - Key offerings
- Zhejiang Narada Power Source Co. Ltd. - Segment focus
- SWOT
18 Appendix
- 18.2 Inclusions and exclusions checklist
- Inclusions checklist
- Exclusions checklist
- 18.3 Currency conversion rates for US$
- Currency conversion rates for US$
- 18.4 Research methodology
- 18.7 Validation techniques employed for market sizing
- Validation techniques employed for market sizing
- 18.9 360 degree market analysis
- 360 degree market analysis
- 18.10 List of abbreviations