Beryllium Market Analysis North America, APAC, Europe, Middle East and Africa, South America - US, China, India, Russia, Brazil - Size and Forecast 2024-2028

Beryllium Market Analysis North America, APAC, Europe, Middle East and Africa, South America - US, China, India, Russia, Brazil - Size and Forecast 2024-2028

Published: Feb 2024 153 Pages SKU: IRTNTR77538

Market Overview at a Glance

$68.54 Mn
Market Opportunity
2.94%
CAGR
2.66
YoY growth 2023-2024(%)

Beryllium Market Size 2024-2028 

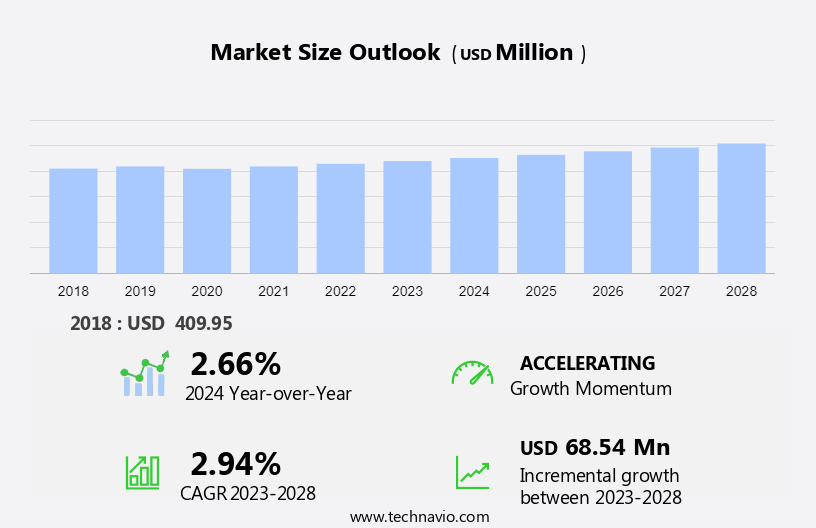
The beryllium market size is forecast to increase by USD 68.54 billion at a CAGR of 2.94% between 2023 and 2028. The market is driven by the significant demand for beryllium in the production of precision instruments, particularly in the aerospace and defense industries. This demand is fueled by the material's unique properties, including its high strength-to-weight ratio and excellent thermal conductivity. However, challenges in the market include the easy availability of substitutes for beryllium hydrochloride, such as beryllium aluminum silicate and beryllium silicate, derived from minerals like phenakite and chrysoberyl. Commercial ores of beryllium are primarily found in the United States, China, and Russia. Market growth may also be influenced by the increasing preference for lightweight materials in various industries, including automotive and telecommunications.

Beryllium Market Size

 Request Free Sample

Beryllium is a steel-gray, light, and brittle metal naturally found in the earth's crust. Its chemical symbol is Be, and it is a relatively rare element, making up only 0.0001-0.0005% of the earth's crust. Beryllium is not found in its free state but is primarily extracted from minerals. Beryllium is known for its unique chemical properties, making it a valuable component in various industries. It is a lightweight metal with a high melting point and excellent thermal conductivity. Beryllium is also highly resistant to corrosion and has a low coefficient of thermal expansion.

Furthermore, beryllium is chemically similar to aluminum and shares some of its properties. However, beryllium is more brittle and has a lower density. Beryllium is found in various minerals, including beryl, emerald (green variety), phenakite, and chrysoberyl. The primary commercial ores of beryllium are beryl and beryllium silicate. Beryllium is extracted from these minerals through a process that involves crushing and grinding the ore, followed by heating it in the presence of oxygen to form beryllium oxide. The oxide is then dissolved in concentrated nitric acid to produce beryllium nitrate, which is further processed to obtain pure beryllium. Beryllium is used in various applications due to its unique properties.

Moreover, it is used in the aerospace industry as a structural material due to its high strength-to-weight ratio and excellent thermal properties. Beryllium is also used in the nuclear industry as a moderator in nuclear reactors due to its ability to slow down neutrons. Beryllium is also used in the electronics industry as a component in high-frequency transistors and in the production of beryllium oxide, which is used as a catalyst in the production of certain chemicals. Beryllium hydroxide is used in the pharmaceutical industry as a medication for certain respiratory diseases. Beryllium is a relatively rare element, with the largest producers being China, Russia, and the United States.

Market Segmentation

The market research report provides comprehensive data (region-wise segment analysis), with forecasts and estimates in "USD million" for the period 2024-2028, as well as historical data from 2018-2022 for the following segments.

  • End-user
    • Automotive
    • Healthcare
    • Aerospace and defense
    • Others
  • Type
    • Alloys
    • Metals
    • Ceramics
  • Geography
    • North America
      • US
    • APAC
      • China
      • India
    • Europe
    • Middle East and Africa
    • South America
      • Brazil

By End-user Insights

The automotive segment is estimated to witness significant growth during the forecast period. Beryllium is a lightweight and strong metal that is increasingly used in the automotive industry due to its superior properties. This element is known for its high thermal conductivity, making it an effective material for enhancing the performance of automotive components. The process of extracting beryllium involves oxidizing it with oxygen, followed by a reaction with concentrated nitric acid. Beryllium oxide, the resulting compound, is then used to produce beryllium alloys. These alloys are valued for their exceptional strength, durability, and ability to withstand high temperatures without degrading. In the automotive sector, beryllium is employed in various applications, including engine components and exhaust systems, where its corrosion resistance is particularly beneficial.

Furthermore, the use of beryllium in automotive manufacturing contributes to reduced vehicle weight, which in turn leads to improved fuel efficiency and enhanced performance. Its high thermal conductivity also ensures that automotive components remain cool under extreme operating conditions, contributing to overall safety and reliability. Beryllium's exceptional properties make it an indispensable material in the automotive industry. Its ability to enhance the structural integrity of parts while reducing weight is a significant factor in the development of more efficient and effective vehicles. Additionally, its resistance to corrosion helps to extend the lifespan of automotive components and reduce maintenance costs.

Beryllium Market Size

Get a glance at the market share of various segments Request Free Sample

The automotive segment was valued at USD 154.55 million in 2018 and showed a gradual increase during the forecast period.

Regional Insights

North America is estimated to contribute 51% to the growth of the global market during the forecast period. Technavio's analysts have elaborately explained the regional trends and drivers that shape the market during the forecast period.

Beryllium Market Share by Geography

For more insights on the market share of various regions Request Free Sample

In North America, the aerospace and defense industries are major consumers of beryllium alloys due to their desirable properties, such as high strength and dimensional stability. These industries require lightweight materials to reduce fuel consumption and improve overall performance. Beryllium's unique characteristics make it an ideal choice for aerospace applications, including aircraft structures, satellite components, and defense equipment. Additionally, the medical device sector in North America utilizes beryllium alloys for specialized equipment due to their lightweight, high strength, and biocompatibility properties. Furthermore, the region's electronics industry relies on beryllium-copper alloys for their superior electrical and thermal conductivity, as well as corrosion resistance. Furthermore, the increasing investments in modernization projects for these industries will likely boost the demand for beryllium alloys in North America.

Our researchers analyzed the data with 2023 as the base year, along with the key drivers, trends, and challenges. A holistic analysis of drivers will help companies refine their marketing strategies to gain a competitive advantage.

Market Driver

High demand for beryllium in precision instruments is the key driver of the market. Beryllium, a steel-gray metal with brittle nature, is renowned for its unique chemical properties at room temperature. Its minimal thermal expansion ensures that precision instruments retain their dimensions, crucial for accurate measurements and optimal optical performance. The metal's exceptional stiffness and lightweight quality enable precision instruments to maintain structural integrity while minimizing weight, leading to enhanced precision and improved performance.

Furthermore, beryllium's non-magnetic property makes it an ideal choice for applications where magnetic interference could negatively impact performance or accuracy, such as magnetic resonance imaging (MRI) machines, electron microscopes, and magnetic sensors. Lastly, beryllium's excellent thermal conductivity facilitates efficient heat dissipation in precision instruments. This metal's desirable properties make it a valuable component in various industries, including aerospace, defense, and healthcare.

Market Trends

Rising preference for lightweight materials is the upcoming trend in the market. The United States is home to several significant producers of beryllium, a lightweight and strong mineral used extensively in the aerospace and defense industries. Beryllium is primarily found in minerals such as beryllium aluminum silicate and beryllium silicate, with notable finds including phenakite and chrysoberyl. Commercial ores of beryllium are mined and processed to extract beryllium hydroxide, which is then further refined into various forms for industrial applications. Given the importance of weight reduction and enhanced performance in the aerospace and defense sectors, beryllium-containing materials have gained significant traction. These materials are increasingly utilized in aerospace for manufacturing lightweight, high-strength components, such as connectors and fasteners, thereby contributing to improved aircraft performance and fuel efficiency.

Simultaneously, the automotive industry is witnessing a growing demand for beryllium-containing alloys due to their superior properties. Automakers are focusing on meeting stringent fuel efficiency standards and enhancing vehicle performance, leading to the adoption of these alloys in components like brake rotors, pistons, and structural parts. In summary, the increasing demand for lightweight, high-performance materials across the aerospace and defense, as well as automotive industries, is driving the growth of the market in the United States. The use of beryllium-containing materials in components such as connectors, fasteners, brake rotors, pistons, and structural parts is expected to continue, underpinning the market's expansion.

Market Challenge

The easy availability of substitutes for beryllium is a key challenge affecting the market growth. Beryllium, an element with distinctive properties, is extensively utilized in various industries due to its high strength-to-weight ratio and other desirable characteristics. However, alternatives exist for certain beryllium-based materials. In applications where lightweight and strong materials are essential, aluminum alloys serve as viable substitutes. Although they do not exactly replicate beryllium's specific strength-to-weight ratio, aluminum alloys are more accessible, cost-effective, and safer to handle. In specific aerospace and defense applications, titanium alloys emerge as suitable alternatives to beryllium. These alloys boast impressive strength-to-weight ratios and exceptional corrosion resistance, making them suitable for beryllium replacement. Carbon fiber composites are another attractive option for industries focusing on weight reduction.

Furthermore, these materials exhibit remarkable strength properties, making them suitable substitutes for beryllium in the aerospace and automotive sectors. Chemical confirmation of beryllium's presence is crucial in various applications, including its use in the Earth's crust, igneous rocks, and cosmic abundance. Green varieties of beryllium, such as beryllium oxide and chloride, are essential in various industries. Potassium compounds are often used in the production of beryllium. Beryllium's chemical properties and applications are subject to ongoing research and development. Understanding the role of beryllium and its alternatives in various industries is vital for chemical and material scientists, engineers, and businesses.

Exclusive Customer Landscape

The market forecasting report includes the adoption lifecycle of the market, covering from the innovator's stage to the laggard's stage. It focuses on adoption rates in different regions based on penetration. Furthermore, the report also includes key purchase criteria and drivers of price sensitivity to help companies evaluate and develop their market growth analysis strategies.

Beryllium Market Share by Geography

 Customer Landscape

Key Companies & Market Insights

Companies are implementing various strategies, such as strategic alliances, partnerships, mergers and acquisitions, geographical expansion, and product/service launches, to enhance their presence in the market.

American Elements: The company offers beryllium, such as BeO, which is used in advanced ceramic components and compounded materials.

The market research and growth report includes detailed analyses of the competitive landscape of the market and information about key companies, including:

  • American Beryllia Inc.
  • American Elements
  • AMETEK Inc.
  • Aviva Metals Inc.
  • Belmont Metals Inc.
  • Bob Martin Co.
  • Coiling Technologies Inc.
  • ENS Technology
  • ESPI Metals
  • IBC Advanced Alloys Corp.
  • IRISO Electronics co. ltd.
  • Materion Corp.
  • Modison Metals Ltd.
  • National Atomic Co. Kazatomprom Joint Stock Co.
  • NGK INSULATORS LTD.
  • Texas Mineral Resources Corp.
  • Xiamen Beryllium Copper Technologies Co. Ltd.
  • Alloy Wire International Ltd.
  • Knight Strip Metals Ltd
  • Wieland Werke AG

Qualitative and quantitative analysis of companies has been conducted to help clients understand the wider business environment as well as the strengths and weaknesses of key market players. Data is qualitatively analyzed to categorize companies as pure play, category-focused, industry-focused, and diversified; it is quantitatively analyzed to categorize companies as dominant, leading, strong, tentative, and weak.

Research Analyst Overview

The steel-gray metal, beryllium, is a brittle element with unique chemical properties that make it valuable in various industries. Beryllium is found in nature associated with minerals like beryl, emerald, and other beryllium aluminum silicates and beryllium silicates. The green variety of beryl, known as emerald, undergoes chemical confirmation to identify the presence of beryllium. Beryllium is a light, silvery-white, alkali earth metal with a cosmic abundance similar to aluminum. It is the 11th element in the earth's crust and is extracted from igneous rocks. The largest producer countries include China, Russia, and the United States. Beryllium has an amphoteric nature and reacts with oxides, chlorides, and hydroxides.

Furthermore, it forms covalent compounds and has a high positive charge density and polarizing power. Beryllium oxide (BeO) is a significant commercial ore used in various applications due to its high thermal conductivity and hardness. Beryllium is used as an alloying agent in high-strength materials, providing better resistance and dimensional stability. It is essential in defence and aerospace industries due to its lightweight and high-performance properties. Beryllium hydroxide and beryllium oxide are commonly used forms of the metal, extracted through processes involving concentrated nitric acid, oxygen, and air. Beryllium is soluble in dilute acid and water and reacts with hydrogen to form metal hydrides. It is a soft metal that reacts with oxygen at room temperature, forming oxides. Other minerals like bertrandite and chrysoberyl contain beryllium in soluble forms. Despite its brittleness, beryllium's unique properties make it an indispensable element in various industries.

Market Scope

Report Coverage

Details

Page number

153

Base year

2023

Historic period

2018-2022

Forecast period

2024-2028

Growth momentum & CAGR

Accelerate at a CAGR of 2.94%

Market Growth 2024-2028

USD 68.54 million

Market structure

Fragmented

YoY growth 2023-2024(%)

2.66

Regional analysis

North America, APAC, Europe, Middle East and Africa, and South America

Performing market contribution

North America at 51%

Key countries

US, China, India, Russia, and Brazil

Competitive landscape

Leading Companies, Market Positioning of Companies, Competitive Strategies, and Industry Risks

Key companies profiled

American Beryllia Inc., American Elements, AMETEK Inc., Aviva Metals Inc., Belmont Metals Inc., Bob Martin Co., Coiling Technologies Inc., ENS Technology, ESPI Metals, IBC Advanced Alloys Corp., IRISO Electronics co. ltd., Materion Corp., Modison Metals Ltd., National Atomic Co. Kazatomprom Joint Stock Co., NGK INSULATORS LTD., Texas Mineral Resources Corp., Xiamen Beryllium Copper Technologies Co. Ltd., Alloy Wire International Ltd., Knight Strip Metals Ltd, and Wieland Werke AG

Market dynamics

Parent market analysis, market growth inducers and obstacles, market forecast, fast-growing and slow-growing segment analysis, COVID-19 impact and recovery analysis and future consumer dynamics, market condition analysis for the forecast period

Customization purview

If our market report has not included the data that you are looking for, you can reach out to our analysts and get segments customized.

Request Free Sample

What are the Key Data Covered in this Market Research and Growth Report?

  • CAGR of the market during the forecast period
  • Detailed information on factors that will drive the market growth and forecasting between 2024 and 2028
  • Precise estimation of the size of the market  and its contribution of the market in focus to the parent market
  • Accurate predictions about upcoming market growth and trends and changes in consumer behaviour
  • Growth of the market across North America, APAC, Europe, Middle East and Africa, and South America
  • Thorough analysis of the market's competitive landscape and detailed information about companies
  • Comprehensive analysis of factors that will challenge the growth of market companies

We can help! Our analysts can customize this market research report to meet your requirements. Get in touch

1 Executive Summary

  • 1.1 Market overview
    • Exhibit 01: Executive Summary – Chart on Market Overview
    • Exhibit 02: Executive Summary – Data Table on Market Overview
    • Exhibit 03: Executive Summary – Chart on Global Market Characteristics
    • Exhibit 04: Executive Summary – Chart on Market by Geography
    • Exhibit 05: Executive Summary – Chart on Market Segmentation by End-user
    • Exhibit 06: Executive Summary – Chart on Market Segmentation by Type
    • Exhibit 07: Executive Summary – Chart on Incremental Growth
    • Exhibit 08: Executive Summary – Data Table on Incremental Growth
    • Exhibit 09: Executive Summary – Chart on Vendor Market Positioning

2 Market Landscape

  • 2.1 Market ecosystem
    • Exhibit 10: Parent market
    • Exhibit 11: Market Characteristics

3 Market Sizing

  • 3.1 Market definition
    • Exhibit 12: Offerings of vendors included in the market definition
  • 3.2 Market segment analysis
    • Exhibit 13: Market segments
  • 3.3 Market size 2023
    • 3.4 Market outlook: Forecast for 2023-2028
      • Exhibit 14: Chart on Global - Market size and forecast 2023-2028 ($ million)
      • Exhibit 15: Data Table on Global - Market size and forecast 2023-2028 ($ million)
      • Exhibit 16: Chart on Global Market: Year-over-year growth 2023-2028 (%)
      • Exhibit 17: Data Table on Global Market: Year-over-year growth 2023-2028 (%)

    4 Historic Market Size

    • 4.1 Global beryllium market 2018 - 2022
      • Exhibit 18: Historic Market Size – Data Table on global beryllium market 2018 - 2022 ($ million)
    • 4.2 End-user Segment Analysis 2018 - 2022
      • Exhibit 19: Historic Market Size – End-user Segment 2018 - 2022 ($ million)
    • 4.3 Type Segment Analysis 2018 - 2022
      • Exhibit 20: Historic Market Size – Type Segment 2018 - 2022 ($ million)
    • 4.4 Geography Segment Analysis 2018 - 2022
      • Exhibit 21: Historic Market Size – Geography Segment 2018 - 2022 ($ million)
    • 4.5 Country Segment Analysis 2018 - 2022
      • Exhibit 22: Historic Market Size – Country Segment 2018 - 2022 ($ million)

    5 Five Forces Analysis

    • 5.1 Five forces summary
      • Exhibit 23: Five forces analysis - Comparison between 2023 and 2028
    • 5.2 Bargaining power of buyers
      • Exhibit 24: Chart on Bargaining power of buyers – Impact of key factors 2023 and 2028
    • 5.3 Bargaining power of suppliers
      • Exhibit 25: Bargaining power of suppliers – Impact of key factors in 2023 and 2028
    • 5.4 Threat of new entrants
      • Exhibit 26: Threat of new entrants – Impact of key factors in 2023 and 2028
    • 5.5 Threat of substitutes
      • Exhibit 27: Threat of substitutes – Impact of key factors in 2023 and 2028
    • 5.6 Threat of rivalry
      • Exhibit 28: Threat of rivalry – Impact of key factors in 2023 and 2028
    • 5.7 Market condition
      • Exhibit 29: Chart on Market condition - Five forces 2023 and 2028

    6 Market Segmentation by End-user

    • 6.1 Market segments
      • Exhibit 30: Chart on End-user - Market share 2023-2028 (%)
      • Exhibit 31: Data Table on End-user - Market share 2023-2028 (%)
    • 6.2 Comparison by End-user
      • Exhibit 32: Chart on Comparison by End-user
      • Exhibit 33: Data Table on Comparison by End-user
    • 6.3 Automotive - Market size and forecast 2023-2028
      • Exhibit 34: Chart on Automotive - Market size and forecast 2023-2028 ($ million)
      • Exhibit 35: Data Table on Automotive - Market size and forecast 2023-2028 ($ million)
      • Exhibit 36: Chart on Automotive - Year-over-year growth 2023-2028 (%)
      • Exhibit 37: Data Table on Automotive - Year-over-year growth 2023-2028 (%)
    • 6.4 Healthcare - Market size and forecast 2023-2028
      • Exhibit 38: Chart on Healthcare - Market size and forecast 2023-2028 ($ million)
      • Exhibit 39: Data Table on Healthcare - Market size and forecast 2023-2028 ($ million)
      • Exhibit 40: Chart on Healthcare - Year-over-year growth 2023-2028 (%)
      • Exhibit 41: Data Table on Healthcare - Year-over-year growth 2023-2028 (%)
    • 6.5 Aerospace and defense - Market size and forecast 2023-2028
      • Exhibit 42: Chart on Aerospace and defense - Market size and forecast 2023-2028 ($ million)
      • Exhibit 43: Data Table on Aerospace and defense - Market size and forecast 2023-2028 ($ million)
      • Exhibit 44: Chart on Aerospace and defense - Year-over-year growth 2023-2028 (%)
      • Exhibit 45: Data Table on Aerospace and defense - Year-over-year growth 2023-2028 (%)
    • 6.6 Others - Market size and forecast 2023-2028
      • Exhibit 46: Chart on Others - Market size and forecast 2023-2028 ($ million)
      • Exhibit 47: Data Table on Others - Market size and forecast 2023-2028 ($ million)
      • Exhibit 48: Chart on Others - Year-over-year growth 2023-2028 (%)
      • Exhibit 49: Data Table on Others - Year-over-year growth 2023-2028 (%)
    • 6.7 Market opportunity by End-user
      • Exhibit 50: Market opportunity by End-user ($ million)
      • Exhibit 51: Data Table on Market opportunity by End-user ($ million)

    7 Market Segmentation by Type

    • 7.1 Market segments
      • Exhibit 52: Chart on Type - Market share 2023-2028 (%)
      • Exhibit 53: Data Table on Type - Market share 2023-2028 (%)
    • 7.2 Comparison by Type
      • Exhibit 54: Chart on Comparison by Type
      • Exhibit 55: Data Table on Comparison by Type
    • 7.3 Alloys - Market size and forecast 2023-2028
      • Exhibit 56: Chart on Alloys - Market size and forecast 2023-2028 ($ million)
      • Exhibit 57: Data Table on Alloys - Market size and forecast 2023-2028 ($ million)
      • Exhibit 58: Chart on Alloys - Year-over-year growth 2023-2028 (%)
      • Exhibit 59: Data Table on Alloys - Year-over-year growth 2023-2028 (%)
    • 7.4 Metals - Market size and forecast 2023-2028
      • Exhibit 60: Chart on Metals - Market size and forecast 2023-2028 ($ million)
      • Exhibit 61: Data Table on Metals - Market size and forecast 2023-2028 ($ million)
      • Exhibit 62: Chart on Metals - Year-over-year growth 2023-2028 (%)
      • Exhibit 63: Data Table on Metals - Year-over-year growth 2023-2028 (%)
    • 7.5 Ceramics - Market size and forecast 2023-2028
      • Exhibit 64: Chart on Ceramics - Market size and forecast 2023-2028 ($ million)
      • Exhibit 65: Data Table on Ceramics - Market size and forecast 2023-2028 ($ million)
      • Exhibit 66: Chart on Ceramics - Year-over-year growth 2023-2028 (%)
      • Exhibit 67: Data Table on Ceramics - Year-over-year growth 2023-2028 (%)
    • 7.6 Market opportunity by Type
      • Exhibit 68: Market opportunity by Type ($ million)
      • Exhibit 69: Data Table on Market opportunity by Type ($ million)

    8 Customer Landscape

    • 8.1 Customer landscape overview
      • Exhibit 70: Analysis of price sensitivity, lifecycle, customer purchase basket, adoption rates, and purchase criteria

    9 Geographic Landscape

    • 9.1 Geographic segmentation
      • Exhibit 71: Chart on Market share by geography 2023-2028 (%)
      • Exhibit 72: Data Table on Market share by geography 2023-2028 (%)
    • 9.2 Geographic comparison
      • Exhibit 73: Chart on Geographic comparison
      • Exhibit 74: Data Table on Geographic comparison
    • 9.3 North America - Market size and forecast 2023-2028
      • Exhibit 75: Chart on North America - Market size and forecast 2023-2028 ($ million)
      • Exhibit 76: Data Table on North America - Market size and forecast 2023-2028 ($ million)
      • Exhibit 77: Chart on North America - Year-over-year growth 2023-2028 (%)
      • Exhibit 78: Data Table on North America - Year-over-year growth 2023-2028 (%)
    • 9.4 APAC - Market size and forecast 2023-2028
      • Exhibit 79: Chart on APAC - Market size and forecast 2023-2028 ($ million)
      • Exhibit 80: Data Table on APAC - Market size and forecast 2023-2028 ($ million)
      • Exhibit 81: Chart on APAC - Year-over-year growth 2023-2028 (%)
      • Exhibit 82: Data Table on APAC - Year-over-year growth 2023-2028 (%)
    • 9.5 Europe - Market size and forecast 2023-2028
      • Exhibit 83: Chart on Europe - Market size and forecast 2023-2028 ($ million)
      • Exhibit 84: Data Table on Europe - Market size and forecast 2023-2028 ($ million)
      • Exhibit 85: Chart on Europe - Year-over-year growth 2023-2028 (%)
      • Exhibit 86: Data Table on Europe - Year-over-year growth 2023-2028 (%)
    • 9.6 Middle East and Africa - Market size and forecast 2023-2028
      • Exhibit 87: Chart on Middle East and Africa - Market size and forecast 2023-2028 ($ million)
      • Exhibit 88: Data Table on Middle East and Africa - Market size and forecast 2023-2028 ($ million)
      • Exhibit 89: Chart on Middle East and Africa - Year-over-year growth 2023-2028 (%)
      • Exhibit 90: Data Table on Middle East and Africa - Year-over-year growth 2023-2028 (%)
    • 9.7 South America - Market size and forecast 2023-2028
      • Exhibit 91: Chart on South America - Market size and forecast 2023-2028 ($ million)
      • Exhibit 92: Data Table on South America - Market size and forecast 2023-2028 ($ million)
      • Exhibit 93: Chart on South America - Year-over-year growth 2023-2028 (%)
      • Exhibit 94: Data Table on South America - Year-over-year growth 2023-2028 (%)
    • 9.8 US - Market size and forecast 2023-2028
      • Exhibit 95: Chart on US - Market size and forecast 2023-2028 ($ million)
      • Exhibit 96: Data Table on US - Market size and forecast 2023-2028 ($ million)
      • Exhibit 97: Chart on US - Year-over-year growth 2023-2028 (%)
      • Exhibit 98: Data Table on US - Year-over-year growth 2023-2028 (%)
    • 9.9 China - Market size and forecast 2023-2028
      • Exhibit 99: Chart on China - Market size and forecast 2023-2028 ($ million)
      • Exhibit 100: Data Table on China - Market size and forecast 2023-2028 ($ million)
      • Exhibit 101: Chart on China - Year-over-year growth 2023-2028 (%)
      • Exhibit 102: Data Table on China - Year-over-year growth 2023-2028 (%)
    • 9.10 India - Market size and forecast 2023-2028
      • Exhibit 103: Chart on India - Market size and forecast 2023-2028 ($ million)
      • Exhibit 104: Data Table on India - Market size and forecast 2023-2028 ($ million)
      • Exhibit 105: Chart on India - Year-over-year growth 2023-2028 (%)
      • Exhibit 106: Data Table on India - Year-over-year growth 2023-2028 (%)
    • 9.11 Brazil - Market size and forecast 2023-2028
      • Exhibit 107: Chart on Brazil - Market size and forecast 2023-2028 ($ million)
      • Exhibit 108: Data Table on Brazil - Market size and forecast 2023-2028 ($ million)
      • Exhibit 109: Chart on Brazil - Year-over-year growth 2023-2028 (%)
      • Exhibit 110: Data Table on Brazil - Year-over-year growth 2023-2028 (%)
    • 9.12 Russia - Market size and forecast 2023-2028
      • Exhibit 111: Chart on Russia - Market size and forecast 2023-2028 ($ million)
      • Exhibit 112: Data Table on Russia - Market size and forecast 2023-2028 ($ million)
      • Exhibit 113: Chart on Russia - Year-over-year growth 2023-2028 (%)
      • Exhibit 114: Data Table on Russia - Year-over-year growth 2023-2028 (%)
    • 9.13 Market opportunity by geography
      • Exhibit 115: Market opportunity by geography ($ million)
      • Exhibit 116: Data Tables on Market opportunity by geography ($ million)

    10 Drivers, Challenges, and Trends

    • 10.1 Market drivers
      • 10.2 Market challenges
        • 10.3 Impact of drivers and challenges
          • Exhibit 117: Impact of drivers and challenges in 2023 and 2028
        • 10.4 Market trends

          11 Vendor Landscape

          • 11.1 Overview
            • 11.2 Vendor landscape
              • Exhibit 118: Overview on Criticality of inputs and Factors of differentiation
            • 11.3 Landscape disruption
              • Exhibit 119: Overview on factors of disruption
            • 11.4 Industry risks
              • Exhibit 120: Impact of key risks on business

            12 Vendor Analysis

            • 12.1 Vendors covered
              • Exhibit 121: Vendors covered
            • 12.2 Market positioning of vendors
              • Exhibit 122: Matrix on vendor position and classification
            • 12.3 American Beryllia Inc.
              • Exhibit 123: American Beryllia Inc. - Overview
              • Exhibit 124: American Beryllia Inc. - Product / Service
              • Exhibit 125: American Beryllia Inc. - Key offerings
            • 12.4 American Elements
              • Exhibit 126: American Elements - Overview
              • Exhibit 127: American Elements - Product / Service
              • Exhibit 128: American Elements - Key offerings
            • 12.5 AMETEK Inc.
              • Exhibit 129: AMETEK Inc. - Overview
              • Exhibit 130: AMETEK Inc. - Business segments
              • Exhibit 131: AMETEK Inc. - Key offerings
              • Exhibit 132: AMETEK Inc. - Segment focus
            • 12.6 Belmont Metals Inc.
              • Exhibit 133: Belmont Metals Inc. - Overview
              • Exhibit 134: Belmont Metals Inc. - Product / Service
              • Exhibit 135: Belmont Metals Inc. - Key offerings
            • 12.7 Bob Martin Co.
              • Exhibit 136: Bob Martin Co. - Overview
              • Exhibit 137: Bob Martin Co. - Product / Service
              • Exhibit 138: Bob Martin Co. - Key offerings
            • 12.8 Coiling Technologies Inc.
              • Exhibit 139: Coiling Technologies Inc. - Overview
              • Exhibit 140: Coiling Technologies Inc. - Product / Service
              • Exhibit 141: Coiling Technologies Inc. - Key offerings
            • 12.9 ENS Technology
              • Exhibit 142: ENS Technology - Overview
              • Exhibit 143: ENS Technology - Product / Service
              • Exhibit 144: ENS Technology - Key offerings
            • 12.10 IBC Advanced Alloys Corp.
              • Exhibit 145: IBC Advanced Alloys Corp. - Overview
              • Exhibit 146: IBC Advanced Alloys Corp. - Product / Service
              • Exhibit 147: IBC Advanced Alloys Corp. - Key offerings
            • 12.11 Materion Corp.
              • Exhibit 148: Materion Corp. - Overview
              • Exhibit 149: Materion Corp. - Business segments
              • Exhibit 150: Materion Corp. - Key offerings
              • Exhibit 151: Materion Corp. - Segment focus
            • 12.12 Modison Metals Ltd.
              • Exhibit 152: Modison Metals Ltd. - Overview
              • Exhibit 153: Modison Metals Ltd. - Product / Service
              • Exhibit 154: Modison Metals Ltd. - Key offerings
            • 12.13 National Atomic Co. Kazatomprom Joint Stock Co.
              • Exhibit 155: National Atomic Co. Kazatomprom Joint Stock Co. - Overview
              • Exhibit 156: National Atomic Co. Kazatomprom Joint Stock Co. - Business segments
              • Exhibit 157: National Atomic Co. Kazatomprom Joint Stock Co. - Key news
              • Exhibit 158: National Atomic Co. Kazatomprom Joint Stock Co. - Key offerings
              • Exhibit 159: National Atomic Co. Kazatomprom Joint Stock Co. - Segment focus
            • 12.14 NGK INSULATORS LTD.
              • Exhibit 160: NGK INSULATORS LTD. - Overview
              • Exhibit 161: NGK INSULATORS LTD. - Product / Service
              • Exhibit 162: NGK INSULATORS LTD. - Key offerings
            • 12.15 Texas Mineral Resources Corp.
              • Exhibit 163: Texas Mineral Resources Corp. - Overview
              • Exhibit 164: Texas Mineral Resources Corp. - Product / Service
              • Exhibit 165: Texas Mineral Resources Corp. - Key offerings
            • 12.16 Wieland Werke AG
              • Exhibit 166: Wieland Werke AG - Overview
              • Exhibit 167: Wieland Werke AG - Product / Service
              • Exhibit 168: Wieland Werke AG - Key offerings
            • 12.17 Xiamen Beryllium Copper Technologies Co. Ltd.
              • Exhibit 169: Xiamen Beryllium Copper Technologies Co. Ltd. - Overview
              • Exhibit 170: Xiamen Beryllium Copper Technologies Co. Ltd. - Product / Service
              • Exhibit 171: Xiamen Beryllium Copper Technologies Co. Ltd. - Key offerings

            13 Appendix

            • 13.1 Scope of the report
              • 13.2 Inclusions and exclusions checklist
                • Exhibit 172: Inclusions checklist
                • Exhibit 173: Exclusions checklist
              • 13.3 Currency conversion rates for US$
                • Exhibit 174: Currency conversion rates for US$
              • 13.4 Research methodology
                • Exhibit 175: Research methodology
                • Exhibit 176: Validation techniques employed for market sizing
                • Exhibit 177: Information sources
              • 13.5 List of abbreviations
                • Exhibit 178: List of abbreviations

              Research Methodology

              Technavio presents a detailed picture of the market by way of study, synthesis, and summation of data from multiple sources. The analysts have presented the various facets of the market with a particular focus on identifying the key industry influencers. The data thus presented is comprehensive, reliable, and the result of extensive research, both primary and secondary.

              INFORMATION SOURCES

              Primary sources

              • Manufacturers and suppliers
              • Channel partners
              • Industry experts
              • Strategic decision makers

              Secondary sources

              • Industry journals and periodicals
              • Government data
              • Financial reports of key industry players
              • Historical data
              • Press releases

              DATA ANALYSIS

              Data Synthesis

              • Collation of data
              • Estimation of key figures
              • Analysis of derived insights

              Data Validation

              • Triangulation with data models
              • Reference against proprietary databases
              • Corroboration with industry experts

              REPORT WRITING

              Qualitative

              • Market drivers
              • Market challenges
              • Market trends
              • Five forces analysis

              Quantitative

              • Market size and forecast
              • Market segmentation
              • Geographical insights
              • Competitive landscape

              Interested in this report?

              Get your sample now to see our research methodology and insights!

              Download Now

              Frequently Asked Questions

              Beryllium market growth will increase by $ 68.54 mn during 2024-2028.

              The Beryllium market is expected to grow at a CAGR of 2.94% during 2024-2028.

              Beryllium market is segmented by End-user( Automotive, Healthcare, Aerospace and defense, Others) Type( Alloys, Metals, Ceramics)

              American Beryllia Inc., American Elements, AMETEK Inc., Aviva Metals Inc., Belmont Metals Inc., Bob Martin Co., Coiling Technologies Inc., ENS Technology, ESPI Metals, IBC Advanced Alloys Corp., IRISO Electronics co. ltd., Materion Corp., Modison Metals Ltd., National Atomic Co. Kazatomprom Joint Stock Co., NGK INSULATORS LTD., Texas Mineral Resources Corp., Xiamen Beryllium Copper Technologies Co. Ltd., Alloy Wire International Ltd., Knight Strip Metals Ltd, Wieland Werke AG are a few of the key vendors in the Beryllium market.

              North America will register the highest growth rate of 51% among the other regions. Therefore, the Beryllium market in North America is expected to garner significant business opportunities for the vendors during the forecast period.

              US, China, India, Russia, Brazil

              • High demand for beryllium in precision instrumentsBeryllium exhibits minimal thermal expansion is the driving factor this market.
              • meaning it maintains its shape and dimensions even when subjected to temperature variations. This property is crucial in precision instruments where dimensional stability is essential for accurate measurements or optical performance. Beryllium is exceptionally stiff yet lightweight. This property allows precision instruments to maintain rigidity and structural integrity while minimizing weight is the driving factor this market.
              • enabling more precise measurements and improved performance. Beryllium is non-magnetic is the driving factor this market.
              • making it suitable for precision equipment where magnetic interference could affect performance or accuracy. This property is advantageous in applications such as magnetic resonance imaging (MRI) machines is the driving factor this market.
              • electron microscopes is the driving factor this market.
              • and magnetic sensors. Beryllium exhibits excellent thermal conductivity is the driving factor this market.
              • allowing for efficient heat dissipation in precision instruments. This property is beneficial in devices where temperature control is critical to maintaining accuracy and stability. Beryllium is biocompatible to some extent is the driving factor this market.
              • making it suitable for certain precision equipment used in medical and biotechnology applications. Beryllium offers numerous benefits for precision equipment is the driving factor this market.
              • including dimensional stability is the driving factor this market.
              • high stiffness is the driving factor this market.
              • low weight is the driving factor this market.
              • thermal conductivity is the driving factor this market.
              • non-magnetic properties is the driving factor this market.
              • corrosion resistance is the driving factor this market.
              • and biocompatibility. These properties make beryllium-containing materials well-suited for a wide range of precision applications where accuracy is the driving factor this market.
              • reliability is the driving factor this market.
              • and performance are paramount. Therefore is the driving factor this market.
              • the demand for beryllium in precision instruments is high due to its unique combination of mechanical is the driving factor this market.
              • thermal is the driving factor this market.
              • and electrical properties is the driving factor this market.
              • which enable the development of high-performance and reliable instruments crucial for various scientific is the driving factor this market.
              • industrial is the driving factor this market.
              • and research applications. Thus is the driving factor this market.
              • the high demand for beryllium may fuel the growth of the global market in focus during the forecast period. is the driving factor this market.

              The Beryllium market vendors should focus on grabbing business opportunities from the Automotive segment as it accounted for the largest market share in the base year.
              RIA - Research AI Assistant
              Ask RIA