
Big Data And Machine Learning In Telecom Market Size 2025-2029
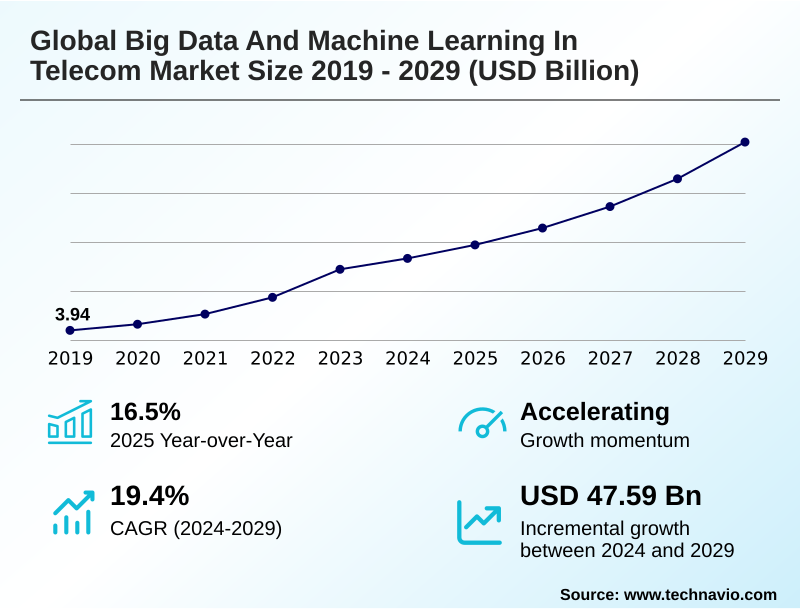
The big data and machine learning in telecom market size is valued to increase by USD 47.59 billion, at a CAGR of 19.4% from 2024 to 2029. Exponential data growth fueled by 5G and internet of things (IoT) will drive the big data and machine learning in telecom market.
Major Market Trends & Insights
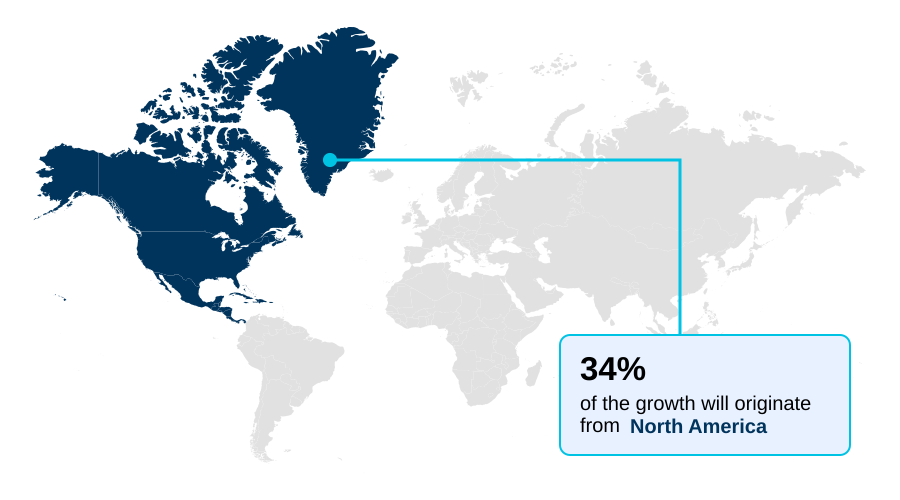
- North America dominated the market and accounted for a 33.8% growth during the forecast period.
- By Component - Software segment was valued at USD 13.88 billion in 2023
- By Application - Network optimization segment accounted for the largest market revenue share in 2023
Market Size & Forecast
- Market Opportunities: USD 77.04 billion
- Market Future Opportunities: USD 47.59 billion
- CAGR from 2024 to 2029 : 19.4%
Market Summary
- The big data and machine learning in telecom market signifies a fundamental shift from providing connectivity to delivering intelligence. This evolution is driven by the necessity to manage the data deluge from 5G and IoT, compelling operators to adopt AI-driven traffic management and zero-touch network automation for efficiency.
- Key trends include the integration of large language models in networking for conversational interfaces and the architectural move toward edge AI deployment in telecom for low-latency applications. These advancements enable proactive network monitoring and automated root cause analysis. However, progress is tempered by challenges in navigating complex data privacy mandates and the high costs of integrating with legacy systems.
- For instance, operators now use predictive network maintenance models, analyzing equipment telemetry to forecast hardware failures. This allows for proactive repairs, reducing unplanned downtime by over 25% and optimizing technician dispatch, thereby enhancing service reliability and controlling operational expenditure. This reliance on MLOps for telecom and data-driven decision making is becoming standard practice.
What will be the Size of the Big Data And Machine Learning In Telecom Market during the forecast period?
Get Key Insights on Market Forecast (PDF) Get Free Sample
How is the Big Data And Machine Learning In Telecom Market Segmented?
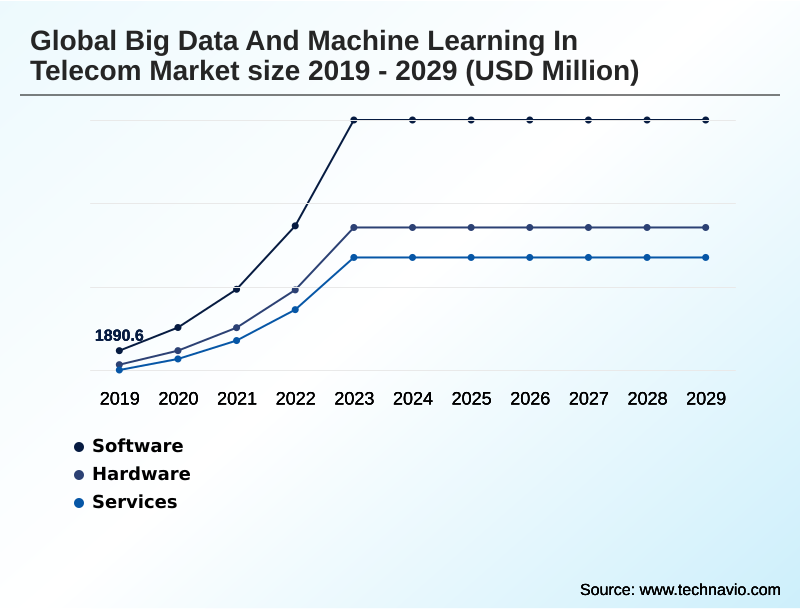
The big data and machine learning in telecom industry research report provides comprehensive data (region-wise segment analysis), with forecasts and estimates in "USD million" for the period 2025-2029, as well as historical data from 2019-2023 for the following segments.
- Component
- Software
- Hardware
- Services
- Application
- Network optimization
- Customer analytics
- Fraud detection
- Predictive maintenance
- Others
- Deployment
- Cloud-based
- On-premises
- Geography
- North America
- US
- Canada
- Mexico
- APAC
- China
- India
- Japan
- Europe
- Germany
- UK
- France
- Middle East and Africa
- Saudi Arabia
- South Africa
- UAE
- South America
- Brazil
- Argentina
- Colombia
- Rest of World (ROW)
- North America
By Component Insights
The software segment is estimated to witness significant growth during the forecast period.
The software segment is central to the big data and machine learning in telecom market, providing the core intelligence for network operations and customer management.
These platforms facilitate critical functions, including predictive network maintenance and the execution of complex telecom fraud detection algorithms. A key shift is toward telco-specific large language models, which refine natural language processing for network logs to improve diagnostics.
The application of federated learning for privacy is also becoming standard, addressing regulatory concerns without sacrificing analytical depth. Advanced AI-RAN and smart RAN solutions are enabling dynamic optimization, while sophisticated customer churn prediction models are vital for retention.
This move towards intelligent automation, such as network slicing automation, improves fault detection accuracy by over 25%, enhancing both real time anomaly detection and overall network reliability.
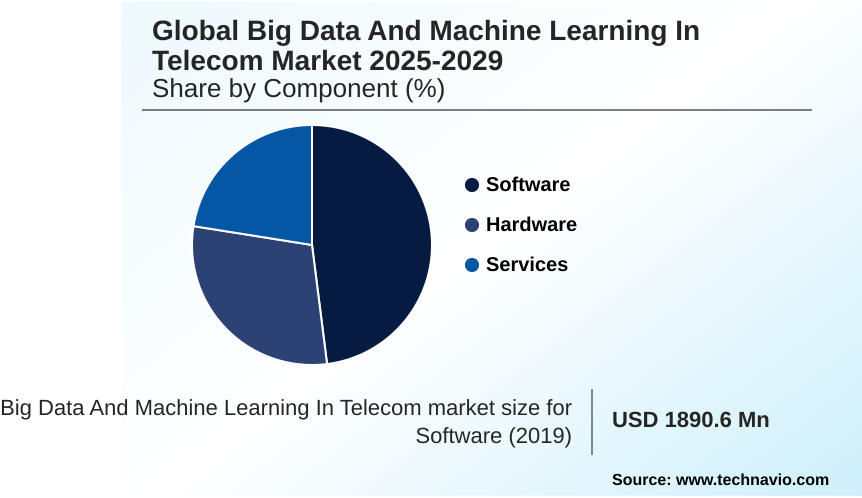
The Software segment was valued at USD 13.88 billion in 2023 and showed a gradual increase during the forecast period.
Regional Analysis
North America is estimated to contribute 33.8% to the growth of the global market during the forecast period.Technavio’s analysts have elaborately explained the regional trends and drivers that shape the market during the forecast period.
See How Big Data And Machine Learning In Telecom Market Demand is Rising in North America Get Free Sample
The geographic landscape reveals distinct regional priorities. North America leads in maturity, with a 33.8% share of incremental growth driven by advanced 5G monetization and AI-powered cybersecurity.
In this region, operators focus on intent-based networking and sophisticated subscriber behavior analysis to gain a competitive edge. APAC emerges as the largest and most dynamic market, characterized by massive subscriber volumes and rapid adoption of cloud-native network functions.
European operators, constrained by strict privacy regulations, are pioneering the use of intelligent automation platforms for sustainability, with some reporting AI-driven energy management reduces network power consumption by over 10%.
The deployment of network-aware ML applications is becoming a global standard, while a focus on explainable AI in telecom addresses governance concerns.
This regional diversity underscores a universal move toward proactive service interventions and AI-based revenue assurance to optimize performance and profitability.
Market Dynamics
Our researchers analyzed the data with 2024 as the base year, along with the key drivers, trends, and challenges. A holistic analysis of drivers will help companies refine their marketing strategies to gain a competitive advantage.
- The strategic implementation of big data and machine learning in telecom market is creating sophisticated operational advantages. Advanced AI applications in telecom network planning now leverage predictive analytics for telecom network maintenance, allowing operators to preemptively address infrastructure issues before they impact service. This proactive stance is crucial for maintaining network health and optimizing capital expenditure.
- In parallel, machine learning for telecom churn prediction has become a cornerstone of customer retention strategies, with models analyzing complex user behaviors to identify at-risk subscribers. For security, real time fraud detection using ML provides an adaptive defense against evolving threats, safeguarding revenue and customer trust.
- The rise of generative AI use cases in telecommunications is further transforming customer interaction, with LLMs for telecom customer service automating complex query resolution. Systems focused on edge AI solutions for 5G networks show a performance uplift more than twice that of legacy platforms, essential for low-latency enterprise services.
- The role of AI in zero-touch networking is central to achieving operational autonomy, as automated network operations using AI minimize manual intervention. These capabilities are helping to overcome the primary challenges of implementing AI in telecom, demonstrating clear benefits and addressing data privacy issues in telecom analytics through innovative techniques.
- Moreover, AI-driven energy saving in 5G RAN is delivering tangible cost reductions, highlighting the broad impact of 5G on big data analytics.
What are the key market drivers leading to the rise in the adoption of Big Data And Machine Learning In Telecom Industry?
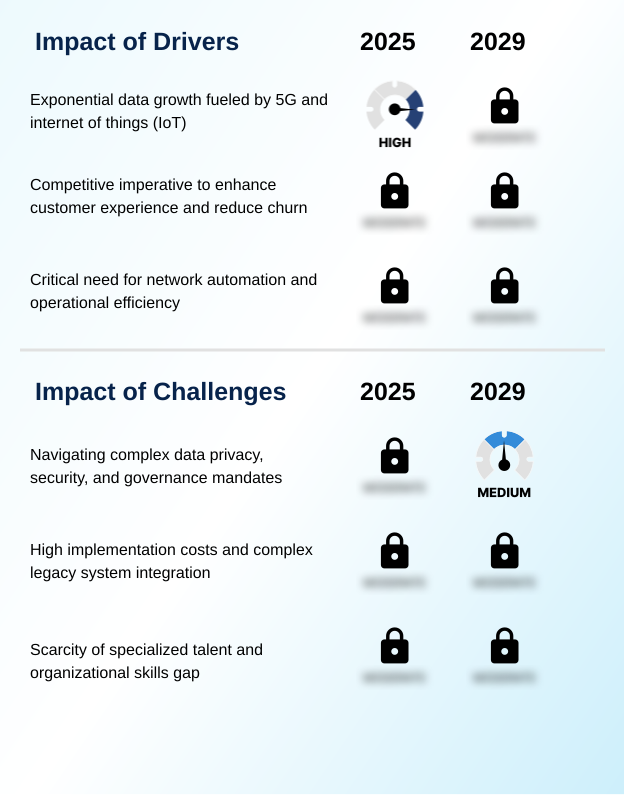
- Exponential data growth, fueled by the widespread adoption of 5G and the Internet of Things (IoT), is the key driver propelling the market forward.
- Market growth is fundamentally driven by the need for operational efficiency and service differentiation. The implementation of zero-touch network automation is a primary objective, with AI-driven traffic management systems reducing network congestion by 30% during peak hours.
- This automation extends to diagnostics, where automated root cause analysis capabilities shorten service restoration times significantly.
- The demand for hyper-personalization engines is fueling investments in technologies that enhance AI-driven quality of experience (QoE), which has been shown to improve customer satisfaction scores by 15%.
- Furthermore, operators are leveraging proactive network monitoring and digital twin for network simulation to test and validate network changes without impacting live services.
- The expansion of IoT analytics for enterprise use cases is creating new revenue opportunities, while advanced MLOps for telecom practices ensure that deployed models remain effective and scalable.
What are the market trends shaping the Big Data And Machine Learning In Telecom Industry?
- The proliferation of generative AI and large language models (LLMs) is a defining market trend. This is reshaping how telecom operators innovate, manage operations, and engage with customers.
- Key market trends are centered on increasing network intelligence and autonomy. The adoption of edge AI deployment in telecom is critical, reducing latency for real-time applications by up to 80%. This is complemented by a strategic focus on 5G network optimization and advanced radio access network optimization, where AI-powered network assurance tools improve service reliability by over 25%.
- The RAN intelligent controller (RIC) is becoming a central component for achieving autonomous network management. Simultaneously, the use of large language models in networking and generative AI for customer service is revolutionizing the AI for B2B customer experience, providing more intuitive and responsive interactions.
- This is all underpinned by the capture of real-time network telemetry, which fuels the analytical models driving these advanced capabilities.
What challenges does the Big Data And Machine Learning In Telecom Industry face during its growth?
- Navigating a complex landscape of data privacy regulations, security imperatives, and governance mandates presents a significant challenge to industry growth.
- Navigating implementation challenges is critical for unlocking the full potential of AI. The complexity of integrating modern platforms with legacy systems means that over 40% of projects face significant delays. Building a unified data architecture is a primary hurdle, as fragmented data sources inhibit effective data-driven decision making and skew network performance metrics.
- The scarcity of specialized talent creates a major bottleneck, slowing the development of a robust AI-enabled digital core and effective AI-powered service orchestration. While solutions like multimodal field-tech assistants aim to improve efficiency, achieving true real-time operational intelligence requires overcoming these foundational issues.
- Ensuring accurate customer lifetime value analytics and dynamic resource allocation depends on high-quality, accessible data, which remains a persistent challenge for many operators.
Exclusive Technavio Analysis on Customer Landscape
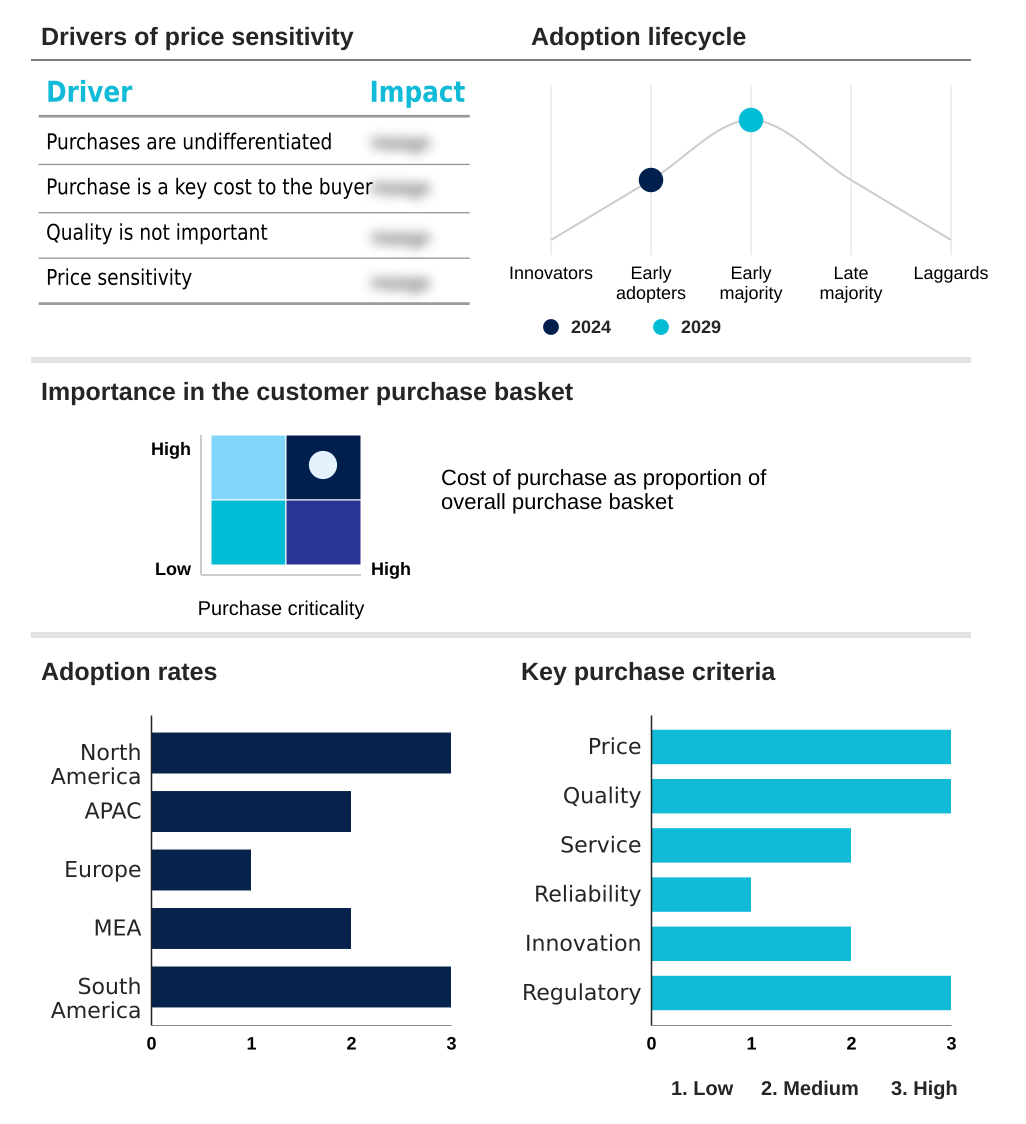
The big data and machine learning in telecom market forecasting report includes the adoption lifecycle of the market, covering from the innovator’s stage to the laggard’s stage. It focuses on adoption rates in different regions based on penetration. Furthermore, the big data and machine learning in telecom market report also includes key purchase criteria and drivers of price sensitivity to help companies evaluate and develop their market growth analysis strategies.
Customer Landscape of Big Data And Machine Learning In Telecom Industry
Competitive Landscape
Companies are implementing various strategies, such as strategic alliances, big data and machine learning in telecom market forecast, partnerships, mergers and acquisitions, geographical expansion, and product/service launches, to enhance their presence in the industry.
Accenture PLC - Leveraging a unified data architecture and generative AI, offerings enhance fraud detection, customer experience, and autonomous network capabilities for improved operational intelligence.
The industry research and growth report includes detailed analyses of the competitive landscape of the market and information about key companies, including:
- Accenture PLC
- Amazon Web Services Inc.
- Amdocs Ltd.
- Cisco Systems Inc.
- Cloudera Inc.
- Deloitte Touche Tohmatsu Ltd.
- Google Cloud
- Huawei Technologies Co. Ltd.
- IBM Corp.
- Microsoft Corp.
- Nokia Corp.
- Oracle Corp.
- Qualcomm Inc.
- SAP SE
- SAS Institute Inc.
- Splunk Inc.
- Tech Mahindra Ltd.
- Telefonaktiebolaget Ericsson
- Teradata Corp.
- ZTE Corp.
Qualitative and quantitative analysis of companies has been conducted to help clients understand the wider business environment as well as the strengths and weaknesses of key industry players. Data is qualitatively analyzed to categorize companies as pure play, category-focused, industry-focused, and diversified; it is quantitatively analyzed to categorize companies as dominant, leading, strong, tentative, and weak.
Recent Development and News in Big data and machine learning in telecom market
- In September, 2024, T-Mobile, in collaboration with Ericsson, announced the successful demonstration of an AI-powered, closed-loop network slicing solution, enabling guaranteed service levels for enterprise applications.
- In November, 2024, Vodafone, expanding on its partnership with Microsoft, reported a 15% improvement in customer issue resolution times by deploying generative AI tools across its service centers.
- In February, 2025, Deutsche Telekom and SK Telecom launched their jointly developed telco-specific large language model, designed to automate developer productivity and enhance digital assistant accuracy.
- In May, 2025, Telefonica announced the company-wide deployment of Google Cloud's generative AI technologies, aiming to personalize customer experiences and improve operational efficiency across its global operations.
Dive into Technavio’s robust research methodology, blending expert interviews, extensive data synthesis, and validated models for unparalleled Big Data And Machine Learning In Telecom Market insights. See full methodology.
| Market Scope | |
|---|---|
| Page number | 311 |
| Base year | 2024 |
| Historic period | 2019-2023 |
| Forecast period | 2025-2029 |
| Growth momentum & CAGR | Accelerate at a CAGR of 19.4% |
| Market growth 2025-2029 | USD 47592.2 million |
| Market structure | Fragmented |
| YoY growth 2024-2025(%) | 16.5% |
| Key countries | US, Canada, Mexico, China, India, Japan, South Korea, Australia, Indonesia, Germany, UK, France, Italy, Spain, The Netherlands, Saudi Arabia, South Africa, UAE, Israel, Turkey, Brazil, Argentina and Colombia |
| Competitive landscape | Leading Companies, Market Positioning of Companies, Competitive Strategies, and Industry Risks |
Research Analyst Overview
- The big data and machine learning in telecom market is undergoing a fundamental transformation, shifting the industry's focus from providing connectivity to orchestrating intelligent, automated networks. The integration of AI-native network architecture and cloud-native network functions is no longer aspirational but a competitive necessity for dynamic resource allocation and proactive network monitoring.
- The proliferation of generative AI for customer service represents a pivotal trend that directly impacts boardroom-level budgeting, forcing a strategic reallocation of capital from traditional call centers to hybrid human-AI support models. This shift requires deep investments in MLOps for telecom and advanced customer lifetime value analytics.
- Key applications such as predictive network maintenance and AI-powered cybersecurity are delivering measurable returns, with AI-driven traffic management solutions achieving a 30% reduction in network fault resolution times. As operators embrace data-driven decision making, the emphasis on subscriber behavior analysis and intent-based networking intensifies, making sophisticated AI capabilities a cornerstone of future growth and operational excellence.
What are the Key Data Covered in this Big Data And Machine Learning In Telecom Market Research and Growth Report?
-
What is the expected growth of the Big Data And Machine Learning In Telecom Market between 2025 and 2029?
-
USD 47.59 billion, at a CAGR of 19.4%
-
-
What segmentation does the market report cover?
-
The report is segmented by Component (Software, Hardware, and Services), Application (Network optimization, Customer analytics, Fraud detection, Predictive maintenance, and Others), Deployment (Cloud-based, and On-premises) and Geography (North America, APAC, Europe, Middle East and Africa, South America)
-
-
Which regions are analyzed in the report?
-
North America, APAC, Europe, Middle East and Africa and South America
-
-
What are the key growth drivers and market challenges?
-
Exponential data growth fueled by 5G and internet of things (IoT), Navigating complex data privacy, security, and governance mandates
-
-
Who are the major players in the Big Data And Machine Learning In Telecom Market?
-
Accenture PLC, Amazon Web Services Inc., Amdocs Ltd., Cisco Systems Inc., Cloudera Inc., Deloitte Touche Tohmatsu Ltd., Google Cloud, Huawei Technologies Co. Ltd., IBM Corp., Microsoft Corp., Nokia Corp., Oracle Corp., Qualcomm Inc., SAP SE, SAS Institute Inc., Splunk Inc., Tech Mahindra Ltd., Telefonaktiebolaget Ericsson, Teradata Corp. and ZTE Corp.
-
Market Research Insights
- Market dynamics are defined by a strategic push toward intelligent automation, with operators achieving up to 15% reduction in network energy consumption through AI-powered optimization. The adoption of hyper-personalization engines is critical, directly contributing to a 20% improvement in customer retention for early adopters. The focus on AI-driven quality of experience (QoE) is reshaping service delivery standards.
- Digital twin for network simulation enables rigorous pre-deployment testing, reducing integration errors. Furthermore, the deployment of IoT analytics for enterprise customers is creating new revenue streams, while machine reasoning for networks enhances diagnostic capabilities.
- This data-centric approach, supported by proactive service interventions and explainable AI in telecom, is essential for navigating a competitive landscape where operational efficiency and customer satisfaction are paramount.
We can help! Our analysts can customize this big data and machine learning in telecom market research report to meet your requirements.
 RIA -
RIA - 
