Industrial Gear Oil Market Analysis, Size, and Forecast 2025-2029: North America (US, Canada, and Mexico), APAC (China, India, Japan), Europe (France, Germany, UK), South America (Brazil), and Middle East and Africa

Industrial Gear Oil Market Analysis, Size, and Forecast 2025-2029:
North America (US, Canada, and Mexico), APAC (China, India, Japan), Europe (France, Germany, UK), South America (Brazil), and Middle East and Africa

Published: Apr 2025 242 Pages SKU: IRTNTR41081

Market Overview at a Glance

$105.7 Mn
Market Opportunity
2.7%
CAGR
2.6
YoY growth 2024-2025(%)

Industrial Gear Oil Market Size 2025-2029

The industrial gear oil market size is forecast to increase by USD 105.7 million at a CAGR of 2.7% between 2024 and 2029.

  • The market is experiencing significant growth driven by the increasing automation of industrial processes and the expanding range of industry-specific gear oil products. Automation in various industries, including manufacturing, power generation, and transportation, is leading to a higher demand for reliable and efficient gear oils to ensure smooth operations. Furthermore, the development of specialized gear oils catering to specific industry needs is fueling market expansion. However, the market is not without challenges. The volatility in raw material prices, particularly for base oils and additives, poses a significant threat to market growth. Producers must navigate these price fluctuations to maintain profitability and competitiveness. Predictive maintenance and condition monitoring through oil analysis help prevent unexpected downtime, ensuring a consistent production schedule.
  • Companies seeking to capitalize on market opportunities should focus on innovation, product differentiation, and cost management to stay ahead of the competition. Additionally, strategic partnerships and collaborations can help mitigate the impact of raw material price volatility and expand market reach. Overall, the market presents a compelling opportunity for growth, with automation trends and industry-specific product development driving demand. However, companies must navigate raw material price volatility to remain competitive and profitable.

What will be the Size of the Industrial Gear Oil Market during the forecast period?

Industrial Gear Oil Market Size

 Request Free Sample

  • The market in the United States is experiencing significant activity and growth, driven by various factors. These include the increasing demand for tooth surface protection to ensure gear durability and improve equipment efficiency. Industry standards and regulations mandate regular oil changes and maintenance schedules, leading to a focus on low-temperature pumpability and high-temperature stability. Lubrication engineering advances, such as energy efficiency, contaminant control, and responsible sourcing, are also key factors. Additionally, trends toward oil management systems, fatigue resistance, and temperature performance are shaping the market. Other emerging trends include the adoption of predictive analytics for lubrication intervals, digital twin technology for remote diagnostics, and the use of low-emission lubricants and bio-based additives for sustainability.
  • The market is further influenced by the importance of regulatory compliance, cost-benefit analysis, and power loss reduction. Gear efficiency, gear wear, sensor technologies, and remote diagnostics are also critical considerations. Overall, the market is evolving to meet the demands of industry for advanced gear oil formulations that enhance equipment performance and reduce operating costs.

How is this Industrial Gear Oil Industry segmented?

The industrial gear oil industry research report provides comprehensive data (region-wise segment analysis), with forecasts and estimates in "USD million" for the period 2025-2029, as well as historical data from 2019-2023 for the following segments.

  • Application
    • Manufacturing
    • Mining
    • Agriculture
    • Energy
    • Others
  • Product
    • Mineral
    • Synthetic
    • Semi-synthetic
    • Bio-based
  • Variant
    • ISO VG 320
    • ISO VG 220
    • ISO VG 460
    • Others
  • Geography
    • North America
      • US
      • Canada
      • Mexico
    • APAC
      • China
      • India
      • Japan
    • Europe
      • France
      • Germany
      • UK
    • South America
      • Brazil
    • Middle East and Africa

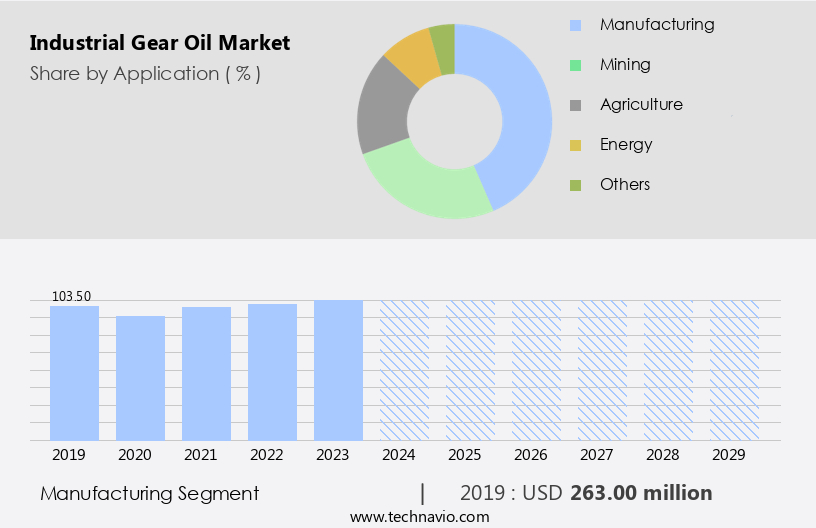
By Application Insights

The manufacturing segment is estimated to witness significant growth during the forecast period. Gear oil plays a crucial role in manufacturing by lubricating the gears in machinery such as lathes, drill presses, and milling machines. This oil's ability to draw heat away from the gears reduces friction between them, preventing the gears from overheating and extending their lifespan. Industrial gear oil is specifically designed for heavy-duty enclosed gear drives with splash and circulation systems, as well as for plain bearings, sliding surfaces, and chain drives that experience significant shock loads. The temperature limit for the application of industrial gear oil is 100 degrees Celsius. Machinery efficiency is a top priority in the manufacturing sector, and the use of industrial gear oil contributes to this goal.

Hydraulic systems, marine gears, and industrial gearboxes all benefit from the oxidation resistance and load-carrying capacity of industrial gear oil. Furthermore, the adoption of sustainable lubricants derived from renewable resources aligns with the industry's focus on energy conservation and environmental friendliness. Supply chain management and customer service are essential aspects of any business, and the use of industrial gear oil can impact both. Additionally, the use of biodegradable oils and synthetic gear oil contributes to a circular economy by reducing waste and improving lubrication performance.

The manufacturing sector's complex machinery requires effective lubrication management. Life cycle analysis and lubrication optimization are critical components of this process. Gear lubrication, viscosity index, and thermal stability are essential factors in ensuring machinery runs efficiently and effectively. Corrosion protection and wear prevention are also vital considerations, particularly in aerospace applications, mining equipment, and heavy-duty equipment. Data analytics and performance testing are essential tools for assessing the effectiveness of industrial gear oil. These methods provide valuable insights into the oil's condition and performance, enabling proactive maintenance and optimization. Remote monitoring and field trials offer additional benefits by allowing for real-time monitoring and adjustments to optimize lubrication and improve machinery efficiency.

Industrial gear oil plays a vital role in the manufacturing sector by lubricating gears, reducing friction, and extending the lifespan of machinery. Its use contributes to machinery efficiency, sustainability, and predictive maintenance. The industry's focus on supply chain management, customer service, and performance optimization drives the adoption of advanced lubrication technologies and sustainable lubricants.

Industrial Gear Oil Market Size

Get a glance at the market report of share of various segments Request Free Sample

The Manufacturing segment was valued at USD 263.00 million in 2019 and showed a gradual increase during the forecast period.

Regional Analysis

APAC is estimated to contribute 38% to the growth of the global market during the forecast period. Technavio's analysts have elaborately explained the regional trends and drivers that shape the market during the forecast period.

Industrial Gear Oil Market Share by Geography

For more insights on the market size of various regions, Request Free Sample

In North America, the US contributes significantly to the regional market's revenue growth. Previously, major US companies outsourced their manufacturing to Asia Pacific (APAC) due to lower labor costs. However, rising labor wages in APAC have compelled these companies to relocate their manufacturing plants to countries like Brazil and Mexico. This trend has resulted in an increased demand for industrial gear oil in the region. The expansion of industries such as automotive, construction, mining, and oil and gas is driving the market's growth in North America. The automotive sector's increasing demand for automobiles, coupled with the construction industry's wave in activities, is a significant factor.

Additionally, the mining industry's expansion and the rise in offshore and oil drilling activities are contributing to the market's growth. Industrial gear oil plays a crucial role in various industries, including hydraulic systems, power transmission, and machinery efficiency. Its properties, such as oxidation resistance, viscosity index, and load-carrying capacity, make it an essential component in these applications. Furthermore, the use of renewable resources in industrial gear oil production aligns with the circular economy and sustainability trends. Advancements in technology have led to the development of synthetic gear oils, sustainable lubricants, and bio-based lubricants. These innovations offer extended oil life, improved thermal stability, and enhanced wear prevention.

Additionally, predictive maintenance, condition monitoring, and oil analysis are essential practices that ensure machinery efficiency and longevity. The market is witnessing significant advancements in areas such as lubrication management, lubricant performance standards, and distribution networks. These developments enable efficient supply chain management, reduce maintenance costs, and ensure the availability of high-performance gear oils. The market in North America is experiencing strong growth due to the expanding industries, technological advancements, and the shift towards sustainable practices. The market's evolution is driven by factors such as increasing demand for automobiles, rising construction activities, expanding mining industry, and the rise of renewable resources in lubricant production.

Market Dynamics

Our researchers analyzed the data with 2024 as the base year, along with the key drivers, trends, and challenges. A holistic analysis of drivers will help companies refine their marketing strategies to gain a competitive advantage.

What are the key market drivers leading to the rise in the adoption of Industrial Gear Oil Industry?

  • Increase in plant automation is the key driver of the market.  Industrial gear oils play a crucial role in the smooth operation of automated manufacturing systems, which are increasingly prevalent due to the global demand for superior quality products and population growth. With the continuous operation of these systems comes a higher risk of failure, leading to an increased need for 24/7 automated monitoring systems. According to research, the investment in global process automation is projected to grow at a rate of 7% by the end of 2025.
  • This growth encompasses advancements in technology, hardware, software, services, and communication protocols used for automation. The increasing automation trend is expected to drive the demand for industrial gear oils, ensuring the seamless functioning of manufacturing processes around the clock.

What are the market trends shaping the Industrial Gear Oil Industry?

  • An increasing number of industry-specific products is the upcoming market trend. The market is witnessing significant growth due to the increasing production of industry-specific gear oils. Two primary types of players operate in this market: those providing generic products and those manufacturing industry-specific solutions. In times, there has been a noteworthy focus among companies to cater to the unique requirements of various industries. For instance, Royal Dutch Shell and Exxon Mobil Corporation are major players in the market, offering comprehensive lubricant solutions tailored to specific industries through their respective branches.
  • Exxon Mobil's Mobil Serv Engineering Services provides a complete range of plant studies and lubricant solutions. This strategic approach allows these companies to meet the evolving needs of their customers and maintain a competitive edge.

What challenges does the Industrial Gear Oil Industry face during its growth?

  • Volatility in raw material prices is a key challenge affecting the industry's growth. Industrial gear oils are predominantly manufactured using raw materials derived from paraffin-based mineral oils, synthetic polyalkylene glycols, synthetic esters, and synthetic polyalphaolefins, primarily sourced from the oil and gas industry. The oil and gas sector serves as a significant contributor to the market due to its role as a primary supplier of raw materials. The volatility of crude oil prices significantly influences the cost of these raw materials and, consequently, the price of industrial gear oils. In the past few years, the unpredictable fluctuations in oil prices have compelled oil and gas industry players to adopt cost-saving strategies, such as workforce reduction and rig idling.
  • As of December 2023, the price of Brent crude oil stood at USD 78 per barrel. This price instability underscores the importance of monitoring and managing raw material costs for market participants in the industrial gear oil sector.

Exclusive Customer Landscape

The industrial gear oil market forecasting report includes the adoption lifecycle of the market, covering from the innovator's stage to the laggard's stage. It focuses on adoption rates in different regions based on penetration. Furthermore, the industrial gear oil market report also includes key purchase criteria and drivers of price sensitivity to help companies evaluate and develop their market growth analysis strategies.

Industrial Gear Oil Market Share by Geography

 Customer Landscape

Key Companies & Market Insights

Companies are implementing various strategies, such as strategic alliances, industrial gear oil market forecast, partnerships, mergers and acquisitions, geographical expansion, and product/service launches, to enhance their presence in the industry.

ADVANCED LUBRICATION SPECIALTIES - The company offers industrial gear oil such as Advantage AMP Gear Oils, and Advantage EP Gear Oils.

The industry research and growth report includes detailed analyses of the competitive landscape of the market and information about key companies, including:

  • ADVANCED LUBRICATION SPECIALTIES
  • AMALIE OIL CO.
  • Apar Industries Ltd.
  • BASF SE
  • BP Plc
  • Chevron Corp.
  • China Petrochemical Corp.
  • Croda International Plc
  • Exxon Mobil Corp.
  • FUCHS SE
  • Gandhar Oil Refinery India Ltd.
  • Hinduja Group Ltd.
  • Petroleos de Venezuela SA
  • Petromin Corp.
  • PJSC LUKOIL
  • Shell plc
  • TotalEnergies SE
  • Valvoline Inc.

Qualitative and quantitative analysis of companies has been conducted to help clients understand the wider business environment as well as the strengths and weaknesses of key industry players. Data is qualitatively analyzed to categorize companies as pure play, category-focused, industry-focused, and diversified; it is quantitatively analyzed to categorize companies as dominant, leading, strong, tentative, and weak.

Research Analyst Overview

Industrial gear oils play a vital role in the efficient operation of various machinery and equipment across numerous industries. These specialized lubricants are designed to provide superior performance in high-load, high-stress applications, ensuring the longevity and productivity of hydraulic systems, construction machinery, marine gears, wind turbines, and other industrial gearboxes. The market for industrial gear oils is driven by several key factors. One significant trend is the increasing demand for extended oil life, which is achieved through advanced formulations that offer enhanced oxidation resistance and thermal stability. This not only reduces the frequency of oil changes but also lowers maintenance costs and downtime.

Another critical aspect of the market is the focus on product certifications and quality assurance. As industries strive for improved machinery efficiency and sustainability, there is a growing emphasis on performance testing and data analytics to ensure lubricant compatibility and optimize lubrication management. Moreover, the shift towards renewable resources and sustainable lubricants is gaining momentum. Bio-based lubricants and synthetic gear oils derived from renewable sources are increasingly being adopted to reduce the environmental impact of industrial operations. This trend is particularly prevalent in industries such as mining, aerospace, and automotive, where the use of heavy-duty equipment and large industrial gearboxes necessitates the use of high-performance lubricants.

Furthermore, predictive maintenance and condition monitoring are becoming essential components of effective lubrication management. Remote monitoring and oil analysis enable early detection of potential issues, allowing for timely maintenance and reducing the risk of unexpected downtime. In the realm of power transmission, there is a growing focus on lubrication optimization and energy conservation. Mineral gear oil and synthetic gear oil formulations with improved viscosity index and load-carrying capacity are being developed to enhance machinery efficiency and reduce energy consumption. The circular economy is also influencing the market, with a growing emphasis on life cycle analysis and the reuse and recycling of lubricants.

This not only helps to reduce waste and minimize the environmental impact of industrial operations but also lowers costs by extending the useful life of lubricants. The market is characterized by continuous innovation and a focus on enhancing machinery efficiency, reducing downtime, and minimizing environmental impact. The adoption of advanced technologies such as predictive maintenance, condition monitoring, and data analytics is driving the development of high-performance lubricants, while the shift towards renewable resources and sustainable lubricants is gaining momentum. The market is expected to remain dynamic, with ongoing research and development efforts aimed at improving lubricant performance, reducing costs, and minimizing environmental impact.

Market Scope

Report Coverage

Details

Page number

242

Base year

2024

Historic period

2019-2023

Forecast period

2025-2029

Growth momentum & CAGR

Accelerate at a CAGR of 2.7%

Market growth 2025-2029

USD 105.7 million

Market structure

Fragmented

YoY growth 2024-2025(%)

2.6

Key countries

US, China, Canada, Mexico, Brazil, India, Germany, Japan, France, and UK

Competitive landscape

Leading Companies, Market Positioning of Companies, Competitive Strategies, and Industry Risks

Request Free Sample

What are the Key Data Covered in this Industrial Gear Oil Market Research and Growth Report?

  • CAGR of the Industrial Gear Oil industry during the forecast period
  • Detailed information on factors that will drive the growth and forecasting between 2025 and 2029
  • Precise estimation of the size of the market and its contribution of the industry in focus to the parent market
  • Accurate predictions about upcoming growth and trends and changes in consumer behaviour
  • Growth of the market across North America, APAC, Europe, South America, and Middle East and Africa
  • Thorough analysis of the market's competitive landscape and detailed information about companies
  • Comprehensive analysis of factors that will challenge the industrial gear oil market growth and forecasting

We can help! Our analysts can customize this industrial gear oil market research report to meet your requirements.

Get in touch

1 Executive Summary

  • 1.1 Market overview
    • Executive Summary - Chart on Market Overview
    • Executive Summary - Data Table on Market Overview
    • Executive Summary - Chart on Global Market Characteristics
    • Executive Summary - Chart on Market by Geography
    • Executive Summary - Chart on Market Segmentation by Application
    • Executive Summary - Chart on Market Segmentation by Product
    • Executive Summary - Chart on Market Segmentation by Variant
    • Executive Summary - Chart on Incremental Growth
    • Executive Summary - Data Table on Incremental Growth
    • Executive Summary - Chart on Company Market Positioning

2 Technavio Analysis

  • 2.1 Analysis of price sensitivity, lifecycle, customer purchase basket, adoption rates, and purchase criteria
    • Analysis of price sensitivity, lifecycle, customer purchase basket, adoption rates, and purchase criteria
  • 2.2 Criticality of inputs and Factors of differentiation
    • Overview on criticality of inputs and factors of differentiation
  • 2.3 Factors of disruption
    • Overview on factors of disruption
  • 2.4 Impact of drivers and challenges
    • Impact of drivers and challenges in 2024 and 2029

3 Market Landscape

  • 3.1 Market ecosystem
    • Parent Market
    • Data Table on - Parent Market
  • 3.2 Market characteristics
    • Market characteristics analysis
  • 3.3 Value chain analysis
    • Value chain analysis

4 Market Sizing

  • 4.1 Market definition
    • Offerings of companies included in the market definition
  • 4.2 Market segment analysis
    • Market segments
  • 4.3 Market size 2024
    • 4.4 Market outlook: Forecast for 2024-2029
      • Chart on Global - Market size and forecast 2024-2029 ($ million)
      • Data Table on Global - Market size and forecast 2024-2029 ($ million)
      • Chart on Global Market: Year-over-year growth 2024-2029 (%)
      • Data Table on Global Market: Year-over-year growth 2024-2029 (%)

    5 Historic Market Size

    • 5.1 Global Industrial Gear Oil Market 2019 - 2023
      • Historic Market Size - Data Table on Global Industrial Gear Oil Market 2019 - 2023 ($ million)
    • 5.2 Application segment analysis 2019 - 2023
      • Historic Market Size - Application Segment 2019 - 2023 ($ million)
    • 5.3 Product segment analysis 2019 - 2023
      • Historic Market Size - Product Segment 2019 - 2023 ($ million)
    • 5.4 Variant segment analysis 2019 - 2023
      • Historic Market Size - Variant Segment 2019 - 2023 ($ million)
    • 5.5 Geography segment analysis 2019 - 2023
      • Historic Market Size - Geography Segment 2019 - 2023 ($ million)
    • 5.6 Country segment analysis 2019 - 2023
      • Historic Market Size - Country Segment 2019 - 2023 ($ million)

    6 Qualitative Analysis

    • 6.1 Impact of AI on Global Industrial Gear Oil Market

      7 Five Forces Analysis

      • 7.1 Five forces summary
        • Five forces analysis - Comparison between 2024 and 2029
      • 7.2 Bargaining power of buyers
        • Bargaining power of buyers - Impact of key factors 2024 and 2029
      • 7.3 Bargaining power of suppliers
        • Bargaining power of suppliers - Impact of key factors in 2024 and 2029
      • 7.4 Threat of new entrants
        • Threat of new entrants - Impact of key factors in 2024 and 2029
      • 7.5 Threat of substitutes
        • Threat of substitutes - Impact of key factors in 2024 and 2029
      • 7.6 Threat of rivalry
        • Threat of rivalry - Impact of key factors in 2024 and 2029
      • 7.7 Market condition
        • Chart on Market condition - Five forces 2024 and 2029

      8 Market Segmentation by Application

      • 8.1 Market segments
        • Chart on Application - Market share 2024-2029 (%)
        • Data Table on Application - Market share 2024-2029 (%)
      • 8.2 Comparison by Application
        • Chart on Comparison by Application
        • Data Table on Comparison by Application
      • 8.3 Manufacturing - Market size and forecast 2024-2029
        • Chart on Manufacturing - Market size and forecast 2024-2029 ($ million)
        • Data Table on Manufacturing - Market size and forecast 2024-2029 ($ million)
        • Chart on Manufacturing - Year-over-year growth 2024-2029 (%)
        • Data Table on Manufacturing - Year-over-year growth 2024-2029 (%)
      • 8.4 Mining - Market size and forecast 2024-2029
        • Chart on Mining - Market size and forecast 2024-2029 ($ million)
        • Data Table on Mining - Market size and forecast 2024-2029 ($ million)
        • Chart on Mining - Year-over-year growth 2024-2029 (%)
        • Data Table on Mining - Year-over-year growth 2024-2029 (%)
      • 8.5 Agriculture - Market size and forecast 2024-2029
        • Chart on Agriculture - Market size and forecast 2024-2029 ($ million)
        • Data Table on Agriculture - Market size and forecast 2024-2029 ($ million)
        • Chart on Agriculture - Year-over-year growth 2024-2029 (%)
        • Data Table on Agriculture - Year-over-year growth 2024-2029 (%)
      • 8.6 Energy - Market size and forecast 2024-2029
        • Chart on Energy - Market size and forecast 2024-2029 ($ million)
        • Data Table on Energy - Market size and forecast 2024-2029 ($ million)
        • Chart on Energy - Year-over-year growth 2024-2029 (%)
        • Data Table on Energy - Year-over-year growth 2024-2029 (%)
      • 8.7 Others - Market size and forecast 2024-2029
        • Chart on Others - Market size and forecast 2024-2029 ($ million)
        • Data Table on Others - Market size and forecast 2024-2029 ($ million)
        • Chart on Others - Year-over-year growth 2024-2029 (%)
        • Data Table on Others - Year-over-year growth 2024-2029 (%)
      • 8.8 Market opportunity by Application
        • Market opportunity by Application ($ million)
        • Data Table on Market opportunity by Application ($ million)

      9 Market Segmentation by Product

      • 9.1 Market segments
        • Chart on Product - Market share 2024-2029 (%)
        • Data Table on Product - Market share 2024-2029 (%)
      • 9.2 Comparison by Product
        • Chart on Comparison by Product
        • Data Table on Comparison by Product
      • 9.3 Mineral - Market size and forecast 2024-2029
        • Chart on Mineral - Market size and forecast 2024-2029 ($ million)
        • Data Table on Mineral - Market size and forecast 2024-2029 ($ million)
        • Chart on Mineral - Year-over-year growth 2024-2029 (%)
        • Data Table on Mineral - Year-over-year growth 2024-2029 (%)
      • 9.4 Synthetic - Market size and forecast 2024-2029
        • Chart on Synthetic - Market size and forecast 2024-2029 ($ million)
        • Data Table on Synthetic - Market size and forecast 2024-2029 ($ million)
        • Chart on Synthetic - Year-over-year growth 2024-2029 (%)
        • Data Table on Synthetic - Year-over-year growth 2024-2029 (%)
      • 9.5 Semi-synthetic - Market size and forecast 2024-2029
        • Chart on Semi-synthetic - Market size and forecast 2024-2029 ($ million)
        • Data Table on Semi-synthetic - Market size and forecast 2024-2029 ($ million)
        • Chart on Semi-synthetic - Year-over-year growth 2024-2029 (%)
        • Data Table on Semi-synthetic - Year-over-year growth 2024-2029 (%)
      • 9.6 Bio-based - Market size and forecast 2024-2029
        • Chart on Bio-based - Market size and forecast 2024-2029 ($ million)
        • Data Table on Bio-based - Market size and forecast 2024-2029 ($ million)
        • Chart on Bio-based - Year-over-year growth 2024-2029 (%)
        • Data Table on Bio-based - Year-over-year growth 2024-2029 (%)
      • 9.7 Market opportunity by Product
        • Market opportunity by Product ($ million)
        • Data Table on Market opportunity by Product ($ million)

      10 Market Segmentation by Variant

      • 10.1 Market segments
        • Chart on Variant - Market share 2024-2029 (%)
        • Data Table on Variant - Market share 2024-2029 (%)
      • 10.2 Comparison by Variant
        • Chart on Comparison by Variant
        • Data Table on Comparison by Variant
      • 10.3 ISO VG 320 - Market size and forecast 2024-2029
        • Chart on ISO VG 320 - Market size and forecast 2024-2029 ($ million)
        • Data Table on ISO VG 320 - Market size and forecast 2024-2029 ($ million)
        • Chart on ISO VG 320 - Year-over-year growth 2024-2029 (%)
        • Data Table on ISO VG 320 - Year-over-year growth 2024-2029 (%)
      • 10.4 ISO VG 220 - Market size and forecast 2024-2029
        • Chart on ISO VG 220 - Market size and forecast 2024-2029 ($ million)
        • Data Table on ISO VG 220 - Market size and forecast 2024-2029 ($ million)
        • Chart on ISO VG 220 - Year-over-year growth 2024-2029 (%)
        • Data Table on ISO VG 220 - Year-over-year growth 2024-2029 (%)
      • 10.5 ISO VG 460 - Market size and forecast 2024-2029
        • Chart on ISO VG 460 - Market size and forecast 2024-2029 ($ million)
        • Data Table on ISO VG 460 - Market size and forecast 2024-2029 ($ million)
        • Chart on ISO VG 460 - Year-over-year growth 2024-2029 (%)
        • Data Table on ISO VG 460 - Year-over-year growth 2024-2029 (%)
      • 10.6 Others - Market size and forecast 2024-2029
        • Chart on Others - Market size and forecast 2024-2029 ($ million)
        • Data Table on Others - Market size and forecast 2024-2029 ($ million)
        • Chart on Others - Year-over-year growth 2024-2029 (%)
        • Data Table on Others - Year-over-year growth 2024-2029 (%)
      • 10.7 Market opportunity by Variant
        • Market opportunity by Variant ($ million)
        • Data Table on Market opportunity by Variant ($ million)

      11 Customer Landscape

      • 11.1 Customer landscape overview
        • Analysis of price sensitivity, lifecycle, customer purchase basket, adoption rates, and purchase criteria

      12 Geographic Landscape

      • 12.1 Geographic segmentation
        • Chart on Market share by geography 2024-2029 (%)
        • Data Table on Market share by geography 2024-2029 (%)
      • 12.2 Geographic comparison
        • Chart on Geographic comparison
        • Data Table on Geographic comparison
      • 12.3 North America - Market size and forecast 2024-2029
        • Chart on North America - Market size and forecast 2024-2029 ($ million)
        • Data Table on North America - Market size and forecast 2024-2029 ($ million)
        • Chart on North America - Year-over-year growth 2024-2029 (%)
        • Data Table on North America - Year-over-year growth 2024-2029 (%)
      • 12.4 APAC - Market size and forecast 2024-2029
        • Chart on APAC - Market size and forecast 2024-2029 ($ million)
        • Data Table on APAC - Market size and forecast 2024-2029 ($ million)
        • Chart on APAC - Year-over-year growth 2024-2029 (%)
        • Data Table on APAC - Year-over-year growth 2024-2029 (%)
      • 12.5 Europe - Market size and forecast 2024-2029
        • Chart on Europe - Market size and forecast 2024-2029 ($ million)
        • Data Table on Europe - Market size and forecast 2024-2029 ($ million)
        • Chart on Europe - Year-over-year growth 2024-2029 (%)
        • Data Table on Europe - Year-over-year growth 2024-2029 (%)
      • 12.6 South America - Market size and forecast 2024-2029
        • Chart on South America - Market size and forecast 2024-2029 ($ million)
        • Data Table on South America - Market size and forecast 2024-2029 ($ million)
        • Chart on South America - Year-over-year growth 2024-2029 (%)
        • Data Table on South America - Year-over-year growth 2024-2029 (%)
      • 12.7 Middle East and Africa - Market size and forecast 2024-2029
        • Chart on Middle East and Africa - Market size and forecast 2024-2029 ($ million)
        • Data Table on Middle East and Africa - Market size and forecast 2024-2029 ($ million)
        • Chart on Middle East and Africa - Year-over-year growth 2024-2029 (%)
        • Data Table on Middle East and Africa - Year-over-year growth 2024-2029 (%)
      • 12.8 US - Market size and forecast 2024-2029
        • Chart on US - Market size and forecast 2024-2029 ($ million)
        • Data Table on US - Market size and forecast 2024-2029 ($ million)
        • Chart on US - Year-over-year growth 2024-2029 (%)
        • Data Table on US - Year-over-year growth 2024-2029 (%)
      • 12.9 China - Market size and forecast 2024-2029
        • Chart on China - Market size and forecast 2024-2029 ($ million)
        • Data Table on China - Market size and forecast 2024-2029 ($ million)
        • Chart on China - Year-over-year growth 2024-2029 (%)
        • Data Table on China - Year-over-year growth 2024-2029 (%)
      • 12.10 Canada - Market size and forecast 2024-2029
        • Chart on Canada - Market size and forecast 2024-2029 ($ million)
        • Data Table on Canada - Market size and forecast 2024-2029 ($ million)
        • Chart on Canada - Year-over-year growth 2024-2029 (%)
        • Data Table on Canada - Year-over-year growth 2024-2029 (%)
      • 12.11 Mexico - Market size and forecast 2024-2029
        • Chart on Mexico - Market size and forecast 2024-2029 ($ million)
        • Data Table on Mexico - Market size and forecast 2024-2029 ($ million)
        • Chart on Mexico - Year-over-year growth 2024-2029 (%)
        • Data Table on Mexico - Year-over-year growth 2024-2029 (%)
      • 12.12 India - Market size and forecast 2024-2029
        • Chart on India - Market size and forecast 2024-2029 ($ million)
        • Data Table on India - Market size and forecast 2024-2029 ($ million)
        • Chart on India - Year-over-year growth 2024-2029 (%)
        • Data Table on India - Year-over-year growth 2024-2029 (%)
      • 12.13 Japan - Market size and forecast 2024-2029
        • Chart on Japan - Market size and forecast 2024-2029 ($ million)
        • Data Table on Japan - Market size and forecast 2024-2029 ($ million)
        • Chart on Japan - Year-over-year growth 2024-2029 (%)
        • Data Table on Japan - Year-over-year growth 2024-2029 (%)
      • 12.14 Brazil - Market size and forecast 2024-2029
        • Chart on Brazil - Market size and forecast 2024-2029 ($ million)
        • Data Table on Brazil - Market size and forecast 2024-2029 ($ million)
        • Chart on Brazil - Year-over-year growth 2024-2029 (%)
        • Data Table on Brazil - Year-over-year growth 2024-2029 (%)
      • 12.15 Germany - Market size and forecast 2024-2029
        • Chart on Germany - Market size and forecast 2024-2029 ($ million)
        • Data Table on Germany - Market size and forecast 2024-2029 ($ million)
        • Chart on Germany - Year-over-year growth 2024-2029 (%)
        • Data Table on Germany - Year-over-year growth 2024-2029 (%)
      • 12.16 UK - Market size and forecast 2024-2029
        • Chart on UK - Market size and forecast 2024-2029 ($ million)
        • Data Table on UK - Market size and forecast 2024-2029 ($ million)
        • Chart on UK - Year-over-year growth 2024-2029 (%)
        • Data Table on UK - Year-over-year growth 2024-2029 (%)
      • 12.17 France - Market size and forecast 2024-2029
        • Chart on France - Market size and forecast 2024-2029 ($ million)
        • Data Table on France - Market size and forecast 2024-2029 ($ million)
        • Chart on France - Year-over-year growth 2024-2029 (%)
        • Data Table on France - Year-over-year growth 2024-2029 (%)
      • 12.18 Market opportunity by geography
        • Market opportunity by geography ($ million)
        • Data Tables on Market opportunity by geography ($ million)

      13 Drivers, Challenges, and Opportunity/Restraints

      • 13.1 Market drivers
        • 13.2 Market challenges
          • 13.3 Impact of drivers and challenges
            • Impact of drivers and challenges in 2024 and 2029
          • 13.4 Market opportunities/restraints

            14 Competitive Landscape

            • 14.1 Overview
              • 14.2 Competitive Landscape
                • Overview on criticality of inputs and factors of differentiation
              • 14.3 Landscape disruption
                • Overview on factors of disruption
              • 14.4 Industry risks
                • Impact of key risks on business

              15 Competitive Analysis

              • 15.1 Companies profiled
                • Companies covered
              • 15.2 Company ranking index
                • Company ranking index
              • 15.3 Market positioning of companies
                • Matrix on companies position and classification
              • 15.4 ADVANCED LUBRICATION SPECIALTIES
                • ADVANCED LUBRICATION SPECIALTIES - Overview
                • ADVANCED LUBRICATION SPECIALTIES - Product / Service
                • ADVANCED LUBRICATION SPECIALTIES - Key offerings
                • SWOT
              • 15.5 AMALIE OIL CO.
                • AMALIE OIL CO. - Overview
                • AMALIE OIL CO. - Product / Service
                • AMALIE OIL CO. - Key offerings
                • SWOT
              • 15.6 Apar Industries Ltd.
                • Apar Industries Ltd. - Overview
                • Apar Industries Ltd. - Business segments
                • Apar Industries Ltd. - Key offerings
                • Apar Industries Ltd. - Segment focus
                • SWOT
              • 15.7 BASF SE
                • BASF SE - Overview
                • BASF SE - Business segments
                • BASF SE - Key news
                • BASF SE - Key offerings
                • BASF SE - Segment focus
                • SWOT
              • 15.8 BP Plc
                • BP Plc - Overview
                • BP Plc - Business segments
                • BP Plc - Key news
                • BP Plc - Key offerings
                • BP Plc - Segment focus
                • SWOT
              • 15.9 Chevron Corp.
                • Chevron Corp. - Overview
                • Chevron Corp. - Business segments
                • Chevron Corp. - Key news
                • Chevron Corp. - Key offerings
                • Chevron Corp. - Segment focus
                • SWOT
              • 15.10 China Petrochemical Corp.
                • China Petrochemical Corp. - Overview
                • China Petrochemical Corp. - Business segments
                • China Petrochemical Corp. - Key offerings
                • China Petrochemical Corp. - Segment focus
                • SWOT
              • 15.11 Croda International Plc
                • Croda International Plc - Overview
                • Croda International Plc - Business segments
                • Croda International Plc - Key news
                • Croda International Plc - Key offerings
                • Croda International Plc - Segment focus
                • SWOT
              • 15.12 Exxon Mobil Corp.
                • Exxon Mobil Corp. - Overview
                • Exxon Mobil Corp. - Business segments
                • Exxon Mobil Corp. - Key news
                • Exxon Mobil Corp. - Key offerings
                • Exxon Mobil Corp. - Segment focus
                • SWOT
              • 15.13 FUCHS SE
                • FUCHS SE - Overview
                • FUCHS SE - Business segments
                • FUCHS SE - Key news
                • FUCHS SE - Key offerings
                • FUCHS SE - Segment focus
                • SWOT
              • 15.14 Petroleos de Venezuela SA
                • Petroleos de Venezuela SA - Overview
                • Petroleos de Venezuela SA - Product / Service
                • Petroleos de Venezuela SA - Key offerings
                • SWOT
              • 15.15 Petromin Corp.
                • Petromin Corp. - Overview
                • Petromin Corp. - Product / Service
                • Petromin Corp. - Key offerings
                • SWOT
              • 15.16 PJSC LUKOIL
                • PJSC LUKOIL - Overview
                • PJSC LUKOIL - Product / Service
                • PJSC LUKOIL - Key offerings
                • SWOT
              • 15.17 Shell plc
                • Shell plc - Overview
                • Shell plc - Business segments
                • Shell plc - Key news
                • Shell plc - Key offerings
                • Shell plc - Segment focus
                • SWOT
              • 15.18 TotalEnergies SE
                • TotalEnergies SE - Overview
                • TotalEnergies SE - Business segments
                • TotalEnergies SE - Key news
                • TotalEnergies SE - Key offerings
                • TotalEnergies SE - Segment focus
                • SWOT

              16 Appendix

              • 16.1 Scope of the report
                • 16.2 Inclusions and exclusions checklist
                  • Inclusions checklist
                  • Exclusions checklist
                • 16.3 Currency conversion rates for US$
                  • Currency conversion rates for US$
                • 16.4 Research methodology
                  • Research methodology
                • 16.5 Data procurement
                  • Information sources
                • 16.6 Data validation
                  • Data validation
                • 16.7 Validation techniques employed for market sizing
                  • Validation techniques employed for market sizing
                • 16.8 Data synthesis
                  • Data synthesis
                • 16.9 360 degree market analysis
                  • 360 degree market analysis
                • 16.10 List of abbreviations
                  • List of abbreviations

                Research Methodology

                Technavio presents a detailed picture of the market by way of study, synthesis, and summation of data from multiple sources. The analysts have presented the various facets of the market with a particular focus on identifying the key industry influencers. The data thus presented is comprehensive, reliable, and the result of extensive research, both primary and secondary.

                INFORMATION SOURCES

                Primary sources

                • Manufacturers and suppliers
                • Channel partners
                • Industry experts
                • Strategic decision makers

                Secondary sources

                • Industry journals and periodicals
                • Government data
                • Financial reports of key industry players
                • Historical data
                • Press releases

                DATA ANALYSIS

                Data Synthesis

                • Collation of data
                • Estimation of key figures
                • Analysis of derived insights

                Data Validation

                • Triangulation with data models
                • Reference against proprietary databases
                • Corroboration with industry experts

                REPORT WRITING

                Qualitative

                • Market drivers
                • Market challenges
                • Market trends
                • Five forces analysis

                Quantitative

                • Market size and forecast
                • Market segmentation
                • Geographical insights
                • Competitive landscape

                Interested in this report?

                Get your sample now to see our research methodology and insights!

                Download Now

                Frequently Asked Questions

                Industrial Gear Oil market growth will increase by $ 105.7 mn during 2025-2029 .

                The Industrial Gear Oil market is expected to grow at a CAGR of 2.7% during 2025-2029 .

                Industrial Gear Oil market is segmented by Application( Manufacturing, Mining, Agriculture, Energy, Others) Product( Mineral, Synthetic, Semi-synthetic, Bio-based) Variant( ISO VG 320, ISO VG 220, ISO VG 460, Others, Middle East and Africa)

                ADVANCED LUBRICATION SPECIALTIES, AMALIE OIL CO., Apar Industries Ltd., BASF SE, BP Plc, Chevron Corp., China Petrochemical Corp., Croda International Plc, Exxon Mobil Corp., FUCHS SE, Gandhar Oil Refinery India Ltd., Hinduja Group Ltd., Petroleos de Venezuela SA, Petromin Corp., PJSC LUKOIL, Shell plc, TotalEnergies SE, Valvoline Inc. are a few of the key vendors in the Industrial Gear Oil market.

                APAC will register the highest growth rate of 38% among the other regions. Therefore, the Industrial Gear Oil market in APAC is expected to garner significant business opportunities for the vendors during the forecast period.

                US, China, Canada, Mexico, Brazil, India, Germany, Japan, France, UK

                • Increase in plant automationThe plant automated systems are capable of continuous operations; thus is the driving factor this market.
                • they are more prone to higher failure rates. As the rate of automation will increase in the future is the driving factor this market.
                • it will lead to a rise in demand for 24/7 automated monitoring systems is the driving factor this market.
                • which will is the driving factor this market.
                • in turn is the driving factor this market.
                • lead to higher demand for industrial gear oil.The increasing demand for products that are superior in quality due to globalization and population growth has propelled companies to undertake automation in manufacturing. Investment in global process automation is continuing to grow at 7% by end of 2025. This growth is focused on areas such as technology is the driving factor this market.
                • hardware is the driving factor this market.
                • software is the driving factor this market.
                • services and the communication protocol used for automation. The most important benefit that companies gain from adopting process automation is the increase in productivity is the driving factor this market.
                • which has a domino effect on growth. For most companies is the driving factor this market.
                • implementing process automation leads to growing profits is the driving factor this market.
                • while for others is the driving factor this market.
                • it has a bearing on resource regulation and loss control. In any case is the driving factor this market.
                • improving efficiency to enhance all over operations gives considerable benefits to all companies.The addition of an element of automation to a manufacturing companys production or fabrication process increases its competitive edge and enables it to reduce costs through the displacement of staff and increase productivity (as many robots can run 24/7). However is the driving factor this market.
                • the increase in productivity has also increased the run time of the machinery and speed of the equipment is the driving factor this market.
                • which has increased the importance of adequate lubrication on the load-bearing surfaces of the equipment. One of the most common and major causes of failure in equipment is due to the improper lubrication of the gearbox is the driving factor this market.
                • and the replacement of each gearbox typically takes about three hours in process plants like the paper and petrochemicals industry. Typically is the driving factor this market.
                • in a process industry is the driving factor this market.
                • downtime will cost between $10 is the driving factor this market.
                • 000 to $150 is the driving factor this market.
                • 000 is the driving factor this market.
                • which can cause high production loss. As gearbox failure has a direct impact on the production cycle is the driving factor this market.
                • it has driven the importance of having well-lubricated machinery and equipment is the driving factor this market.
                • which is the main driver for the increasing demand for industrial gear oil. Thus is the driving factor this market.
                • such factors will boost the growth of the global industrial gear oil market during the forecast period. is the driving factor this market.

                The Industrial Gear Oil market vendors should focus on grabbing business opportunities from the Manufacturing segment as it accounted for the largest market share in the base year.