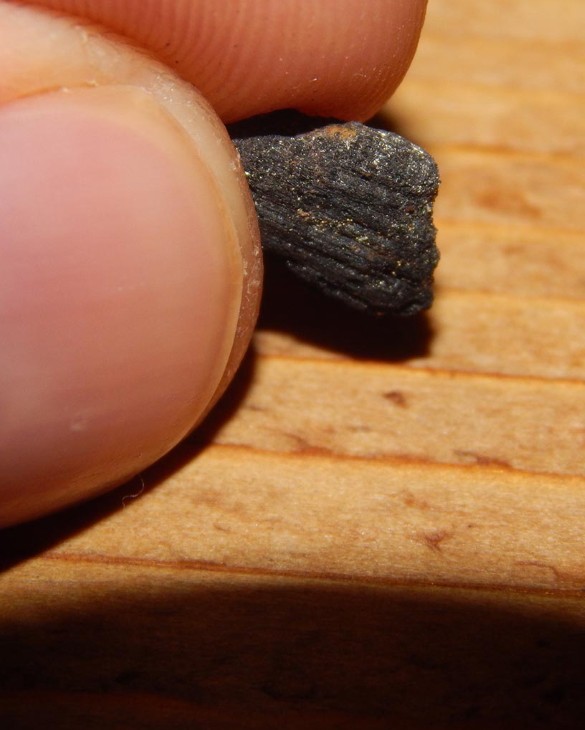
Biochar Market Analysis, Size, and Forecast 2026-2030: North America (US, Canada, and Mexico), APAC (China, India, and Japan), Europe (Germany, UK, and The Netherlands), South America (Brazil, Argentina, and Chile), Middle East and Africa (South Africa, Saudi Arabia, and UAE), and Rest of World (ROW)

Biochar Market Analysis, Size, and Forecast 2026-2030:
North America (US, Canada, and Mexico), APAC (China, India, and Japan), Europe (Germany, UK, and The Netherlands), South America (Brazil, Argentina, and Chile), Middle East and Africa (South Africa, Saudi Arabia, and UAE), and Rest of World (ROW)

Published: Oct 2026 298 Pages SKU: IRTNTR71846

Market Overview at a Glance

$3.19 B
Market Opportunity
15.6%
CAGR 2025 - 2030
35.2%
North America Growth
$1.13 B
Farming segment 2024

Biochar Market Size 2026-2030

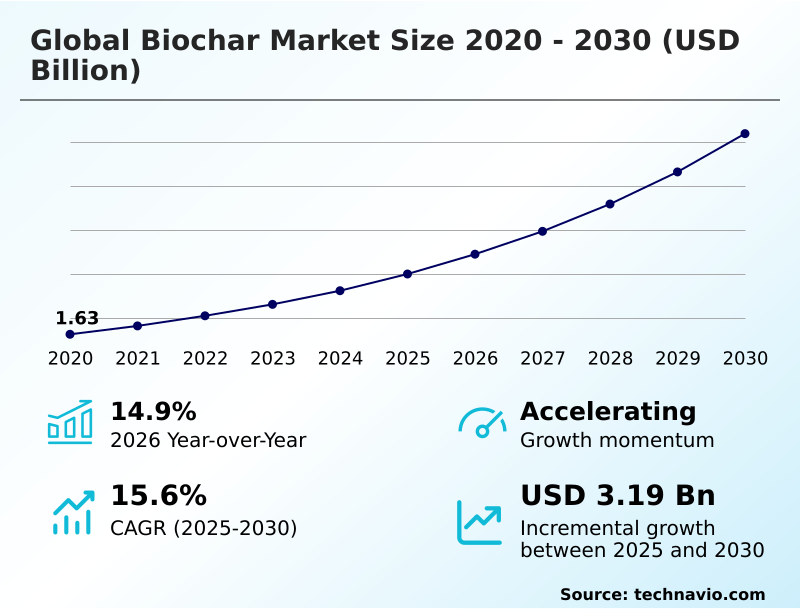
The biochar market size is valued to increase by USD 3.19 billion, at a CAGR of 15.6% from 2025 to 2030. Rising global demand for carbon sequestration and climate change mitigation will drive the biochar market.

Major Market Trends & Insights

  • North America dominated the market and accounted for a 35.2% growth during the forecast period.
  • By Application - Farming segment was valued at USD 1.13 billion in 2024
  • By Technology - Pyrolysis segment accounted for the largest market revenue share in 2024

Market Size & Forecast

  • Market Opportunities: USD 4.56 billion
  • Market Future Opportunities: USD 3.19 billion
  • CAGR from 2025 to 2030 : 15.6%

Market Summary

  • The Biochar Market exhibits robust expansion as heavy industries and agricultural sectors prioritize durable carbon management alongside soil rehabilitation. Expanding environmental mandates push organizations to utilize engineered pyrolytic materials for long-term climate neutralization. The rising demand for permanent carbon immobilization acts as a formidable market driver, enabling agricultural cooperatives to generate secondary revenue through certified emission reduction credits.
  • Conversely, high capital expenditures associated with deploying continuous thermal processing units create significant friction, severely limiting infrastructure adoption among mid-sized enterprises. In a recent supply chain optimization scenario, regional biomass aggregators centralized their chipping and drying operations near sawmill hubs, cutting logistical friction and lowering raw material transport costs.
  • These streamlined operations allowed processors to achieve a 15% reduction in overall manufacturing overhead compared to decentralized procurement models. Modern pyrolysis facilities now capture volatile syngas to sustain thermal autonomy, minimizing reliance on fossil fuels. Ultimately, aligning residue valorization with regenerative agricultural inputs secures a resilient operational framework for the bio-based economy.

What will be the Size of the Biochar Market during the forecast period?
Get Key Insights on Market Forecast (PDF) Get Free Sample

How is the Biochar Market Segmented?

The biochar industry research report provides comprehensive data (region-wise segment analysis), with forecasts and estimates in "USD million" for the period 2026-2030, as well as historical data from 2020-2024 for the following segments.

  • Application
    • Farming
    • Livestock
    • Others
  • Technology
    • Pyrolysis
    • Gasification
    • Others
  • Form factor
    • Fine powder
    • Coarse and fine chips
    • Pellets and granules
    • Liquid suspension
  • Geography
    • North America
      • US
      • Canada
      • Mexico
    • APAC
      • China
      • India
      • Japan
      • Australia
      • South Korea
      • Indonesia
    • Europe
      • Germany
      • UK
      • The Netherlands
      • France
      • Italy
      • Spain
    • South America
      • Brazil
      • Argentina
      • Chile
    • Middle East and Africa
      • South Africa
      • Saudi Arabia
      • UAE
      • Israel
      • Egypt

By Application Insights

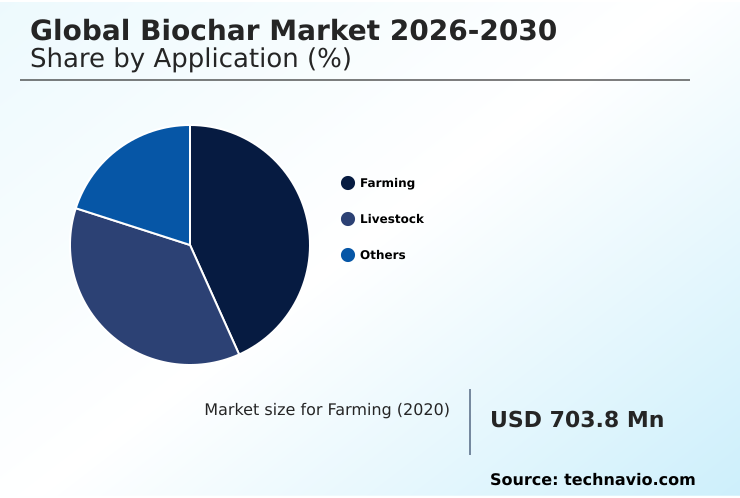
The farming segment is estimated to witness significant growth during the forecast period.

The farming segment within the Biochar industry represents the foundational driver for sustainable land management, optimizing both soil mechanics and long-term crop productivity.

Broad-acre farming operations increasingly rely on this porous carbon matrix to stabilize micro-nutrients directly within the plant root zone, driving critical agronomic nutrient retention.

By integrating pelletized biocarbon formulation into standard precision agriculture equipment, cultivators effectively counteract topsoil degradation and accelerate agricultural residue valorization. This structural enhancement to the soil architecture actively supports regenerative soil conditioning, creating ideal habitats for beneficial microbiota.

Operational efficiency across commercial horticulture has substantially improved as fertilizer runoff declined by 22%, directly elevating crop yield optimization. Furthermore, establishing dual revenue streams through verified carbon sequestration capacity provides strong financial incentives for modern agribusinesses.
Get Free Sample

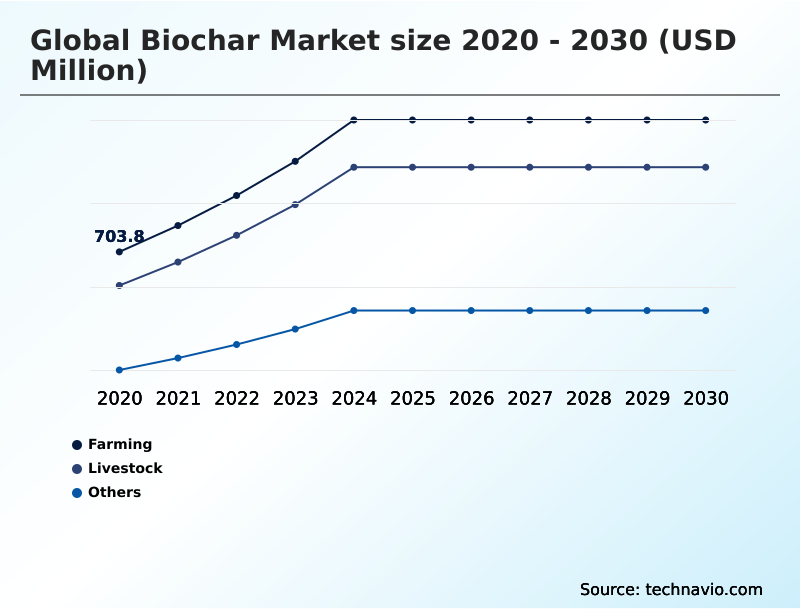
The Farming segment was valued at USD 1.13 billion in 2024 and showed a gradual increase during the forecast period.
Get Free Sample

Regional Analysis

North America is estimated to contribute 35.2% to the growth of the global market during the forecast period.Technavio’s analysts have elaborately explained the regional trends and drivers that shape the market during the forecast period.
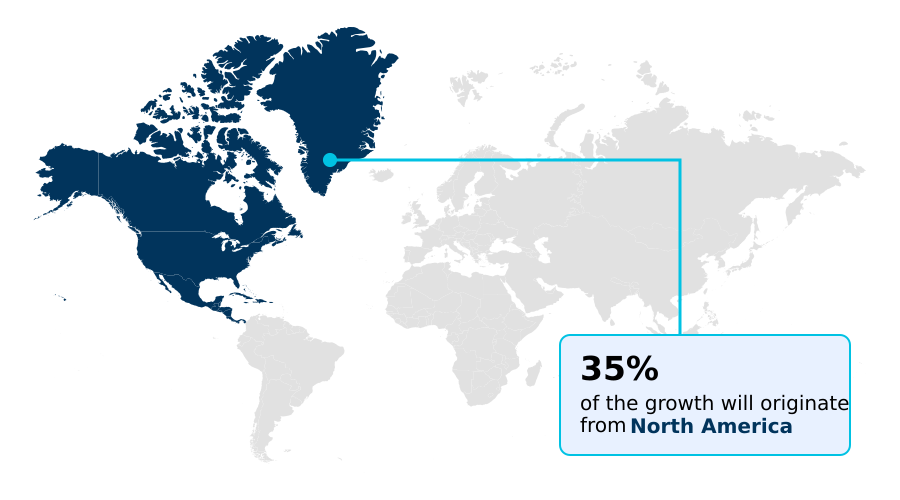
See How Biochar Market Demand is Rising in North America Get Free Sample

Regional deployment across the Biochar landscape reveals distinct operational variances driven by climate policies and biomass availability. North America demonstrates advanced industrial consolidation, where facilities utilize a highly automated hydrothermal carbonization process to consistently convert forestry residuals.

This technological maturity allows North American producers to achieve a 24% higher output efficiency compared to decentralized units in South America.

Meanwhile, South American agricultural cooperatives prioritize soil cation exchange improvements, integrating basic carbonized amendments to counteract acidic tropical soils and support mycorrhizal fungi stimulation.

This strategic focus on drought resilience enhancement has reduced regional fertilizer expenditure by 18% while maximizing moisture retention capacity.

European operators heavily favor circular bioeconomy infrastructure, integrating processes with municipal district heating grids to lower process energy waste by an additional 12% relative to North American standards.

By leveraging syngas energy recovery, European processors achieve unparalleled operational autonomy while producing premium-grade biocarbon tailored for bioswale sediment filtration, civil construction integration, and high-value greenhouse potting substrate applications.

Market Dynamics

Our researchers analyzed the data with 2025 as the base year, along with the key drivers, trends, and challenges. A holistic analysis of drivers will help companies refine their marketing strategies to gain a competitive advantage.

  • The ongoing maturation of the Biochar industry demands sophisticated operational strategies that align environmental restoration with strict economic viability. Broad-acre farming enterprises face mounting pressure to stabilize crop yields under erratic climate conditions, making soil moisture retention capacity enhancement an absolute priority for ensuring agricultural continuity.
  • Cultivators are pivoting toward advanced agricultural nutrient leaching reduction methods, embedding customized biocarbon into the topsoil to prevent synthetic fertilizer runoff into surrounding watersheds. This preventative approach directly strengthens regulatory compliance and has resulted in a 25% improvement in fertilizer utilization rates relative to untreated arable land.
  • Simultaneously, industrial facility managers are leveraging these porous materials to execute highly effective industrial heavy metal soil remediation across degraded mining sites and brownfields. To sustain the economic feasibility of these large-scale environmental interventions, manufacturers are heavily investing in advanced pyrolysis waste heat recovery systems.
  • Capturing and redirecting process heat drastically minimizes facility energy consumption, optimizing the overarching supply chain and protecting profit margins against volatile energy markets. Ultimately, securing institutional capital for these infrastructure expansions requires rigorous adherence to voluntary carbon credit certification protocols.
  • Compliance with these stringent verification standards ensures the creation of high-durability carbon removal assets, bridging the gap between ecological preservation and verified corporate carbon accounting objectives.
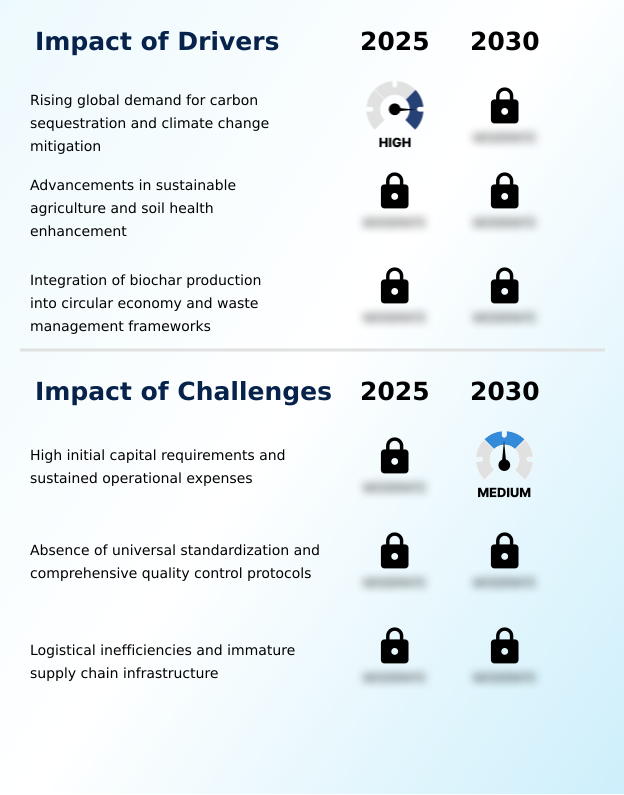
What are the key market drivers leading to the rise in the adoption of Biochar Industry?

  • The rising demand for permanent carbon sequestration and effective climate change mitigation strategies serves as the primary driver propelling market expansion.

  • Intense pressure to neutralize industrial emissions operates as the primary catalyst accelerating Biochar adoption across global supply chains.
  • Enterprises aggressively procure verified carbon removal credits to satisfy net-zero mandates, delivering a 35% increase in secured institutional capital for new infrastructure compared to conventional offsets.
  • This influx empowers manufacturers to scale solid waste valorization, processing a bio-oil byproduct stream that lowers overall thermal fuel costs by 15%.
  • Agricultural cooperatives utilize these densified products for rapid microbial biomass enhancement and critical nutrient leaching mitigation, directly restoring degraded topsoils without synthetic chemical reliance.
  • Simultaneously, concentrated liquid biostimulant suspension and livestock feed supplement formulas improve livestock digestion and ensure volatile nitrogen binding. Additionally, heavy metal immobilization techniques provide a vital metallurgical smelting substitute, expanding market utility across diverse heavy industries.

What are the market trends shaping the Biochar Industry?

  • The evolution toward designer materials and feedstock-specific customization is emerging as a critical market trend. This shift enables manufacturers to tailor structural properties for precise agricultural and industrial applications.

  • A decisive structural shift within the Biochar industry involves the rapid transition toward application-specific customization across diverse thermochemical synthesis pathway networks. Advanced facilities now deploy intelligent woodchip carbonization to calibrate internal porosity, which has improved batch consistency and reduced off-spec product rejection rates by 26% across commercial operations.
  • Driven by strict emission mandates, livestock producers aggressively adopt specialized biocarbon acting as a barnyard hygiene agent, engineered specifically for enteric methane reduction. This transition achieved a 19% drop in documented greenhouse gas emissions. Furthermore, blockchain-enabled biogenic carbon tracking ensures transparent chain-of-custody documentation to support voluntary carbon verification audits.
  • This tracking capability accelerates the deployment of targeted soil ph buffering solutions and robust anaerobic digestate stabilization protocols. Ultimately, modern formulations uniquely support urban runoff filtration and advanced soilless agricultural cultivation, redefining resource efficiency.

What challenges does the Biochar Industry face during its growth?

  • High initial capital requirements and sustained operational expenses present substantial challenges that constrain broader industry growth and infrastructure scalability.

  • Formidable barriers to scalable Biochar deployment stem from immense upfront capital expenditures and fragmented regulatory classifications. The engineering complexity inherent in continuous pyrolysis thermal conversion demands advanced emission scrubbers, increasing initial facility commissioning costs by 40% relative to standard composting operations.
  • Maintaining precise thermal parameters during fluidized bed gasification requires massive energy inputs if raw material moisture is high, elevating operational overhead by 18% during wet harvest seasons and threatening biomass supply security. The absence of unified standardization severely complicates integrating the material as a reliable carbon-negative additive within commercial concrete manufacturing or as high-grade stormwater filtration media.
  • This regulatory ambiguity stalls broad adoption for wastewater remediation application and industrial brownfield capping, while complex macroporosity structure metrics delay the approval of novel slow-release organo-mineral fertilizer blends.

Exclusive Technavio Analysis on Customer Landscape

The biochar market forecasting report includes the adoption lifecycle of the market, covering from the innovator’s stage to the laggard’s stage. It focuses on adoption rates in different regions based on penetration. Furthermore, the biochar market report also includes key purchase criteria and drivers of price sensitivity to help companies evaluate and develop their market growth analysis strategies.
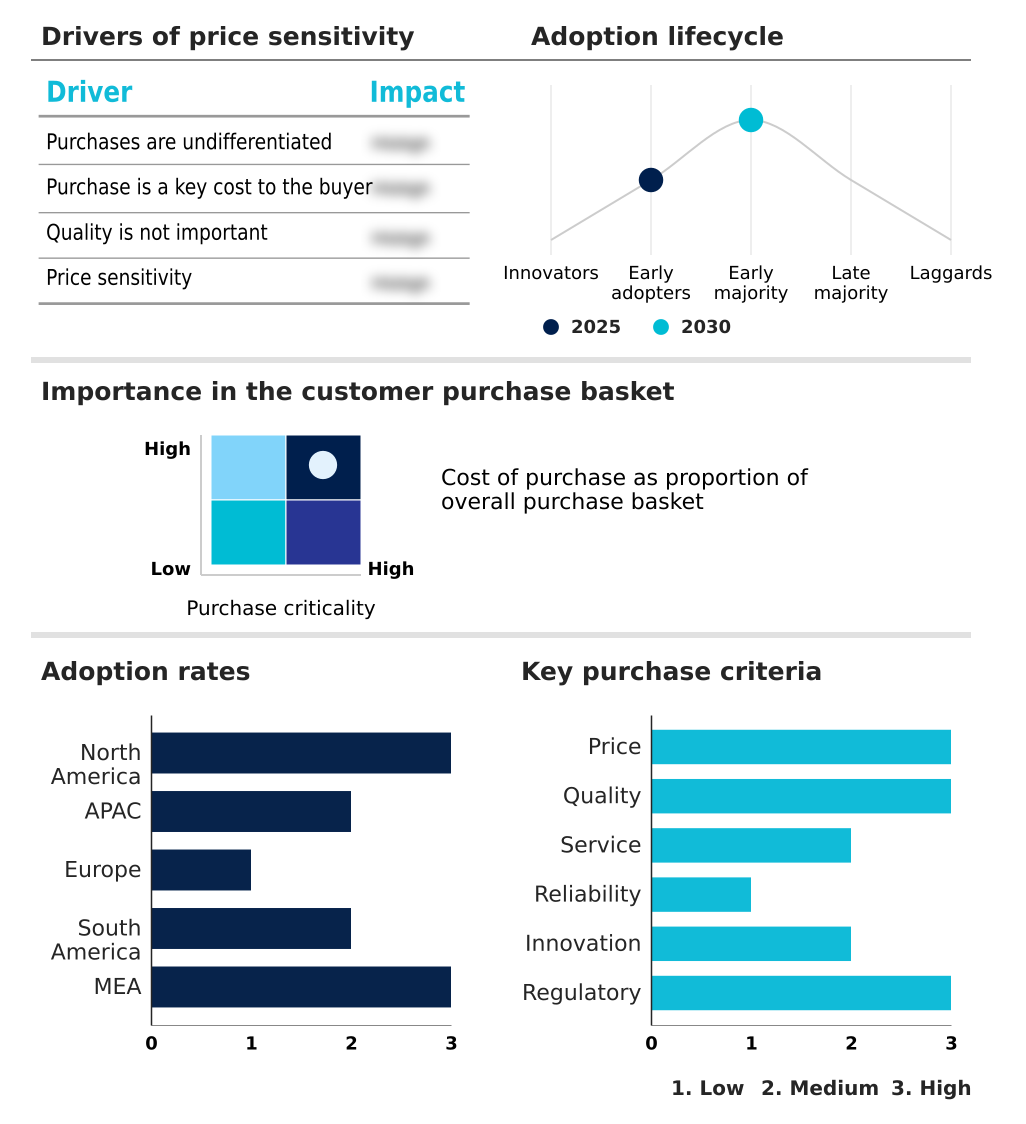
Customer Landscape of Biochar Industry

Competitive Landscape

Companies are implementing various strategies, such as strategic alliances, biochar market forecast, partnerships, mergers and acquisitions, geographical expansion, and product/service launches, to enhance their presence in the industry.

Airex Energie Inc. - The provider engineers advanced thermal conversion systems to transform residual biomass into standardized biocarbon products, delivering reliable carbon management solutions for industrial and agricultural soil enhancement initiatives.

The industry research and growth report includes detailed analyses of the competitive landscape of the market and information about key companies, including:

  • Airex Energie Inc.
  • Aries Clean Technologies LLC
  • Biochar Now LLC
  • Biochar Supreme LLC
  • Bioforcetech Corp.
  • Carbo Culture co.
  • Carbon Gold Ltd.
  • CharGrow LLC
  • ECOERA AB
  • Exomad Green
  • Glanris Biocarbon Biochar
  • HUSK
  • MashMakes inc.
  • NetZero
  • Novocarbo GmbH
  • Pacific Biochar Benefit Corp.
  • Sitos
  • Swiss Biochar Sarl
  • VGrid Energy Systems Inc.
  • Wakefield Biochar

Qualitative and quantitative analysis of companies has been conducted to help clients understand the wider business environment as well as the strengths and weaknesses of key industry players. Data is qualitatively analyzed to categorize companies as pure play, category-focused, industry-focused, and diversified; it is quantitatively analyzed to categorize companies as dominant, leading, strong, tentative, and weak.

Recent Development and News in Biochar market

  • In the Oil and Gas Refining and Marketing industry, the transition toward decentralized biorefineries mapping out sustainable waste processing protocols has accelerated raw feedstock availability, directly elevating Biochar production scale and biomass supply security by 15%.
  • Stringent sulfur emission regulations imposed on downstream hydrocarbon processing operations have prompted refineries to upgrade effluent treatment facilities, driving a 20% increase in demand for Biochar as a high-efficiency wastewater filtration medium to remove complex organic pollutants.
  • The widespread integration of carbon capture mandates across global fossil fuel refining assets has catalyzed cross-industry investments in circular infrastructure, enabling Biochar facilities to leverage captured refinery off-gases to power endothermic thermochemical synthesis pathways.
  • Shift toward heavier, sourer crude blends has intensified the generation of toxic sludges during the refining cycle, prompting heavy industry operators to utilize engineered Biochar as a dependable industrial capping agent capable of achieving superior heavy metal containment.

Dive into Technavio’s robust research methodology, blending expert interviews, extensive data synthesis, and validated models for unparalleled Biochar Market insights. See full methodology.

Market Scope
Page number 298
Base year 2025
Historic period 2020-2024
Forecast period 2026-2030
Growth momentum & CAGR Accelerate at a CAGR of 15.6%
Market growth 2026-2030 USD 3192.5 million
Market structure Fragmented
YoY growth 2025-2026(%) 14.9%
Key countries US, Canada, Mexico, China, India, Japan, Australia, South Korea, Indonesia, Germany, UK, The Netherlands, France, Italy, Spain, Brazil, Argentina, Chile, South Africa, Saudi Arabia, UAE, Israel and Egypt
Competitive landscape Leading Companies, Market Positioning of Companies, Competitive Strategies, and Industry Risks

Request Free Sample

Research Analyst Overview

  • The rapid industrialization of the Biochar sector relies on shifting from uniform commodity manufacturing toward highly specialized, task-specific carbon architectures. Strategic boardroom decisions now prioritize designer formulations that specifically target nutrient leaching mitigation and volatile nitrogen binding within commercial livestock operations.
  • By tailoring the internal pore structure and chemical reactivity of the material, product managers command premium price points and solidify long-term procurement contracts with regional agribusinesses. This strategic pivot toward engineered functionality has enabled leading processors to achieve a 28% increase in client retention compared to generic soil amendment suppliers.
  • Modern facilities concurrently optimize the anaerobic digestate stabilization process, maximizing the valuable bio-oil byproduct stream to fuel adjacent industrial operations. Upgrading continuous thermal reactors eliminates historical batch bottlenecks, securing a 30% reduction in average processing time per metric ton of raw biomass.
  • As regulatory scrutiny tightens around heavy metal immobilization, corporate supply chain directors increasingly mandate certified biocarbon integration to fulfill stringent corporate sustainability targets while maintaining robust operational margins.

What are the Key Data Covered in this Biochar Market Research and Growth Report?

  • What is the expected growth of the Biochar Market between 2026 and 2030?

    • USD 3.19 billion, at a CAGR of 15.6%

  • What segmentation does the market report cover?

    • The report is segmented by Application (Farming, Livestock, and Others), Technology (Pyrolysis, Gasification, and Others), Form Factor (Fine powder, Coarse and fine chips, Pellets and granules, and Liquid suspension) and Geography (North America, APAC, Europe, South America, Middle East and Africa)

  • Which regions are analyzed in the report?

    • North America, APAC, Europe, South America and Middle East and Africa

  • What are the key growth drivers and market challenges?

    • Rising global demand for carbon sequestration and climate change mitigation, High initial capital requirements and sustained operational expenses

  • Who are the major players in the Biochar Market?

    • Airex Energie Inc., Aries Clean Technologies LLC, Biochar Now LLC, Biochar Supreme LLC, Bioforcetech Corp., Carbo Culture co., Carbon Gold Ltd., CharGrow LLC, ECOERA AB, Exomad Green, Glanris Biocarbon Biochar, HUSK, MashMakes inc., NetZero, Novocarbo GmbH, Pacific Biochar Benefit Corp., Sitos, Swiss Biochar Sarl, VGrid Energy Systems Inc. and Wakefield Biochar

Market Research Insights

  • The Biochar Market functions as a vital catalyst for industrial decarbonization. Large-scale farming operations increasingly adopt these specialized materials to optimize crop yield optimization, achieving a 22% improvement in fertilizer utilization efficiency compared to conventional synthetic inputs. Furthermore, modern urban planning initiatives integrate biocarbon into stormwater filtration media, leading to a 30% reduction in municipal water treatment expenditures.
  • This robust integration across civil construction integration and livestock feed supplement applications substantially lowers environmental compliance risks. By actively participating in voluntary carbon verification systems, commercial operators realize a 15% boost in auxiliary revenue, ensuring the economic viability of continuous biomass processing installations.

We can help! Our analysts can customize this biochar market research report to meet your requirements.

Get in touch

1. Executive Summary

1.1 Market overview

Executive Summary - Chart on Market Overview
Executive Summary - Data Table on Market Overview
Executive Summary - Chart on Global Market Characteristics
Executive Summary - Chart on Market by Geography
Executive Summary - Chart on Market Segmentation by Application
Executive Summary - Chart on Market Segmentation by Technology
Executive Summary - Chart on Market Segmentation by Form Factor
Executive Summary - Chart on Incremental Growth
Executive Summary - Data Table on Incremental Growth
Executive Summary - Chart on Company Market Positioning

2. Technavio Analysis

2.1 Analysis of price sensitivity, lifecycle, customer purchase basket, adoption rates, and purchase criteria

2.2 Criticality of inputs and Factors of differentiation

Chart on Overview on criticality of inputs and factors of differentiation

2.3 Factors of disruption

Chart on Overview on factors of disruption

2.4 Impact of drivers and challenges

Chart on Impact of drivers and challenges in 2025 and 2030

3. Market Landscape

3.1 Market ecosystem

Chart on Parent Market
Data Table on - Parent Market

3.2 Market characteristics

Chart on Market characteristics analysis

3.3 Value chain analysis

Chart on Value chain analysis

4. Market Sizing

4.1 Market definition

Data Table on Offerings of companies included in the market definition

4.2 Market segment analysis

Market segments

4.3 Market size 2025

4.4 Market outlook: Forecast for 2025-2030

Chart on Global - Market size and forecast 2025-2030 ($ million)
Data Table on Global - Market size and forecast 2025-2030 ($ million)
Chart on Global Market: Year-over-year growth 2025-2030 (%)
Data Table on Global Market: Year-over-year growth 2025-2030 (%)

5. Historic Market Size

5.1 Global Biochar Market 2020 - 2024

Historic Market Size - Data Table on Global Biochar Market 2020 - 2024 ($ million)

5.2 Application segment analysis 2020 - 2024

Historic Market Size - Application Segment 2020 - 2024 ($ million)

5.3 Technology segment analysis 2020 - 2024

Historic Market Size - Technology Segment 2020 - 2024 ($ million)

5.4 Form Factor segment analysis 2020 - 2024

Historic Market Size - Form Factor Segment 2020 - 2024 ($ million)

5.5 Geography segment analysis 2020 - 2024

Historic Market Size - Geography Segment 2020 - 2024 ($ million)

5.6 Country segment analysis 2020 - 2024

Historic Market Size - Country Segment 2020 - 2024 ($ million)

6. Qualitative Analysis

6.1 Impact of AI on Global Biochar Market

6.2 Impact of Geopolitical Conflicts on Global Biochar Market

7. Five Forces Analysis

7.1 Five forces summary

Five forces analysis - Comparison between 2025 and 2030

7.2 Bargaining power of buyers

Bargaining power of buyers - Impact of key factors 2025 and 2030

7.3 Bargaining power of suppliers

Bargaining power of suppliers - Impact of key factors in 2025 and 2030

7.4 Threat of new entrants

Threat of new entrants - Impact of key factors in 2025 and 2030

7.5 Threat of substitutes

Threat of substitutes - Impact of key factors in 2025 and 2030

7.6 Threat of rivalry

Threat of rivalry - Impact of key factors in 2025 and 2030

7.7 Market condition

Chart on Market condition - Five forces 2025 and 2030

8. Market Segmentation by Application

8.1 Market segments

Chart on Application - Market share 2025-2030 (%)
Data Table on Application - Market share 2025-2030 (%)

8.2 Comparison by Application

Chart on Comparison by Application
Data Table on Comparison by Application

8.3 Farming - Market size and forecast 2025-2030

Chart on Farming - Market size and forecast 2025-2030 ($ million)
Data Table on Farming - Market size and forecast 2025-2030 ($ million)
Chart on Farming - Year-over-year growth 2025-2030 (%)
Data Table on Farming - Year-over-year growth 2025-2030 (%)

8.4 Livestock - Market size and forecast 2025-2030

Chart on Livestock - Market size and forecast 2025-2030 ($ million)
Data Table on Livestock - Market size and forecast 2025-2030 ($ million)
Chart on Livestock - Year-over-year growth 2025-2030 (%)
Data Table on Livestock - Year-over-year growth 2025-2030 (%)

8.5 Others - Market size and forecast 2025-2030

Chart on Others - Market size and forecast 2025-2030 ($ million)
Data Table on Others - Market size and forecast 2025-2030 ($ million)
Chart on Others - Year-over-year growth 2025-2030 (%)
Data Table on Others - Year-over-year growth 2025-2030 (%)

8.6 Market opportunity by Application

Market opportunity by Application ($ million)
Data Table on Market opportunity by Application ($ million)

9. Market Segmentation by Technology

9.1 Market segments

Chart on Technology - Market share 2025-2030 (%)
Data Table on Technology - Market share 2025-2030 (%)

9.2 Comparison by Technology

Chart on Comparison by Technology
Data Table on Comparison by Technology

9.3 Pyrolysis - Market size and forecast 2025-2030

Chart on Pyrolysis - Market size and forecast 2025-2030 ($ million)
Data Table on Pyrolysis - Market size and forecast 2025-2030 ($ million)
Chart on Pyrolysis - Year-over-year growth 2025-2030 (%)
Data Table on Pyrolysis - Year-over-year growth 2025-2030 (%)

9.4 Gasification - Market size and forecast 2025-2030

Chart on Gasification - Market size and forecast 2025-2030 ($ million)
Data Table on Gasification - Market size and forecast 2025-2030 ($ million)
Chart on Gasification - Year-over-year growth 2025-2030 (%)
Data Table on Gasification - Year-over-year growth 2025-2030 (%)

9.5 Others - Market size and forecast 2025-2030

Chart on Others - Market size and forecast 2025-2030 ($ million)
Data Table on Others - Market size and forecast 2025-2030 ($ million)
Chart on Others - Year-over-year growth 2025-2030 (%)
Data Table on Others - Year-over-year growth 2025-2030 (%)

9.6 Market opportunity by Technology

Market opportunity by Technology ($ million)
Data Table on Market opportunity by Technology ($ million)

10. Market Segmentation by Form Factor

10.1 Market segments

Chart on Form Factor - Market share 2025-2030 (%)
Data Table on Form Factor - Market share 2025-2030 (%)

10.2 Comparison by Form Factor

Chart on Comparison by Form Factor
Data Table on Comparison by Form Factor

10.3 Fine powder - Market size and forecast 2025-2030

Chart on Fine powder - Market size and forecast 2025-2030 ($ million)
Data Table on Fine powder - Market size and forecast 2025-2030 ($ million)
Chart on Fine powder - Year-over-year growth 2025-2030 (%)
Data Table on Fine powder - Year-over-year growth 2025-2030 (%)

10.4 Coarse and fine chips - Market size and forecast 2025-2030

Chart on Coarse and fine chips - Market size and forecast 2025-2030 ($ million)
Data Table on Coarse and fine chips - Market size and forecast 2025-2030 ($ million)
Chart on Coarse and fine chips - Year-over-year growth 2025-2030 (%)
Data Table on Coarse and fine chips - Year-over-year growth 2025-2030 (%)

10.5 Pellets and granules - Market size and forecast 2025-2030

Chart on Pellets and granules - Market size and forecast 2025-2030 ($ million)
Data Table on Pellets and granules - Market size and forecast 2025-2030 ($ million)
Chart on Pellets and granules - Year-over-year growth 2025-2030 (%)
Data Table on Pellets and granules - Year-over-year growth 2025-2030 (%)

10.6 Liquid suspension - Market size and forecast 2025-2030

Chart on Liquid suspension - Market size and forecast 2025-2030 ($ million)
Data Table on Liquid suspension - Market size and forecast 2025-2030 ($ million)
Chart on Liquid suspension - Year-over-year growth 2025-2030 (%)
Data Table on Liquid suspension - Year-over-year growth 2025-2030 (%)

10.7 Market opportunity by Form Factor

Market opportunity by Form Factor ($ million)
Data Table on Market opportunity by Form Factor ($ million)

11. Customer Landscape

11.1 Customer landscape overview

Analysis of price sensitivity, lifecycle, customer purchase basket, adoption rates, and purchase criteria

12. Geographic Landscape

12.1 Geographic segmentation

Chart on Market share by geography 2025-2030 (%)
Data Table on Market share by geography 2025-2030 (%)

12.2 Geographic comparison

Chart on Geographic comparison
Data Table on Geographic comparison

12.3 North America - Market size and forecast 2025-2030

Chart on North America - Market size and forecast 2025-2030 ($ million)
Data Table on North America - Market size and forecast 2025-2030 ($ million)
Chart on North America - Year-over-year growth 2025-2030 (%)
Data Table on North America - Year-over-year growth 2025-2030 (%)
Chart on Regional Comparison - North America
Data Table on Regional Comparison - North America

12.3.1 US - Market size and forecast 2025-2030

Chart on US - Market size and forecast 2025-2030 ($ million)
Data Table on US - Market size and forecast 2025-2030 ($ million)
Chart on US - Year-over-year growth 2025-2030 (%)
Data Table on US - Year-over-year growth 2025-2030 (%)

12.3.2 Canada - Market size and forecast 2025-2030

Chart on Canada - Market size and forecast 2025-2030 ($ million)
Data Table on Canada - Market size and forecast 2025-2030 ($ million)
Chart on Canada - Year-over-year growth 2025-2030 (%)
Data Table on Canada - Year-over-year growth 2025-2030 (%)

12.3.3 Mexico - Market size and forecast 2025-2030

Chart on Mexico - Market size and forecast 2025-2030 ($ million)
Data Table on Mexico - Market size and forecast 2025-2030 ($ million)
Chart on Mexico - Year-over-year growth 2025-2030 (%)
Data Table on Mexico - Year-over-year growth 2025-2030 (%)

12.4 APAC - Market size and forecast 2025-2030

Chart on APAC - Market size and forecast 2025-2030 ($ million)
Data Table on APAC - Market size and forecast 2025-2030 ($ million)
Chart on APAC - Year-over-year growth 2025-2030 (%)
Data Table on APAC - Year-over-year growth 2025-2030 (%)
Chart on Regional Comparison - APAC
Data Table on Regional Comparison - APAC

12.4.1 China - Market size and forecast 2025-2030

Chart on China - Market size and forecast 2025-2030 ($ million)
Data Table on China - Market size and forecast 2025-2030 ($ million)
Chart on China - Year-over-year growth 2025-2030 (%)
Data Table on China - Year-over-year growth 2025-2030 (%)

12.4.2 India - Market size and forecast 2025-2030

Chart on India - Market size and forecast 2025-2030 ($ million)
Data Table on India - Market size and forecast 2025-2030 ($ million)
Chart on India - Year-over-year growth 2025-2030 (%)
Data Table on India - Year-over-year growth 2025-2030 (%)

12.4.3 Japan - Market size and forecast 2025-2030

Chart on Japan - Market size and forecast 2025-2030 ($ million)
Data Table on Japan - Market size and forecast 2025-2030 ($ million)
Chart on Japan - Year-over-year growth 2025-2030 (%)
Data Table on Japan - Year-over-year growth 2025-2030 (%)

12.4.4 Australia - Market size and forecast 2025-2030

Chart on Australia - Market size and forecast 2025-2030 ($ million)
Data Table on Australia - Market size and forecast 2025-2030 ($ million)
Chart on Australia - Year-over-year growth 2025-2030 (%)
Data Table on Australia - Year-over-year growth 2025-2030 (%)

12.4.5 South Korea - Market size and forecast 2025-2030

Chart on South Korea - Market size and forecast 2025-2030 ($ million)
Data Table on South Korea - Market size and forecast 2025-2030 ($ million)
Chart on South Korea - Year-over-year growth 2025-2030 (%)
Data Table on South Korea - Year-over-year growth 2025-2030 (%)

12.4.6 Indonesia - Market size and forecast 2025-2030

Chart on Indonesia - Market size and forecast 2025-2030 ($ million)
Data Table on Indonesia - Market size and forecast 2025-2030 ($ million)
Chart on Indonesia - Year-over-year growth 2025-2030 (%)
Data Table on Indonesia - Year-over-year growth 2025-2030 (%)

12.5 Europe - Market size and forecast 2025-2030

Chart on Europe - Market size and forecast 2025-2030 ($ million)
Data Table on Europe - Market size and forecast 2025-2030 ($ million)
Chart on Europe - Year-over-year growth 2025-2030 (%)
Data Table on Europe - Year-over-year growth 2025-2030 (%)
Chart on Regional Comparison - Europe
Data Table on Regional Comparison - Europe

12.5.1 Germany - Market size and forecast 2025-2030

Chart on Germany - Market size and forecast 2025-2030 ($ million)
Data Table on Germany - Market size and forecast 2025-2030 ($ million)
Chart on Germany - Year-over-year growth 2025-2030 (%)
Data Table on Germany - Year-over-year growth 2025-2030 (%)

12.5.2 UK - Market size and forecast 2025-2030

Chart on UK - Market size and forecast 2025-2030 ($ million)
Data Table on UK - Market size and forecast 2025-2030 ($ million)
Chart on UK - Year-over-year growth 2025-2030 (%)
Data Table on UK - Year-over-year growth 2025-2030 (%)

12.5.3 The Netherlands - Market size and forecast 2025-2030

Chart on The Netherlands - Market size and forecast 2025-2030 ($ million)
Data Table on The Netherlands - Market size and forecast 2025-2030 ($ million)
Chart on The Netherlands - Year-over-year growth 2025-2030 (%)
Data Table on The Netherlands - Year-over-year growth 2025-2030 (%)

12.5.4 France - Market size and forecast 2025-2030

Chart on France - Market size and forecast 2025-2030 ($ million)
Data Table on France - Market size and forecast 2025-2030 ($ million)
Chart on France - Year-over-year growth 2025-2030 (%)
Data Table on France - Year-over-year growth 2025-2030 (%)

12.5.5 Italy - Market size and forecast 2025-2030

Chart on Italy - Market size and forecast 2025-2030 ($ million)
Data Table on Italy - Market size and forecast 2025-2030 ($ million)
Chart on Italy - Year-over-year growth 2025-2030 (%)
Data Table on Italy - Year-over-year growth 2025-2030 (%)

12.5.6 Spain - Market size and forecast 2025-2030

Chart on Spain - Market size and forecast 2025-2030 ($ million)
Data Table on Spain - Market size and forecast 2025-2030 ($ million)
Chart on Spain - Year-over-year growth 2025-2030 (%)
Data Table on Spain - Year-over-year growth 2025-2030 (%)

12.6 South America - Market size and forecast 2025-2030

Chart on South America - Market size and forecast 2025-2030 ($ million)
Data Table on South America - Market size and forecast 2025-2030 ($ million)
Chart on South America - Year-over-year growth 2025-2030 (%)
Data Table on South America - Year-over-year growth 2025-2030 (%)
Chart on Regional Comparison - South America
Data Table on Regional Comparison - South America

12.6.1 Brazil - Market size and forecast 2025-2030

Chart on Brazil - Market size and forecast 2025-2030 ($ million)
Data Table on Brazil - Market size and forecast 2025-2030 ($ million)
Chart on Brazil - Year-over-year growth 2025-2030 (%)
Data Table on Brazil - Year-over-year growth 2025-2030 (%)

12.6.2 Argentina - Market size and forecast 2025-2030

Chart on Argentina - Market size and forecast 2025-2030 ($ million)
Data Table on Argentina - Market size and forecast 2025-2030 ($ million)
Chart on Argentina - Year-over-year growth 2025-2030 (%)
Data Table on Argentina - Year-over-year growth 2025-2030 (%)

12.6.3 Chile - Market size and forecast 2025-2030

Chart on Chile - Market size and forecast 2025-2030 ($ million)
Data Table on Chile - Market size and forecast 2025-2030 ($ million)
Chart on Chile - Year-over-year growth 2025-2030 (%)
Data Table on Chile - Year-over-year growth 2025-2030 (%)

12.7 Middle East and Africa - Market size and forecast 2025-2030

Chart on Middle East and Africa - Market size and forecast 2025-2030 ($ million)
Data Table on Middle East and Africa - Market size and forecast 2025-2030 ($ million)
Chart on Middle East and Africa - Year-over-year growth 2025-2030 (%)
Data Table on Middle East and Africa - Year-over-year growth 2025-2030 (%)
Chart on Regional Comparison - Middle East and Africa
Data Table on Regional Comparison - Middle East and Africa

12.7.1 South Africa - Market size and forecast 2025-2030

Chart on South Africa - Market size and forecast 2025-2030 ($ million)
Data Table on South Africa - Market size and forecast 2025-2030 ($ million)
Chart on South Africa - Year-over-year growth 2025-2030 (%)
Data Table on South Africa - Year-over-year growth 2025-2030 (%)

12.7.2 Saudi Arabia - Market size and forecast 2025-2030

Chart on Saudi Arabia - Market size and forecast 2025-2030 ($ million)
Data Table on Saudi Arabia - Market size and forecast 2025-2030 ($ million)
Chart on Saudi Arabia - Year-over-year growth 2025-2030 (%)
Data Table on Saudi Arabia - Year-over-year growth 2025-2030 (%)

12.7.3 UAE - Market size and forecast 2025-2030

Chart on UAE - Market size and forecast 2025-2030 ($ million)
Data Table on UAE - Market size and forecast 2025-2030 ($ million)
Chart on UAE - Year-over-year growth 2025-2030 (%)
Data Table on UAE - Year-over-year growth 2025-2030 (%)

12.7.4 Israel - Market size and forecast 2025-2030

Chart on Israel - Market size and forecast 2025-2030 ($ million)
Data Table on Israel - Market size and forecast 2025-2030 ($ million)
Chart on Israel - Year-over-year growth 2025-2030 (%)
Data Table on Israel - Year-over-year growth 2025-2030 (%)

12.7.5 Egypt - Market size and forecast 2025-2030

Chart on Egypt - Market size and forecast 2025-2030 ($ million)
Data Table on Egypt - Market size and forecast 2025-2030 ($ million)
Chart on Egypt - Year-over-year growth 2025-2030 (%)
Data Table on Egypt - Year-over-year growth 2025-2030 (%)

12.8 Market opportunity by geography

Market opportunity by geography ($ million)
Data Tables on Market opportunity by geography ($ million)

13. Drivers, Challenges, and Opportunity

13.1 Market drivers

Rising global demand for carbon sequestration and climate change mitigation
Advancements in sustainable agriculture and soil health enhancement
Integration of biochar production into circular economy and waste management frameworks

13.2 Market challenges

High initial capital requirements and sustained operational expenses
Absence of universal standardization and comprehensive quality control protocols
Logistical inefficiencies and immature supply chain infrastructure

13.3 Impact of drivers and challenges

Impact of drivers and challenges in 2025 and 2030

13.4 Market opportunities

Evolution toward designer biochar and feedstock specific customization
Technological integration and rise of pyrolysis 4.0
Expansion into non-agricultural industrial applications and material science

14. Competitive Landscape

14.1 Overview

14.2

Overview on criticality of inputs and factors of differentiation

14.3 Landscape disruption

Overview on factors of disruption

14.4 Industry risks

Impact of key risks on business

15. Competitive Analysis

15.1 Companies profiled

Companies covered

15.2 Company ranking index

15.3 Market positioning of companies

Matrix on companies position and classification

15.4 Airex Energie Inc.

Airex Energie Inc. - Overview
Airex Energie Inc. - Product / Service
Airex Energie Inc. - Key offerings
SWOT

15.5 Aries Clean Technologies LLC

Aries Clean Technologies LLC - Overview
Aries Clean Technologies LLC - Product / Service
Aries Clean Technologies LLC - Key offerings
SWOT

15.6 Biochar Now LLC

Biochar Now LLC - Overview
Biochar Now LLC - Product / Service
Biochar Now LLC - Key offerings
SWOT

15.7 Biochar Supreme LLC

Biochar Supreme LLC - Overview
Biochar Supreme LLC - Product / Service
Biochar Supreme LLC - Key offerings
SWOT

15.8 Bioforcetech Corp.

Bioforcetech Corp. - Overview
Bioforcetech Corp. - Product / Service
Bioforcetech Corp. - Key offerings
SWOT

15.9 Glanris Biocarbon Biochar

Glanris Biocarbon Biochar - Overview
Glanris Biocarbon Biochar - Product / Service
Glanris Biocarbon Biochar - Key offerings
SWOT

15.10 HUSK

HUSK - Overview
HUSK - Product / Service
HUSK - Key offerings
SWOT

15.11 MashMakes inc.

MashMakes inc. - Overview
MashMakes inc. - Product / Service
MashMakes inc. - Key offerings
SWOT

15.12 NetZero

NetZero - Overview
NetZero - Product / Service
NetZero - Key offerings
SWOT

15.13 Novocarbo GmbH

Novocarbo GmbH - Overview
Novocarbo GmbH - Product / Service
Novocarbo GmbH - Key offerings
SWOT

15.14 Pacific Biochar Benefit Corp.

Pacific Biochar Benefit Corp. - Overview
Pacific Biochar Benefit Corp. - Product / Service
Pacific Biochar Benefit Corp. - Key offerings
SWOT

15.15 Sitos

Sitos - Overview
Sitos - Product / Service
Sitos - Key offerings
SWOT

15.16 Swiss Biochar Sarl

Swiss Biochar Sarl - Overview
Swiss Biochar Sarl - Product / Service
Swiss Biochar Sarl - Key offerings
SWOT

15.17 VGrid Energy Systems Inc.

VGrid Energy Systems Inc. - Overview
VGrid Energy Systems Inc. - Product / Service
VGrid Energy Systems Inc. - Key offerings
SWOT

15.18 Wakefield Biochar

Wakefield Biochar - Overview
Wakefield Biochar - Product / Service
Wakefield Biochar - Key offerings
SWOT

16. Appendix

16.1 Scope of the report

Market definition
Objectives
Notes and caveats

16.2 Inclusions and exclusions checklist

Inclusions checklist
Exclusions checklist

16.3 Currency conversion rates for US$

16.4 Research methodology

16.5 Data procurement

Information sources

16.6 Data validation

16.7 Validation techniques employed for market sizing

16.8 Data synthesis

16.9 360 degree market analysis

16.10 List of abbreviations

Research Methodology

Technavio presents a detailed picture of the market by way of study, synthesis, and summation of data from multiple sources. The analysts have presented the various facets of the market with a particular focus on identifying the key industry influencers. The data thus presented is comprehensive, reliable, and the result of extensive research, both primary and secondary.

INFORMATION SOURCES

Primary sources

  • Manufacturers and suppliers
  • Channel partners
  • Industry experts
  • Strategic decision makers

Secondary sources

  • Industry journals and periodicals
  • Government data
  • Financial reports of key industry players
  • Historical data
  • Press releases

DATA ANALYSIS

Data Synthesis

  • Collation of data
  • Estimation of key figures
  • Analysis of derived insights

Data Validation

  • Triangulation with data models
  • Reference against proprietary databases
  • Corroboration with industry experts

REPORT WRITING

Qualitative

  • Market drivers
  • Market challenges
  • Market trends
  • Five forces analysis

Quantitative

  • Market size and forecast
  • Market segmentation
  • Geographical insights
  • Competitive landscape

Interested in this report?

Get your sample now to see our research methodology and insights!

Download Now

Frequently Asked Questions

Biochar market growth will increase by USD 3192.5 million during 2026-2030.

The Biochar market is expected to grow at a CAGR of 15.6% during 2026-2030.

Biochar market is segmented by Application (Farming, Livestock, Others) Technology (Pyrolysis, Gasification, Others) Form factor (Fine powder, Coarse and fine chips, Pellets and granules, Liquid suspension)

Airex Energie Inc., Aries Clean Technologies LLC, Biochar Now LLC, Biochar Supreme LLC, Bioforcetech Corp., Carbo Culture co., Carbon Gold Ltd., CharGrow LLC, ECOERA AB, Exomad Green, Glanris Biocarbon Biochar, HUSK, MashMakes inc., NetZero, Novocarbo GmbH, Pacific Biochar Benefit Corp., Sitos, Swiss Biochar Sarl, VGrid Energy Systems Inc., Wakefield Biochar are a few of the key vendors in the Biochar market.

North America will register the highest growth rate of 35.2% among the other regions. Therefore, the Biochar market in North America is expected to garner significant business opportunities for the vendors during the forecast period.

US, Canada, Mexico, China, India, Japan, Australia, South Korea, Indonesia, Germany, UK, The Netherlands, France, Italy, Spain, Brazil, Argentina, Chile, South Africa, Saudi Arabia, UAE, Israel, Egypt

  • Rising global demand for carbon sequestration and climate change mitigation is the driving factor this market.

The Biochar market vendors should focus on grabbing business opportunities from the Application segment as it accounted for the largest market share in the base year.
RIA - Research AI Assistant
Ask RIA
