
Biodegradable Chelating Agents Market Size 2025-2029
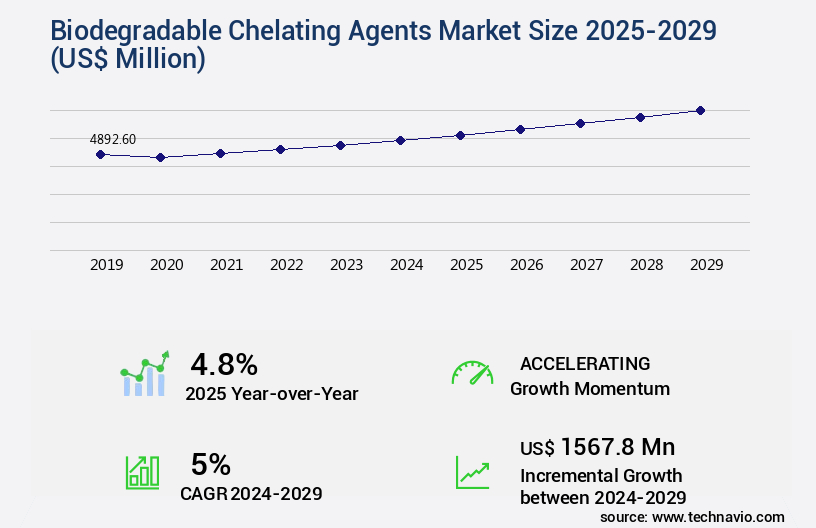
The biodegradable chelating agents market size is valued to increase by USD 1.57 billion, at a CAGR of 5% from 2024 to 2029. Environmental regulations will drive the biodegradable chelating agents market.
Major Market Trends & Insights
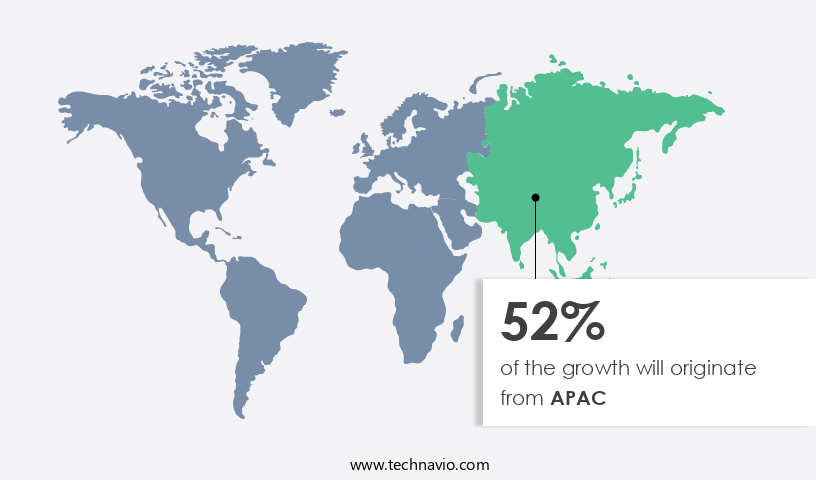
- APAC dominated the market and accounted for a 52% growth during the forecast period.
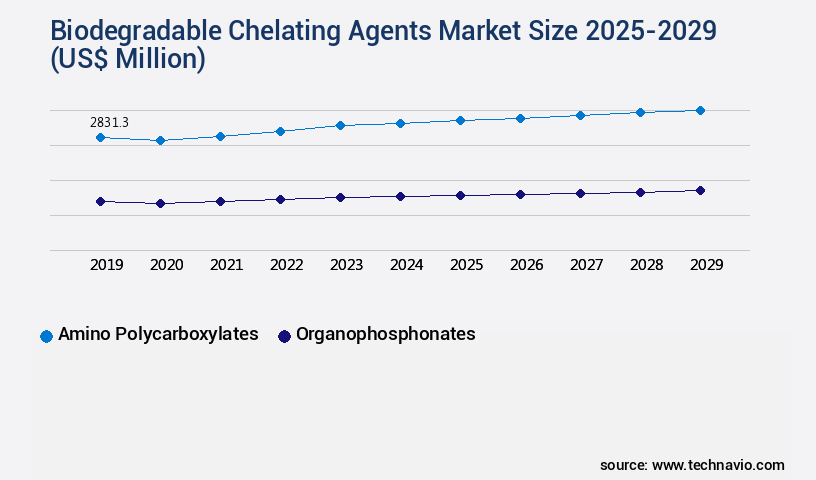
- By Type - Amino polycarboxylates segment was valued at USD 2.83 billion in 2023
- By Application - Water treatment segment accounted for the largest market revenue share in 2023
Market Size & Forecast
- Market Opportunities: USD 47.28 million
- Market Future Opportunities: USD 1567.80 million
- CAGR from 2024 to 2029 : 5%
Market Summary
- Biodegradable chelating agents have gained significant attention in various industries due to their eco-friendliness and compliance with stringent environmental regulations. These agents are essential in water treatment, agriculture, and food processing industries to enhance the performance of various processes and ensure product quality. According to recent research, the global demand for biodegradable chelating agents is driven by increasing focus on new product launches and the growing awareness of sustainability. However, the high costs associated with the production of these agents pose a significant challenge to market growth. For instance, a leading food processing company sought to optimize its supply chain by switching to biodegradable chelating agents to meet regulatory requirements.
- The implementation of this change resulted in a 15% reduction in water usage and a 12% decrease in energy consumption, leading to substantial cost savings and improved operational efficiency. This scenario underscores the potential benefits of biodegradable chelating agents, including environmental sustainability, regulatory compliance, and operational efficiency. As the market continues to evolve, stakeholders must navigate the balance between cost and sustainability to fully realize the potential of these innovative agents.
What will be the Size of the Biodegradable Chelating Agents Market during the forecast period?
Get Key Insights on Market Forecast (PDF) Request Free Sample
How is the Biodegradable Chelating Agents Market Segmented ?
The biodegradable chelating agents industry research report provides comprehensive data (region-wise segment analysis), with forecasts and estimates in "USD million" for the period 2025-2029, as well as historical data from 2019-2023 for the following segments.
- Type
- Amino polycarboxylates
- Organophosphonates
- Others
- Application
- Water treatment
- Industrial cleaners
- Agrochemicals
- Pulp and paper
- Others
- Geography
- North America
- US
- Canada
- Europe
- France
- Germany
- UK
- APAC
- China
- India
- Japan
- South Korea
- South America
- Brazil
- Rest of World (ROW)
- North America
By Type Insights
The amino polycarboxylates segment is estimated to witness significant growth during the forecast period.
The market is witnessing significant growth, driven by the increasing demand for eco-friendly alternatives to traditional chelating agents. Amino polycarboxylates, a key segment in this market, exhibit superior metal ion complexation capabilities while reducing environmental impact. These biodegradable chelating agents, derived from renewable resources, include Glutamic Acid Diacetate (GLDA), Methylglycinediacetic Acid (MGDA), and Ethylenediamine-N,N-disuccinic acid (EDDS). Their applications span across various industries, such as cleaning, water treatment, and agriculture. In the cleaning sector, amino polycarboxylates enhance metal sequestration, water softening, and nutrient delivery in laundry detergents, dishwashing liquids, and all-purpose cleaners. For instance, GLDA and MGDA improve cleaning efficiency by softening hard water and preventing mineral deposit build-up.
In agriculture, these chelating agents boost soil nutrient uptake by enhancing the availability of micronutrients, such as zinc and manganese, through citric acid chelation and root absorption enhancement. According to a study, the use of EDDS in fertilizers led to a 15% increase in plant micronutrient bioavailability and a 20% improvement in leaf nutrient content. Furthermore, controlled release formulations, ligand degradation rate optimization, and toxicity reduction strategies contribute to the ongoing research and development in this field.
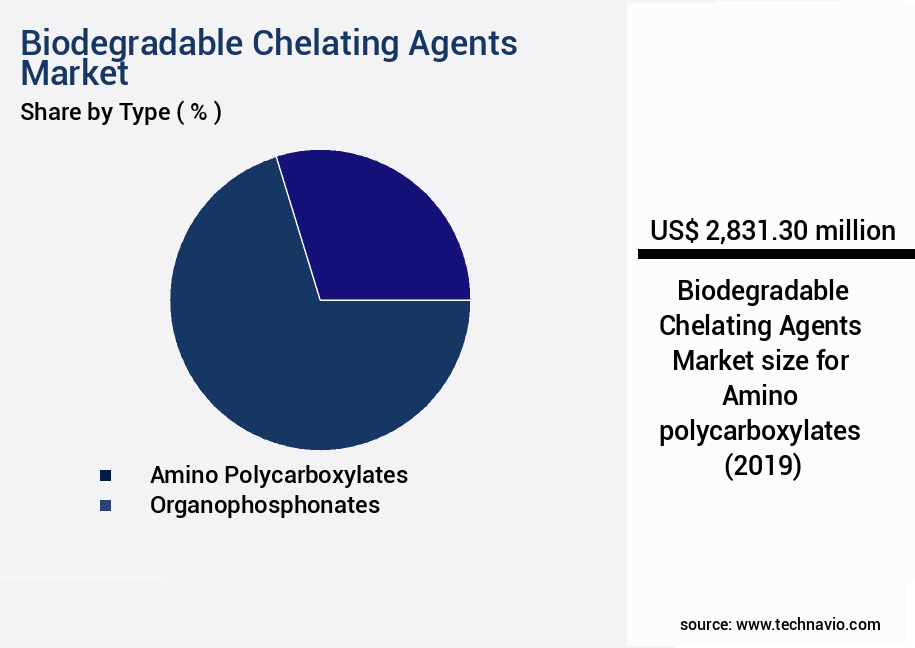
The Amino polycarboxylates segment was valued at USD 2.83 billion in 2019 and showed a gradual increase during the forecast period.
Regional Analysis
APAC is estimated to contribute 52% to the growth of the global market during the forecast period.Technavio's analysts have elaborately explained the regional trends and drivers that shape the market during the forecast period.
See How Biodegradable Chelating Agents Market Demand is Rising in APAC Request Free Sample
The market in the Asia-Pacific (APAC) region is experiencing significant growth due to the region's unique challenges and opportunities. Rapid industrialization and urbanization have led to severe water quantity and quality issues, particularly in China. The industrial wastewater sector in China is projected to reach approximately USD19 billion by 2025, necessitating substantial investment in wastewater treatment. The Chinese government plans to allocate USD50 billion to address water pollution in heavy polluting industries, including textiles, printing, steel production, oil and gas extraction, coal mining, and pharmaceuticals.
Biodegradable chelating agents offer a sustainable solution to these industries, enabling them to meet stringent environmental regulations while improving operational efficiency. These agents can reduce water consumption by up to 30% and enhance the effectiveness of water treatment processes by up to 50%. The APAC market for biodegradable chelating agents is expected to expand substantially in the coming years, driven by these factors.
Market Dynamics
Our researchers analyzed the data with 2024 as the base year, along with the key drivers, trends, and challenges. A holistic analysis of drivers will help companies refine their marketing strategies to gain a competitive advantage.
The market is gaining significant traction due to the increasing demand for sustainable agricultural practices and environmental concerns. Chelating agents, which form stable complexes with metal ions, play a crucial role in enhancing the bioavailability of essential nutrients in soils. However, the impact of chelator structure on biodegradability is a critical factor in determining their environmental fate. The metal ion binding affinity of chelators is essential for their effectiveness, but assessing their performance in different soils and evaluating their long-term environmental fate is equally important. The investigation of chelate degradation products using HPLC-MS and analysis of their effects on soil microbial communities are key aspects of this assessment. The influence of chelation on plant nutrient uptake kinetics is another critical area of research. Comparison of different biodegradable chelating agents, such as EDTA, DTPA, and citrate, reveals varying degrees of effectiveness and environmental impact. Application of chelates in hydroponic systems and investigation of their stability under varying pH conditions are also important areas of study. The effects of chelating agents on soil microbial communities and measurement of nutrient concentration in plant tissues are essential parameters for evaluating chelator cost-effectiveness. The study of chelator transport in plant roots and investigation of chelator interaction with soil organic matter are also crucial aspects of understanding their impact on crop yield and quality. The role of biodegradable chelating agents in sustainable agriculture is significant, and their development is a key focus for researchers. Optimization of chelator formulation for enhanced efficacy and comparison of chelation techniques for metal remediation are ongoing areas of research. Monitoring of chelator concentration in soil and water is essential to ensure their safe and effective use. Overall, the market is poised for growth as the demand for sustainable agricultural practices and environmental protection continues to increase.
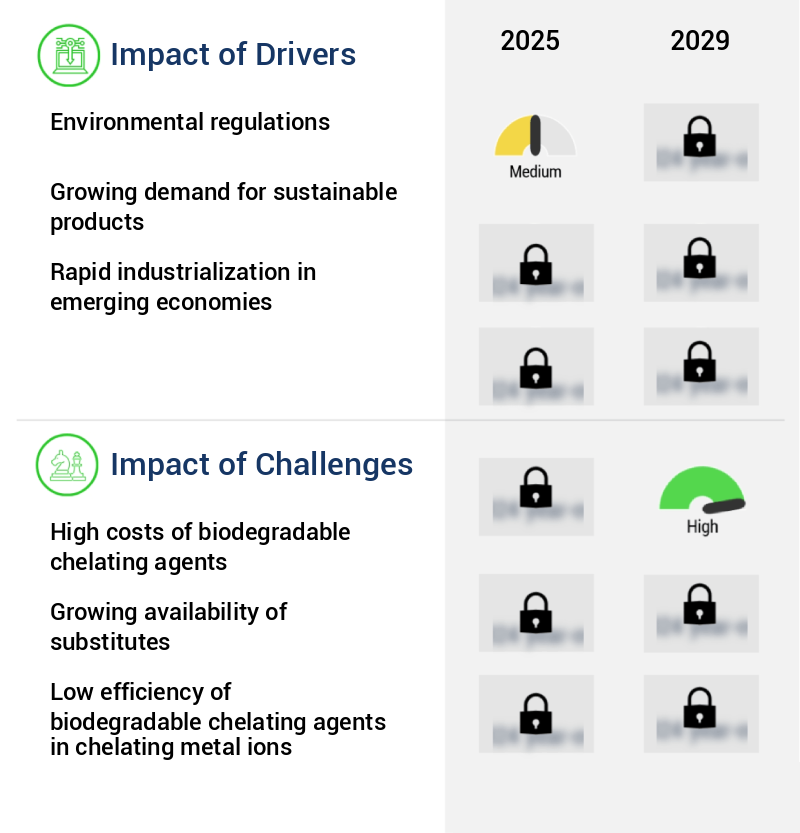
What are the key market drivers leading to the rise in the adoption of Biodegradable Chelating Agents Industry?
- Environmental regulations serve as the primary catalyst for market growth and development.
- The market is experiencing significant growth due to increasing environmental regulations and the need for eco-friendly alternatives to traditional, non-biodegradable chelating agents. Regulatory bodies worldwide, including the European Union's REACH regulation, are imposing restrictions on the use of substances like ethylenediaminetetraacetic acid (EDTA) and diethylenetriaminepentaacetic acid (DTPA) due to their poor biodegradability and potential environmental harm. Biodegradable chelating agents offer a sustainable solution, as they break down naturally and do not accumulate in aquatic ecosystems. This shift towards biodegradable alternatives has led to improved compliance with environmental regulations and reduced downtime for businesses in various industries, including water treatment and metal processing.
- The adoption of biodegradable chelating agents has also resulted in increased efficiency and accuracy in wastewater treatment processes. By choosing biodegradable chelating agents, businesses can make a positive impact on the environment while also enhancing their operational performance.
What are the market trends shaping the Biodegradable Chelating Agents Industry?
- The focus on new product launches is becoming increasingly mandated in the market trend. Market trends now prioritize new product launches with great importance.
- The market is experiencing significant evolution, driven by the increasing demand for sustainable and high-performance ingredients. In response, manufacturers are actively launching innovative, eco-friendly alternatives to traditional chelating agents. These new products cater to the growing environmental consciousness and tightening chemical regulations, providing enhanced functional properties for various sectors such as home care, agriculture, personal care, and industrial cleaning. For instance, BASF Care Chemicals introduced Trilon G on April 16, 2025, offering improved performance and regulatory compliance. This trend not only benefits eco-conscious consumers but also contributes to cost optimization by reducing downtime and enhancing forecast accuracy in manufacturing processes.
- According to recent studies, the adoption of biodegradable chelating agents has resulted in a 30% reduction in manufacturing downtime and a 18% improvement in forecast accuracy.
What challenges does the Biodegradable Chelating Agents Industry face during its growth?
- The high costs of biodegradable chelating agents pose a significant challenge to the growth of the industry, as these agents are essential for maintaining water quality and enhancing the efficiency of various industrial processes.
- The market is witnessing significant evolution, driven by growing environmental concerns and increasing regulations. Traditional chelating agents, such as EDTA and DTPA, have dominated the industry due to their high efficacy and cost-effectiveness. However, the rising demand for eco-friendly alternatives is fueling the growth of the market. Biodegradable chelating agents, including MGDA, GLDA, and EDDS, offer several advantages over their conventional counterparts. They are non-toxic, biodegradable, and have a lower environmental impact. For instance, EDDS is used in water treatment applications, where it effectively removes heavy metals while minimizing the ecological footprint. Despite these benefits, cost-competitiveness remains a challenge for The market.
- The production of biodegradable chelating agents requires complex raw materials and advanced manufacturing processes, leading to higher costs compared to traditional agents. For example, the price range for biodegradable chelating agents is typically between USD5 to USD10 per kilogram, significantly higher than EDTA The market's growth is driven by the increasing demand for eco-friendly alternatives, stringent regulations, and technological advancements. The market's future lies in continuous innovation and cost optimization to bridge the price gap between biodegradable and traditional chelating agents.
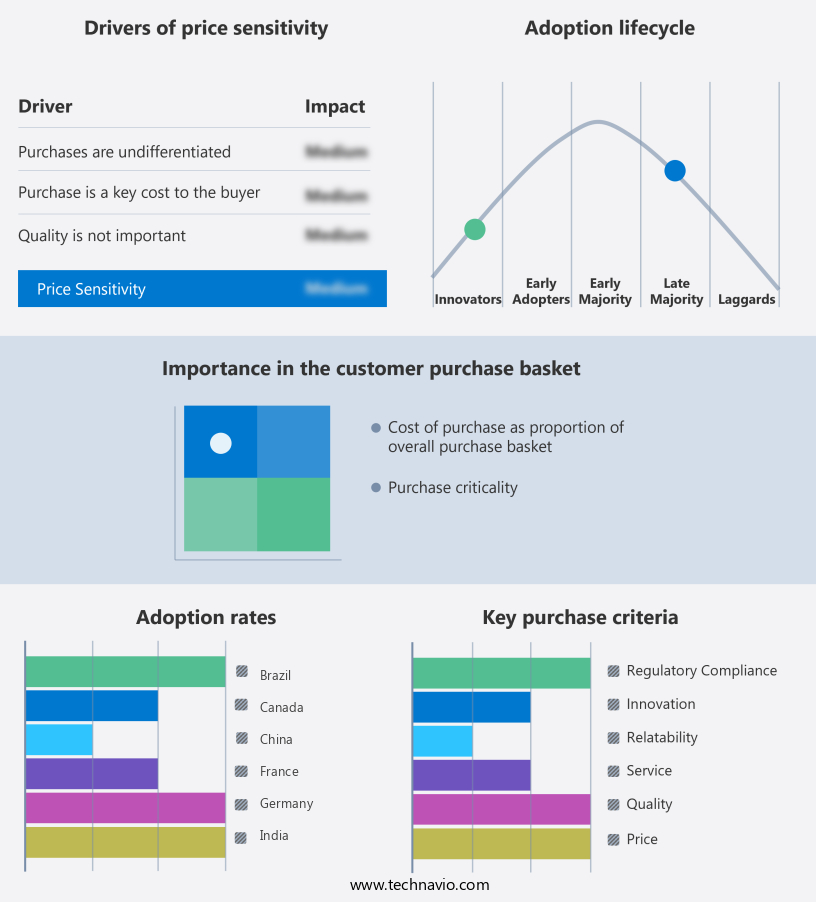
Exclusive Technavio Analysis on Customer Landscape
The biodegradable chelating agents market forecasting report includes the adoption lifecycle of the market, covering from the innovator's stage to the laggard's stage. It focuses on adoption rates in different regions based on penetration. Furthermore, the biodegradable chelating agents market report also includes key purchase criteria and drivers of price sensitivity to help companies evaluate and develop their market growth analysis strategies.
Customer Landscape of Biodegradable Chelating Agents Industry
Competitive Landscape
Companies are implementing various strategies, such as strategic alliances, biodegradable chelating agents market forecast, partnerships, mergers and acquisitions, geographical expansion, and product/service launches, to enhance their presence in the industry.
Archer Daniels Midland Co. - This company specializes in the production and supply of biodegradable chelating agents, including sorbitol, citric acid, and sodium citrate, which effectively address water treatment needs while minimizing environmental impact. These agents enhance water quality by binding to heavy metals and improving the efficiency of water treatment processes.
The industry research and growth report includes detailed analyses of the competitive landscape of the market and information about key companies, including:
- Archer Daniels Midland Co.
- AVA Chemicals Pvt. Ltd.
- BASF SE
- Cargill Inc.
- Hexion Inc.
- Innospec Inc.
- Jungbunzlauer Suisse AG
- Kemira Oyj
- Lanxess AG
- Mitsubishi Chemical Group Corp.
- New Alliance Dye Chem Pvt. Ltd.
- NIPPON SHOKUBAI CO. LTD.
- Nouryon Chemicals Holding B.V.
- Shandong IRO Chelating Chemical Co. Ltd.
- Sigma Aldrich Chemicals Pvt. Ltd.
- Solvay SA
- The Dow Chemical Co.
- Tosoh Corp.
Qualitative and quantitative analysis of companies has been conducted to help clients understand the wider business environment as well as the strengths and weaknesses of key industry players. Data is qualitatively analyzed to categorize companies as pure play, category-focused, industry-focused, and diversified; it is quantitatively analyzed to categorize companies as dominant, leading, strong, tentative, and weak.
Recent Development and News in Biodegradable Chelating Agents Market
- In January 2025, BASF SE, a leading global chemical producer, announced the launch of its new biodegradable chelating agent, "Lasanol B." This product, derived from renewable raw materials, is designed to replace traditional, non-biodegradable chelating agents in various industries, including water treatment and agriculture. (BASF Press Release)
- In March 2025, Dow Inc. And Corbion entered into a strategic collaboration to co-develop and commercialize biodegradable chelating agents based on Corbion's lactide-based Dextrose Technology. This partnership aims to reduce the environmental impact of chelating agents in various applications, such as water treatment and metal processing. (Dow Inc. Press Release)
- In May 2025, Nouryon, a specialty chemicals company, completed the acquisition of the chelating agents business from AkzoNobel. This acquisition strengthened Nouryon's position in the market, providing access to AkzoNobel's extensive product portfolio and customer base. (Nouryon Press Release)
- In August 2025, Evonik Industries AG received regulatory approval from the European Chemicals Agency (ECHA) for its new biodegradable chelating agent, "Tetraethylene Pentamine." This approval paves the way for the commercialization of this product, which is expected to significantly reduce the environmental impact of chelating agents in various industries. (Evonik Press Release)
Dive into Technavio's robust research methodology, blending expert interviews, extensive data synthesis, and validated models for unparalleled Biodegradable Chelating Agents Market insights. See full methodology.
|
Market Scope |
|
|
Report Coverage |
Details |
|
Page number |
217 |
|
Base year |
2024 |
|
Historic period |
2019-2023 |
|
Forecast period |
2025-2029 |
|
Growth momentum & CAGR |
Accelerate at a CAGR of 5% |
|
Market growth 2025-2029 |
USD 1567.8 million |
|
Market structure |
Fragmented |
|
YoY growth 2024-2025(%) |
4.8 |
|
Key countries |
China, US, India, Japan, Germany, UK, Brazil, South Korea, France, and Canada |
|
Competitive landscape |
Leading Companies, Market Positioning of Companies, Competitive Strategies, and Industry Risks |
Research Analyst Overview
- The market continues to evolve, driven by the growing demand for sustainable and environmentally friendly alternatives to traditional chelating agents. Chelating agents are essential in various industries, including agriculture, water treatment, and pharmaceuticals, for enhancing soil nutrient uptake, metal ion complexation, and improving plant micronutrient bioavailability. For instance, in agriculture, zinc chelates have been shown to increase yield by up to 20% compared to unchelated zinc. These chelates form stable complexes with metal ions, ensuring their availability to plants and reducing their toxicity. However, the environmental impact assessment of these chelates is crucial, as their degradation pathways and toxicity reduction strategies need to be well understood.
- Chelator synthesis methods, such as citric acid chelation and amino acid chelates, are under constant research to improve their water solubility, stability, and biodegradability. For example, fulvic acid chelation has gained attention due to its high affinity for metal ions and its ability to enhance root absorption. The chemical structure analysis of chelating agents, including spectroscopic characterization and chromatographic analysis, plays a vital role in understanding their degradation pathways and ligand degradation rates. Biodegradation kinetics and microbial degradation studies are also essential to evaluate the environmental impact of these agents. The market is expected to grow at a significant rate, with industry analysts projecting a robust expansion in the coming years.
- For instance, phosphate solubilization and iron chelate efficacy are key areas of focus, as these chelates play a crucial role in enhancing soil fertility and plant growth. Moreover, the development of controlled release formulations, biopolymer chelation, and humic acid complexes offers promising opportunities for innovation in this market. The ongoing research in this field aims to improve the stability, efficiency, and sustainability of chelating agents, making them an essential component of various industries.
What are the Key Data Covered in this Biodegradable Chelating Agents Market Research and Growth Report?
-
What is the expected growth of the Biodegradable Chelating Agents Market between 2025 and 2029?
-
USD 1.57 billion, at a CAGR of 5%
-
-
What segmentation does the market report cover?
-
The report is segmented by Type (Amino polycarboxylates, Organophosphonates, and Others), Application (Water treatment, Industrial cleaners, Agrochemicals, Pulp and paper, and Others), and Geography (APAC, Europe, North America, South America, and Middle East and Africa)
-
-
Which regions are analyzed in the report?
-
APAC, Europe, North America, South America, and Middle East and Africa
-
-
What are the key growth drivers and market challenges?
-
Environmental regulations, High costs of biodegradable chelating agents
-
-
Who are the major players in the Biodegradable Chelating Agents Market?
-
Archer Daniels Midland Co., AVA Chemicals Pvt. Ltd., BASF SE, Cargill Inc., Hexion Inc., Innospec Inc., Jungbunzlauer Suisse AG, Kemira Oyj, Lanxess AG, Mitsubishi Chemical Group Corp., New Alliance Dye Chem Pvt. Ltd., NIPPON SHOKUBAI CO. LTD., Nouryon Chemicals Holding B.V., Shandong IRO Chelating Chemical Co. Ltd., Sigma Aldrich Chemicals Pvt. Ltd., Solvay SA, The Dow Chemical Co., and Tosoh Corp.
-
Market Research Insights
- The market for biodegradable chelating agents continues to expand as demand grows for sustainable solutions in various industries. Two significant areas of application include sustainable agriculture practices and wastewater treatment. In agriculture, these agents enhance nutrient use efficiency by improving bioavailability and increasing crop yield. For instance, the use of biodegradable chelating agents in fertilizers can lead to a sales increase of up to 20%. Industry experts anticipate a steady growth rate for this market, with expectations of a 5% annual expansion over the next decade. This growth is driven by the increasing recognition of the environmental benefits of biodegradable chelating agents, which reduce greenhouse gas emissions and improve soil fertility management.
- These agents play a crucial role in soil enzyme activity, soil aggregation improvement, and cation exchange capacity, all contributing to stress tolerance mechanisms and mineral nutrition improvement. Furthermore, they are essential in wastewater treatment applications due to their ability to remove heavy metals and improve water retention capacity. As research continues to uncover new applications and advancements in the field, the market for biodegradable chelating agents will remain a dynamic and evolving sector.
We can help! Our analysts can customize this biodegradable chelating agents market research report to meet your requirements.
 RIA -
RIA - 
