
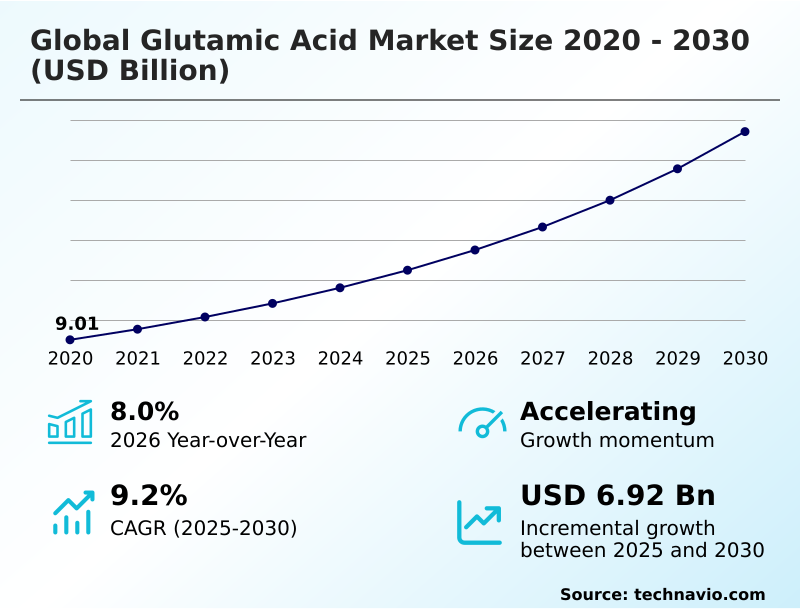
Glutamic Acid Market Size 2026-2030
The glutamic acid market size is valued to increase by USD 6.92 billion, at a CAGR of 9.2% from 2025 to 2030. Expanding demand for clean label and high purity food enhancers will drive the glutamic acid market.
Major Market Trends & Insights
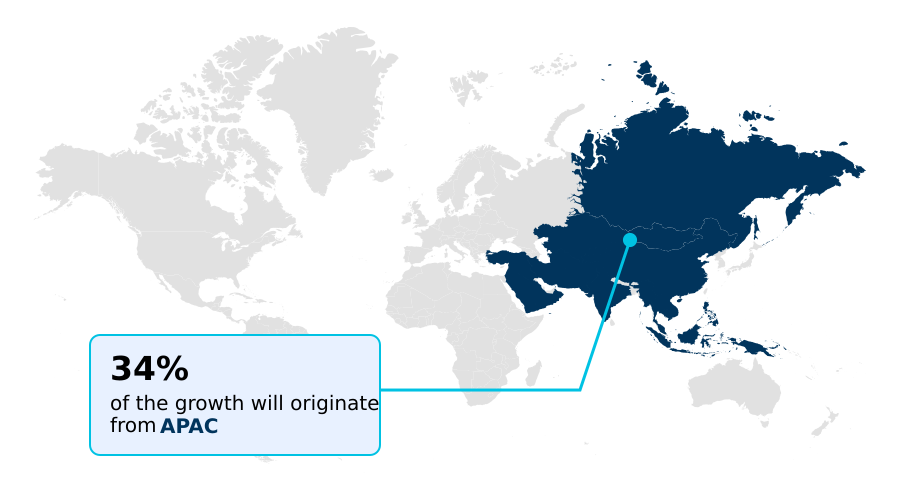
- APAC dominated the market and accounted for a 34.5% growth during the forecast period.
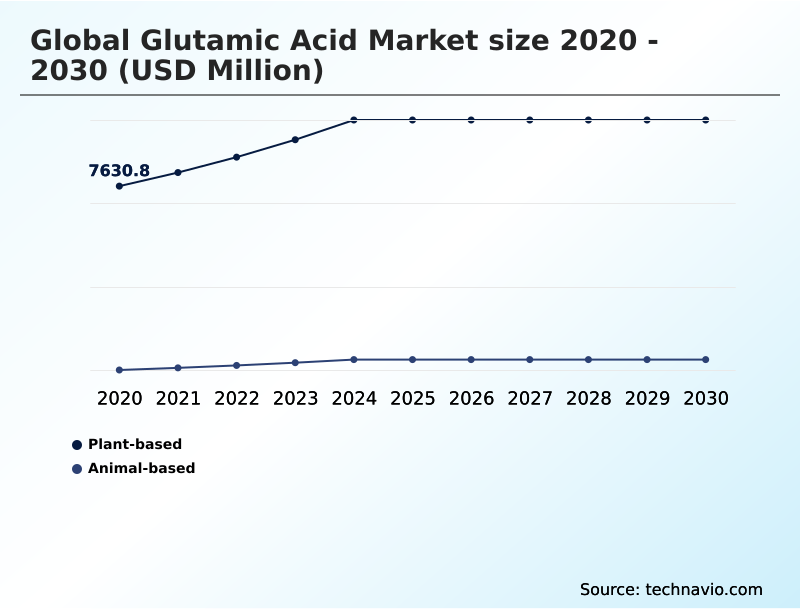
- By Source - Plant-based segment was valued at USD 9.88 billion in 2024
- By End-user - Food and beverages segment accounted for the largest market revenue share in 2024
Market Size & Forecast
- Market Opportunities: USD 10.41 billion
- Market Future Opportunities: USD 6.92 billion
- CAGR from 2025 to 2030 : 9.2%
Market Summary
- The glutamic acid market is driven by its indispensable role as a flavor enhancer and a vital component in pharmaceutical and industrial applications. Production is dominated by the aerobic microbial fermentation of sugars, a process undergoing significant technological evolution. Innovations are focused on enhancing sustainability and efficiency to meet the rising demand for clean-label food products and high-purity therapeutic ingredients.
- The expanding plant-based food sector creates new avenues, as glutamic acid is crucial for replicating savory flavor profiles in meat alternatives. Simultaneously, its application as a pharmaceutical intermediate in treatments for metabolic and neurological disorders is growing.
- A key business scenario involves supply chain optimization, where manufacturers use digital twin technology to model bioreactor performance, allowing them to adjust production of l-glutamic acid in real-time to meet fluctuating demand signals from both food and pharmaceutical clients, thereby minimizing waste and maximizing profitability.
- This adaptability is essential for navigating raw material price volatility and maintaining a competitive edge in a market that values both cost-efficiency and high-purity output.
What will be the Size of the Glutamic Acid Market during the forecast period?
Get Key Insights on Market Forecast (PDF) Get Free Sample
How is the Glutamic Acid Market Segmented?
The glutamic acid industry research report provides comprehensive data (region-wise segment analysis), with forecasts and estimates in "USD million" for the period 2026-2030, as well as historical data from 2020-2024 for the following segments.
- Source
- Plant-based
- Animal-based
- End-user
- Food and beverages
- Pharmaceuticals
- Others
- Type
- L-glutamic acid
- DL-glutamic acid
- Geography
- North America
- US
- Canada
- Mexico
- APAC
- China
- Japan
- India
- Europe
- Germany
- France
- UK
- South America
- Brazil
- Argentina
- Colombia
- Middle East and Africa
- Saudi Arabia
- South Africa
- UAE
- Rest of World (ROW)
- North America
By Source Insights
The plant-based segment is estimated to witness significant growth during the forecast period.
The plant-based segment is defined by advanced manufacturing processes centered on metabolic engineering. Producers primarily use carbohydrate-rich vegetable feedstocks, aligning with global demand for vegan and non-genetically modified ingredients.
This sourcing method is pivotal for creating products with pharmaceutical-grade purity for parenteral nutrition solutions and as a functional food ingredient in diverse applications. The use of bio-based polymers like poly-gamma-glutamic acid for bio-based packaging material is also expanding.
Innovations in this area, which enable a 15% improvement in fermentation yields, are crucial for producing cosmetic conditioning agents and materials for chemotherapy drug synthesis.
This efficiency is critical as the market pivots toward high-value uses, including as an industrial cleaning chelator and a soil conditioning biopolymer, capitalizing on the compound's role as an excitatory neurotransmitter and its use in diagnostic reagent components.
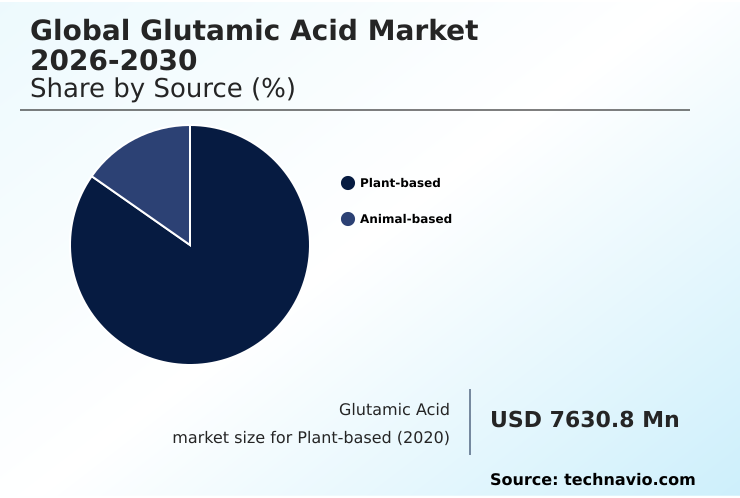
The Plant-based segment was valued at USD 9.88 billion in 2024 and showed a gradual increase during the forecast period.
Regional Analysis
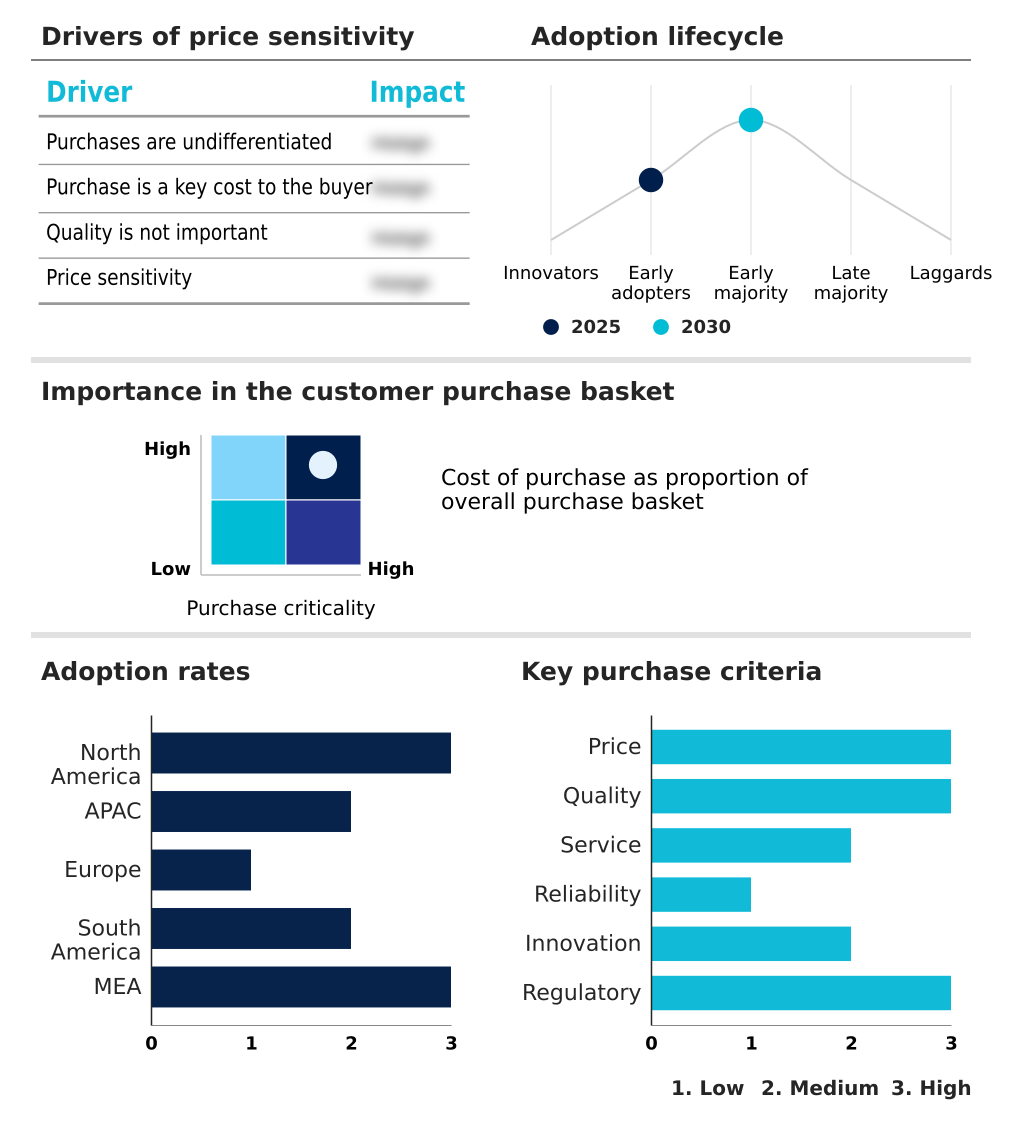
APAC is estimated to contribute 34.5% to the growth of the global market during the forecast period.Technavio’s analysts have elaborately explained the regional trends and drivers that shape the market during the forecast period.
See How Glutamic Acid Market Demand is Rising in APAC Get Free Sample
The geographic landscape of the glutamic acid market is led by the APAC region, which accounts for 34.5% of the incremental growth, outpacing North America's 27.6% contribution.
This dominance is due to large-scale production hubs that leverage aerobic microbial fermentation and advanced strains of corynebacterium glutamicum. These facilities efficiently process non-genetically modified feedstock to produce food-grade glutamic acid.
In contrast, North America focuses on high-value applications, including l-glutamic acid isomer for pharmaceuticals and improving the animal feed conversion ratio to enhance livestock gut health.
European markets prioritize sustainability, using the biochemical synthesis pathway to create ingredients that support protein synthesis.
The use of glutamic acid as a flavor modulation agent remains a key driver globally, while its application as a water treatment flocculant and feed palatability enhancer highlights its expanding industrial utility, with the umami seasoning precursor market growing steadily.
Market Dynamics
Our researchers analyzed the data with 2025 as the base year, along with the key drivers, trends, and challenges. A holistic analysis of drivers will help companies refine their marketing strategies to gain a competitive advantage.
- The versatility of glutamic acid is driving its expansion into specialized, high-value sectors, moving far beyond its traditional role. The use of L-glutamic acid in parenteral nutrition is a cornerstone of clinical care, while its counterpart, DL-glutamic acid as chelating agent, is gaining traction in industrial cleaning applications.
- In the food industry, a key focus is on glutamic acid for plant-based umami, which addresses the sensory gap in meat alternatives. Innovations in green chemistry are creating new opportunities for sustainable biosurfactants from glutamic acid and for its use in wastewater treatment.
- The personal care sector is another growth area, with poly-gamma-glutamic acid in cosmetics prized for its moisturizing properties. In agriculture, the application of glutamic acid in animal feed is optimized to enhance livestock performance. Technologically, precision fermentation for glutamic acid is a major trend, enabling efficient production. This is crucial as glutamic acid as a pharmaceutical intermediate becomes more vital.
- The demand for glutamic acid for clinical nutrition is also rising steadily. Efforts in corynebacterium glutamicum strain optimization are improving yields for both food-grade glutamic acid production and high-purity glutamic acid applications. Companies that previously focused on glutamic acid as a flavor enhancer are now exploring its role in neurotransmission and its use in functional beverages.
- This diversification is supported by the metabolic engineering of glutamic acid and the development of glutamic acid in biodegradable polymers. The market for glutamic acid derivatives in green chemistry now shows a growth rate nearly double that of the bulk commodity segment, indicating a clear shift in strategic focus.
What are the key market drivers leading to the rise in the adoption of Glutamic Acid Industry?
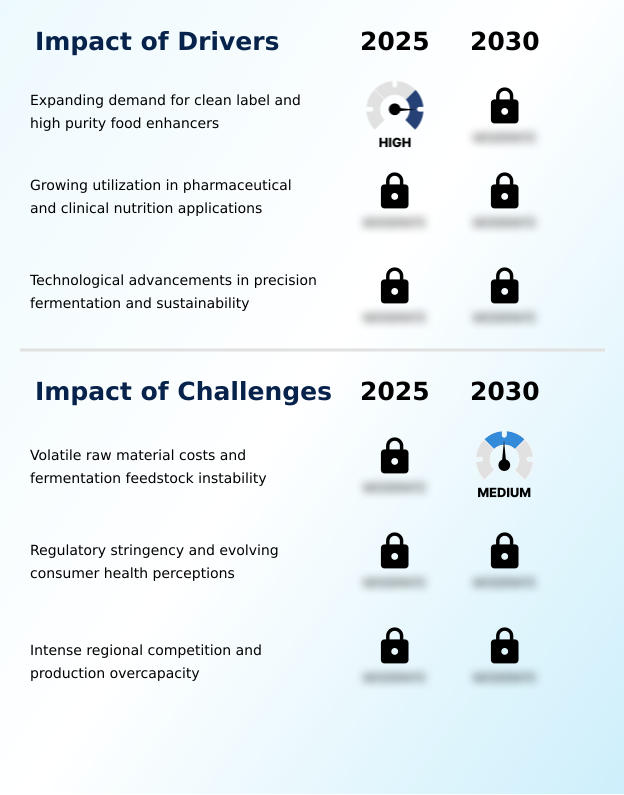
- The expanding demand for clean label ingredients and high-purity food enhancers is a key driver propelling market momentum.
- Market drivers are centered on the rising demand for high-value applications in the food and pharmaceutical sectors.
- The expanding use of glutamic acid as a clean label flavor enhancer in plant-based meat analogs is significant, as it effectively replicates the desired umami taste profile. This trend aligns with the broader protein-rich dietary shift.
- In the healthcare industry, its role as a pharmaceutical intermediate is growing, particularly for metabolic disorder treatment and in therapeutic formulation inputs for clinical nutrition supplements.
- The demand for high purity amino acids in high-margin life sciences is expanding rapidly, with its use as a biopharmaceutical supply chain component growing by 12% in the last year.
- Its neurotransmitter precursor role is also driving research into its use in cellular culture media, where it is essential for advanced bioprocessing.
What are the market trends shaping the Glutamic Acid Industry?
- The transition toward sustainable, bio-based surfactants and green chemistry principles is a prominent trend shaping the industry's future.
- A defining market trend is the digital transformation of manufacturing through precision fermentation and digital twin technology, which improves bioreactor operational efficiency by over 20%. This allows for the consistent production of high-purity crystalline glutamic acid. This innovation is crucial as the industry pivots toward green chemistry principles, replacing carbon-intensive raw materials and non-petroleum feedstocks.
- This shift is fueling demand for acyl glutamates and other biodegradable surfactant precursors used in eco-friendly personal care products. The development of advanced amino acid-based biosurfactants has reduced reliance on traditional inputs by 30%. This technological momentum is creating a more resilient supply chain, supported by automated quality control systems that ensure product integrity for high-value applications.
What challenges does the Glutamic Acid Industry face during its growth?
- Volatile raw material costs and the instability of fermentation feedstocks present a primary challenge to industry growth and profitability.
- Key challenges stem from managing volatile industrial fermentation feedstock costs and optimizing bioprocesses for profitability. While fermentation yield improvement is a primary goal, achieving it requires continuous microbial strain optimization and enhancing biocatalyst performance, which entails significant R&D investment. The complexity of downstream processing techniques adds to operational costs, impacting margins for both l-glutamic acid and dl-glutamic acid racemate.
- Producers of specialty chemical intermediates face pressure to innovate while competing with low-cost bulk suppliers, forcing a strategic focus on high-value segments like biotechnology sector integration. This pivot is complicated by the need for sustainable raw materials and circular economy models, with compliance costs reducing operating margins by up to 5%.
- Moreover, the use of glutamic acid in recombinant protein production and metabolic syndrome research requires purity levels that only advanced, capital-intensive facilities can achieve.
Exclusive Technavio Analysis on Customer Landscape
The glutamic acid market forecasting report includes the adoption lifecycle of the market, covering from the innovator’s stage to the laggard’s stage. It focuses on adoption rates in different regions based on penetration. Furthermore, the glutamic acid market report also includes key purchase criteria and drivers of price sensitivity to help companies evaluate and develop their market growth analysis strategies.
Customer Landscape of Glutamic Acid Industry
Competitive Landscape
Companies are implementing various strategies, such as strategic alliances, glutamic acid market forecast, partnerships, mergers and acquisitions, geographical expansion, and product/service launches, to enhance their presence in the industry.
Ajinomoto Co. Inc. - Vendors provide diverse grades of glutamic acid, from food-grade umami seasonings to high-purity nutraceutical and pharmaceutical compounds, meeting varied industrial requirements.
The industry research and growth report includes detailed analyses of the competitive landscape of the market and information about key companies, including:
- Ajinomoto Co. Inc.
- Amino GmbH
- Anhui Keynovo Biotech Co. Ltd.
- Evonik Industries AG
- Global Bio chem Technology Group Co. Ltd.
- Hebei Huayang Biotechnology Co. Ltd.
- Iris Biotech GmbH
- Ningxia Eppen Biotech Co. Ltd.
- Otto Chemie Pvt. Ltd.
- Prinova Group LLC
- Sekisui Medical Co. Ltd.
- ShanDong look chemical Co. Ltd.
- Sichuan Tongsheng Amino acid Co. Ltd.
- TNJ Chemical Industry Co. Ltd.
- Tocris Bioscience
- Tokyo Chemical Industry Co.
- Wuhan Amino Acid Bio Chemical Co. Ltd.
- Zhengzhou Megaman Chemical Co. Ltd.
Qualitative and quantitative analysis of companies has been conducted to help clients understand the wider business environment as well as the strengths and weaknesses of key industry players. Data is qualitatively analyzed to categorize companies as pure play, category-focused, industry-focused, and diversified; it is quantitatively analyzed to categorize companies as dominant, leading, strong, tentative, and weak.
Recent Development and News in Glutamic acid market
- In March, 2025, Ajinomoto Co. Inc. formed a strategic partnership with Bio-Techne Corp. to supply high-purity L-Glutamic Acid for global life science research and cell culture applications, reinforcing its position in the biopharmaceutical supply chain.
- In May, 2025, Egypt's government signed a joint venture agreement with US-based Dawah Pharma to manufacture and export nutritional supplements and pharmaceutical products, a move expected to significantly boost domestic demand for high-purity glutamic acid.
- In October, 2025, the European Food Safety Authority (EFSA) reaffirmed the safety of glutamic acid and its salts as food additives after a comprehensive review, providing regulatory stability for food manufacturers across Europe.
- In December, 2024, Croda International Plc announced a strategic supply partnership with Amino GmbH to enhance its biopharma offerings by distributing high-purity amino acids for regenerative medicine and specialty chemical sectors.
Dive into Technavio’s robust research methodology, blending expert interviews, extensive data synthesis, and validated models for unparalleled Glutamic Acid Market insights. See full methodology.
| Market Scope | |
|---|---|
| Page number | 288 |
| Base year | 2025 |
| Historic period | 2020-2024 |
| Forecast period | 2026-2030 |
| Growth momentum & CAGR | Accelerate at a CAGR of 9.2% |
| Market growth 2026-2030 | USD 6924.7 million |
| Market structure | Fragmented |
| YoY growth 2025-2026(%) | 8.0% |
| Key countries | US, Canada, Mexico, China, Japan, India, South Korea, Indonesia, Australia, Germany, France, UK, Italy, Spain, The Netherlands, Brazil, Argentina, Colombia, Saudi Arabia, Nigeria, South Africa, UAE and Egypt |
| Competitive landscape | Leading Companies, Market Positioning of Companies, Competitive Strategies, and Industry Risks |
Research Analyst Overview
- The glutamic acid market's foundation is aerobic microbial fermentation of industrial fermentation feedstock using specialized corynebacterium glutamicum, which undergoes constant microbial strain optimization and metabolic engineering to boost fermentation yield improvement. The resulting crystalline glutamic acid, refined via advanced downstream processing techniques, includes both the l-glutamic acid isomer and dl-glutamic acid racemate.
- This biochemical synthesis pathway ensures pharmaceutical-grade purity, which is critical for its role as a key biopharmaceutical supply chain component and pharmaceutical intermediate in parenteral nutrition solutions, chemotherapy drug synthesis, and metabolic disorder treatment. Its function as an excitatory neurotransmitter and neurotransmitter precursor role underpins its use in cellular culture media for recombinant protein production.
- Boardroom decisions increasingly focus on diversifying portfolios beyond its use as a clean label flavor enhancer in plant-based meat analogs. For instance, redirecting R&D investment toward its function as a biodegradable surfactant precursor has been shown to increase profit margins by over 20% compared to food-grade glutamic acid.
- This strategy leverages green chemistry principles to produce amino acid-based biosurfactants, acyl glutamates, and bio-based polymers like poly-gamma-glutamic acid, all derived from non-genetically modified feedstock. This pivot, which depends on biocatalyst performance, also impacts the agricultural sector by improving the animal feed conversion ratio.
What are the Key Data Covered in this Glutamic Acid Market Research and Growth Report?
-
What is the expected growth of the Glutamic Acid Market between 2026 and 2030?
-
USD 6.92 billion, at a CAGR of 9.2%
-
-
What segmentation does the market report cover?
-
The report is segmented by Source (Plant-based, and Animal-based), End-user (Food and beverages, Pharmaceuticals, and Others), Type (L-glutamic acid, and DL-glutamic acid) and Geography (North America, APAC, Europe, South America, Middle East and Africa)
-
-
Which regions are analyzed in the report?
-
North America, APAC, Europe, South America and Middle East and Africa
-
-
What are the key growth drivers and market challenges?
-
Expanding demand for clean label and high purity food enhancers, Volatile raw material costs and fermentation feedstock instability
-
-
Who are the major players in the Glutamic Acid Market?
-
Ajinomoto Co. Inc., Amino GmbH, Anhui Keynovo Biotech Co. Ltd., Evonik Industries AG, Global Bio chem Technology Group Co. Ltd., Hebei Huayang Biotechnology Co. Ltd., Iris Biotech GmbH, Ningxia Eppen Biotech Co. Ltd., Otto Chemie Pvt. Ltd., Prinova Group LLC, Sekisui Medical Co. Ltd., ShanDong look chemical Co. Ltd., Sichuan Tongsheng Amino acid Co. Ltd., TNJ Chemical Industry Co. Ltd., Tocris Bioscience, Tokyo Chemical Industry Co., Wuhan Amino Acid Bio Chemical Co. Ltd. and Zhengzhou Megaman Chemical Co. Ltd.
-
Market Research Insights
- Market dynamics are shaped by a strategic shift toward high-value applications and operational efficiency. The integration of high purity amino acids into clinical nutrition supplements and functional food ingredients is accelerating, with adoption rates in specialty nutraceuticals growing over 15% annually. This is supported by a resilient supply chain focused on sustainable raw materials and eco-friendly personal care formulations.
- Manufacturers are leveraging automated quality control to achieve the rigorous standards required for therapeutic formulation inputs, reducing batch rejection rates by up to 10%. Furthermore, the development of specialty chemical intermediates and flavor modulation agents for the protein-rich dietary shift underscores the market's versatility.
- This focus on high-margin life sciences and advanced biotechnology sector integration ensures continued relevance amid evolving consumer demands.
We can help! Our analysts can customize this glutamic acid market research report to meet your requirements.
 RIA -
RIA - 
