
Bioethanol Market Size 2025-2029
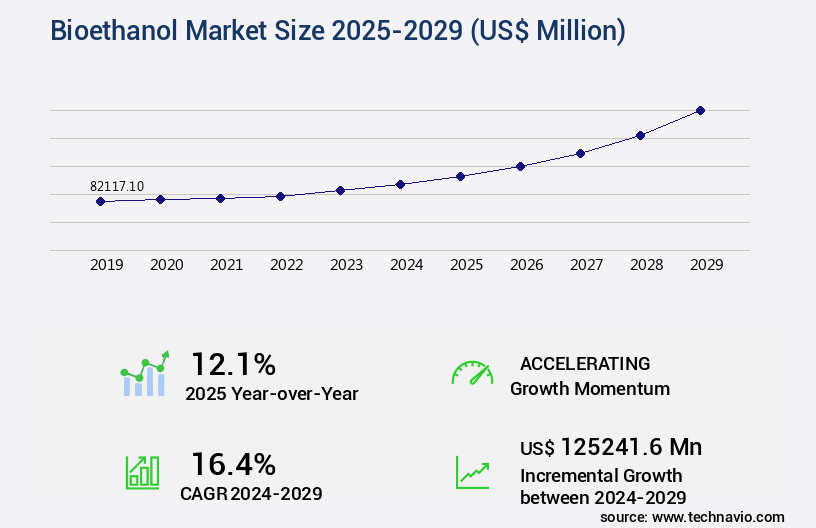
The bioethanol market size is valued to increase USD 125.24 billion, at a CAGR of 16.4% from 2024 to 2029. Increasing demand for continuous supply of clean fuel will drive the bioethanol market.
Major Market Trends & Insights
- North America dominated the market and accounted for a 53% growth during the forecast period.
- By Raw Material - Starch segment was valued at USD 27.34 billion in 2023
- By End-user - Transportation segment accounted for the largest market revenue share in 2023
Market Size & Forecast
- Market Opportunities: USD 186.87 million
- Market Future Opportunities: USD 125241.60 million
- CAGR from 2024 to 2029 : 16.4%
Market Summary
- The market represents a significant and continually evolving sector in the renewable energy industry. With increasing global concerns over carbon emissions and the need for sustainable fuel alternatives, the demand for bioethanol as a clean and renewable fuel source is on the rise. According to recent reports, bioethanol accounted for over 10% of the global fuel ethanol production in 2020. Core technologies and applications, such as enzymatic hydrolysis and fermentation, continue to advance, driving efficiency and reducing production costs. Bioethanol is increasingly being adopted as a transport fuel, with the automotive industry investing heavily in the development of flexible-fuel vehicles and infrastructure to support their use.
- However, market growth is not without challenges. Fluctuation in prices of crude oil and other feedstocks, as well as regulatory frameworks and trade policies, can impact the profitability of bioethanol production. Despite these challenges, opportunities exist in emerging markets and the development of advanced technologies, such as cellulosic bioethanol, to further expand the market's potential.
What will be the Size of the Bioethanol Market during the forecast period?
Get Key Insights on Market Forecast (PDF) Request Free Sample
How is the Bioethanol Market Segmented ?
The bioethanol industry research report provides comprehensive data (region-wise segment analysis), with forecasts and estimates in "USD million" for the period 2025-2029, as well as historical data from 2019-2023 for the following segments.
- Raw Material
- Starch
- Sugar
- Cellulose
- Others
- End-user
- Transportation
- Pharmaceuticals
- Cosmetics
- Alcoholic beverages
- Type
- E10
- E85
- E20 and E25
- E70 and E75
- Others
- Geography
- North America
- US
- Canada
- Europe
- France
- Germany
- UK
- APAC
- China
- India
- Indonesia
- Thailand
- South America
- Brazil
- Rest of World (ROW)
- North America
By Raw Material Insights
The starch segment is estimated to witness significant growth during the forecast period.
Bioethanol production continues to gain traction as a renewable energy source in the transportation sector, with ethanol blending becoming increasingly common in fuel specifications. In 2024, the starch segment held a substantial market share, accounting for approximately 45% of the industry. This dominance is due to the availability of a vast array of starch-based crops, such as wheat, barley, corn, and rye, along with starch-containing raw materials like tapioca, cassava, and potato. The hydrolysis process breaks down the chemical bonds among starch's monomer units, yielding simple sugars like glucose. Subsequently, the fermentation process converts glucose into bioethanol and carbon dioxide.
The demand for starch-based bioethanol is driven by the expanding markets in APAC and North America. Moreover, the transportation logistics sector benefits from ethanol yield optimization and wastewater treatment during the production process. Distillation techniques and byproduct utilization further enhance the efficiency of fuel ethanol production. Microbial fermentation and purification processes ensure quality control, while engine performance and emission reduction are key advantages of using bioethanol as a fuel additive. Looking ahead, the industry anticipates a growth trajectory, with the ethanol from lignocellulosic biomass segment projected to expand by 35% by 2026. Additionally, the adoption of pretreatment methods, such as enzyme hydrolysis, and the use of yeast strains like Saccharomyces cerevisiae contribute to the increasing production of cellulosic ethanol from agricultural residues and biomass conversion.
Process optimization, energy efficiency, and carbon footprint reduction are essential considerations in the market. Separation technologies, reactor design, and dehydration techniques are crucial components in the production process, ensuring the highest possible product quality and yield. The fuel ethanol industry's continuous evolution reflects its commitment to sustainability and the reduction of greenhouse gas emissions.
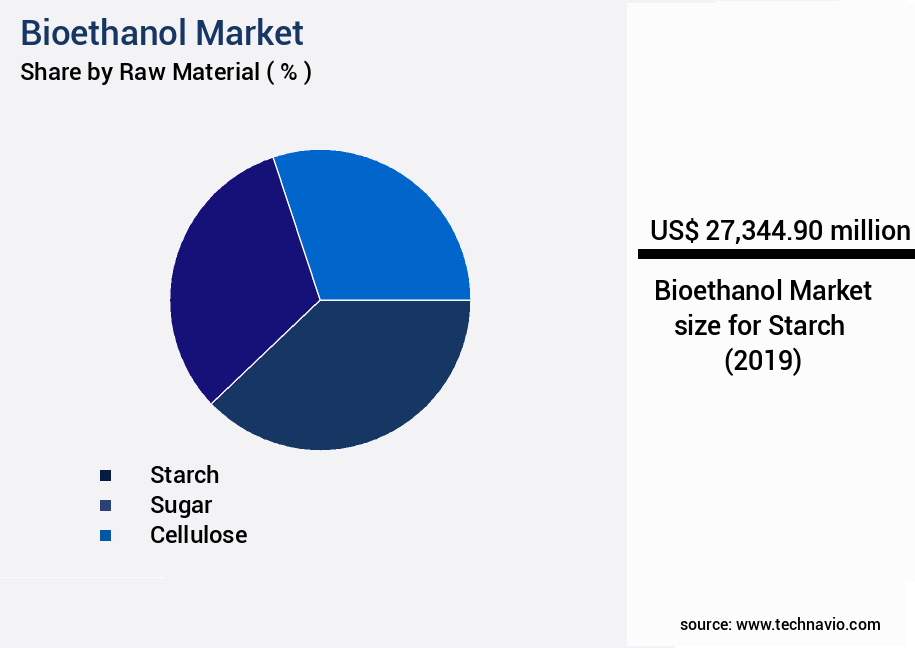
The Starch segment was valued at USD 27.34 billion in 2019 and showed a gradual increase during the forecast period.

Regional Analysis
North America is estimated to contribute 53% to the growth of the global market during the forecast period.Technavio's analysts have elaborately explained the regional trends and drivers that shape the market during the forecast period.

See How Bioethanol Market Demand is Rising in North America Request Free Sample
The North American region dominates The market, driven by robust government support for producers and research and development initiatives. In 2024, North America accounted for a significant market share, with the US and Canada being key contributors. The US government's provision of special grants, loans, and funds to bioethanol producers and research has led to technological advancements and improved quality and yield.
As a result, North America is expected to maintain its leading position in The market over the forecast period. The region's extensive arable land also facilitates the production of feedstock, further bolstering its market position.
Market Dynamics
Our researchers analyzed the data with 2024 as the base year, along with the key drivers, trends, and challenges. A holistic analysis of drivers will help companies refine their marketing strategies to gain a competitive advantage.
The market is witnessing significant advancements in production methods, aiming to improve ethanol yield from traditional feedstocks like sugarcane and explore new avenues using lignocellulosic biomass. Innovative pretreatment strategies for lignocellulosic biomass are gaining traction, enabling efficient conversion of complex biomass into bioethanol. In parallel, researchers are focusing on optimizing distillation techniques to enhance ethanol purity and reduce energy consumption. Reducing greenhouse gas emissions is a critical concern in the bioethanol industry, with life cycle assessment studies revealing that ethanol production can contribute substantially to carbon reduction. The economic feasibility of cellulosic ethanol is under intense scrutiny, with ongoing efforts to optimize fermentation parameters and minimize water usage and wastewater treatment in bioethanol plants.
Bioethanol storage and transportation infrastructure is another essential aspect, with the need for efficient, cost-effective, and safe storage and transportation solutions. The impact of bioethanol on engine performance and its comparison with gasoline blends is a topic of ongoing debate, with regulatory frameworks around the world setting guidelines for bioethanol blend ratios. Byproduct valorization in bioethanol processes is a growing trend, as companies explore ways to extract additional value from the byproducts of ethanol production. Sustainable feedstock sourcing is a priority, with efforts to minimize the environmental impact of feedstock cultivation and transportation. Energy efficiency improvements and the integration of renewable energy sources with bioethanol plants are also key focus areas.
Development of novel yeast strains and advanced separation and purification techniques for bioethanol are ongoing, with the goal of increasing productivity and reducing costs. Quality control measures in bioethanol manufacturing are essential to ensure consistent product quality and meet regulatory requirements. According to market intelligence, more than 60% of new bioethanol production capacity is being added in Asia Pacific, with China and Brazil leading the way. This region is expected to account for over 55% of the market share by 2025. In contrast, North America and Europe are witnessing a decline in production due to maturing markets and shifting consumer preferences towards electric vehicles.
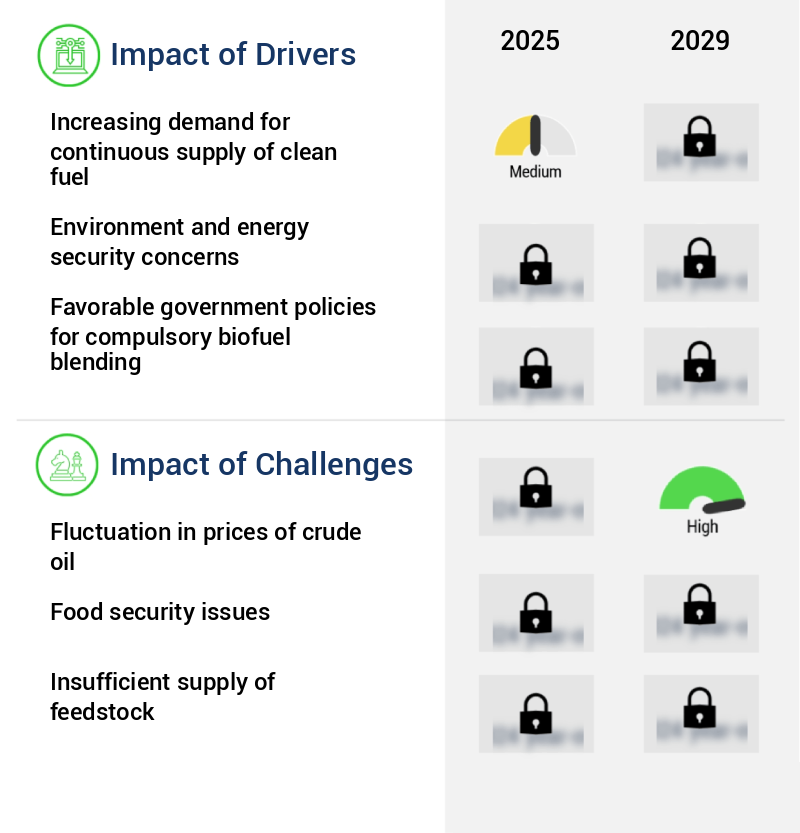
What are the key market drivers leading to the rise in the adoption of Bioethanol Industry?
- The unrelenting demand for a consistent supply of clean fuel serves as the primary market catalyst.
- The global shift towards energy security and emission reduction has fueled the demand for clean alternative fuels in various commercial sectors. Among these, biofuels, derived from renewable sources like energy crops, cellulosic plants, and organic products, have gained significant attention. For instance, the Indian Oil Corporation is leading the way in India by setting up 400 ethanol pump stations in key states such as Karnataka, Tamil Nadu, Uttar Pradesh, and Maharashtra. This move reflects the increasing preference for biofuels in the transportation sector.
- In the United States, the biofuels industry has seen a notable expansion, with bioethanol accounting for approximately 10% of the country's total fuel consumption in 2024. This shift towards renewable fuels is a response to the ongoing uncertainty in global energy markets and the need to reduce carbon emissions.
What are the market trends shaping the Bioethanol Industry?
- The growing adoption of bioethanol as a transport fuel represents an emerging market trend. Bioethanol's increasing utilization as an automotive fuel signifies a significant market development.
- The transportation sector is a significant contributor to global greenhouse gas (GHG) emissions, with fossil fuels like gasoline and diesel being its primary sources. According to the International Energy Agency (IEA), the transportation sector accounts for approximately a quarter of the world's total energy-related CO2 emissions. Biofuels, such as bioethanol and biomethane, are gaining traction as low-carbon alternatives to traditional transport fuels. Bioethanol, derived from renewable biomass, is a promising substitute for gasoline, offering potential for sustainable mobility. The IEA reports that biofuel production for transport applications has seen substantial growth in recent years.
- Bioethanol, in particular, has emerged as a viable solution due to its availability and compatibility with existing infrastructure. This shift towards low-carbon alternatives is a response to growing environmental concerns and the need to reduce the sector's carbon footprint.
What challenges does the Bioethanol Industry face during its growth?
- The volatility in crude oil prices poses a significant challenge to the growth of the industry.
- Bioethanol, a renewable fuel derived from plant materials, has been gaining traction as a substitute for crude oil products like diesel and gasoline. However, the unpredictable fluctuations in crude oil prices have significantly impacted the market. The decrease in oil prices is a result of a persistent demand-supply imbalance in the global crude oil markets, which has influenced the demand for bioethanol and other alternative renewable fuels. Despite the drop in oil prices, governments continue to subsidize renewable biofuels to encourage investment and consumer adoption.
- The price gap between conventional fuels and biofuels has widened due to the low oil prices, necessitating increased subsidies to maintain the competitiveness of bioethanol. Crude oil and bioethanol serve as interchangeable fuels in various sectors, including transportation and industrial applications. As the market for bioethanol evolves, it is essential to monitor ongoing trends and price dynamics to make informed business decisions.
Exclusive Technavio Analysis on Customer Landscape
The bioethanol market forecasting report includes the adoption lifecycle of the market, covering from the innovator's stage to the laggard's stage. It focuses on adoption rates in different regions based on penetration. Furthermore, the bioethanol market report also includes key purchase criteria and drivers of price sensitivity to help companies evaluate and develop their market growth analysis strategies.

Customer Landscape of Bioethanol Industry
Competitive Landscape
Companies are implementing various strategies, such as strategic alliances, bioethanol market forecast, partnerships, mergers and acquisitions, geographical expansion, and product/service launches, to enhance their presence in the industry.
Abengoa - The company specializes in producing bioethanol for transportation fuel, sourcing raw materials from biomass cereals, cellulosic biomass, and oleaginous seeds. This renewable energy solution contributes to reducing greenhouse gas emissions and promoting sustainable practices in the energy sector.
The industry research and growth report includes detailed analyses of the competitive landscape of the market and information about key companies, including:
- Abengoa
- Aemetis Inc.
- ALTO INGREDIENTS Inc.
- Archer Daniels Midland Co.
- BP Plc
- Cristal Union Group
- DuPont de Nemours Inc.
- Green Plains Inc.
- Honeywell International Inc.
- Pannonia Bio Zrt.
- POET LLC
- Praj Industries Ltd.
- Sekab
- Shell plc
- SZVG eG
- Tereos Participations
- The Andersons Inc.
- United Petroleum Pty Ltd.
- Valero Energy Corp.
Qualitative and quantitative analysis of companies has been conducted to help clients understand the wider business environment as well as the strengths and weaknesses of key industry players. Data is qualitatively analyzed to categorize companies as pure play, category-focused, industry-focused, and diversified; it is quantitatively analyzed to categorize companies as dominant, leading, strong, tentative, and weak.
Recent Development and News in Bioethanol Market
- In January 2024, DuPont Nutrition & Biosciences, a leading biotech company, announced the commercial launch of its new enzyme, Danisco Bioethanol BELASE Complete F, designed to improve bioethanol production efficiency by up to 3% (DuPont press release).
- In March 2024, Archer Daniels Midland Company (ADM) and Valero Renewable Energy entered into a strategic partnership to construct a new bioethanol plant in the United States, with an estimated capacity of 100 million gallons per year (ADM press release).
- In April 2024, Lanzess AG, a leading specialty chemical company, completed the acquisition of Verenium Corporation, a biotechnology company specializing in cellulosic ethanol production, for approximately USD350 million (Lanzess press release).
- In May 2025, the European Commission approved the use of food waste as feedstock for bioethanol production, marking a significant policy change that is expected to boost the European the market (European Commission press release).
Dive into Technavio's robust research methodology, blending expert interviews, extensive data synthesis, and validated models for unparalleled Bioethanol Market insights. See full methodology.
|
Market Scope |
|
|
Report Coverage |
Details |
|
Page number |
236 |
|
Base year |
2024 |
|
Historic period |
2019-2023 |
|
Forecast period |
2025-2029 |
|
Growth momentum & CAGR |
Accelerate at a CAGR of 16.4% |
|
Market growth 2025-2029 |
USD 125241.6 million |
|
Market structure |
Fragmented |
|
YoY growth 2024-2025(%) |
12.1 |
|
Key countries |
US, China, Brazil, India, Thailand, Germany, France, UK, Indonesia, and Canada |
|
Competitive landscape |
Leading Companies, Market Positioning of Companies, Competitive Strategies, and Industry Risks |
Research Analyst Overview
- In the dynamic and evolving the market, various sectors intertwine to optimize ethanol production and utilization. Ethanol blending in transportation logistics continues to gain traction as a renewable energy source, with increasing adoption driving market activity. Ethanol yield optimization in sugarcane processing and distillation techniques plays a crucial role in enhancing production efficiency. Byproduct utilization from the fermentation process is another key area of focus, as wastewater treatment and fuel specifications are continually refined. Microbial fermentation and purification processes undergo continuous improvement to ensure high-quality fuel ethanol production. Quality control measures are essential in maintaining engine performance and emission reduction targets.
- The market demonstrates a strong commitment to sustainability, with enzyme hydrolysis and feedstock supply chain optimization being critical aspects. Storage and handling, separation technologies, and reactor design are essential components of the bioethanol value chain, ensuring energy efficiency and carbon footprint reduction. Lignocellulosic biomass, including agricultural residues and pretreatment methods, is increasingly used as a feedstock for bioethanol production. Yeast strains and dehydration techniques are continually evolving to maximize ethanol yields and improve overall process optimization. Cellulosic ethanol, a sustainable fuel derived from non-food sources, is gaining momentum as a promising alternative to traditional ethanol derived from grains.
- The market's ongoing evolution reflects a commitment to innovation and sustainability, making it an essential contributor to the renewable energy landscape.
What are the Key Data Covered in this Bioethanol Market Research and Growth Report?
-
What is the expected growth of the Bioethanol Market between 2025 and 2029?
-
USD 125.24 billion, at a CAGR of 16.4%
-
-
What segmentation does the market report cover?
-
The report is segmented by Raw Material (Starch, Sugar, Cellulose, and Others), End-user (Transportation, Pharmaceuticals, Cosmetics, and Alcoholic beverages), Type (E10, E85, E20 and E25, E70 and E75, and Others), and Geography (North America, APAC, Europe, South America, and Middle East and Africa)
-
-
Which regions are analyzed in the report?
-
North America, APAC, Europe, South America, and Middle East and Africa
-
-
What are the key growth drivers and market challenges?
-
Increasing demand for continuous supply of clean fuel, Fluctuation in prices of crude oil
-
-
Who are the major players in the Bioethanol Market?
-
Abengoa, Aemetis Inc., ALTO INGREDIENTS Inc., Archer Daniels Midland Co., BP Plc, Cristal Union Group, DuPont de Nemours Inc., Green Plains Inc., Honeywell International Inc., Pannonia Bio Zrt., POET LLC, Praj Industries Ltd., Sekab, Shell plc, SZVG eG, Tereos Participations, The Andersons Inc., United Petroleum Pty Ltd., and Valero Energy Corp.
-
Market Research Insights
- The market is a dynamic and evolving industry, characterized by ongoing advancements in technology and regulatory compliance. In 2020, global bioethanol production reached 150 billion liters, a significant increase from the 135 billion liters produced in 2015. This growth can be attributed to the increasing energy balance and economic viability of bioethanol production, as well as advancements in process control technologies such as adsorption process, distillation column, membrane separation, and azeotropic distillation. Despite this growth, challenges persist, including consumer acceptance, regulatory compliance, and environmental impact. For instance, greenhouse gas emissions from bioethanol production must be minimized to meet sustainability metrics.
- Corn stover and sugarcane bagasse are increasingly being used as feedstocks to reduce the environmental impact of production. Additionally, safety standards and quality assurance measures are essential to ensure product consistency and consumer confidence. Fuel distribution and regulatory compliance also present challenges. Life cycle costing and pretreatment technology are critical to ensuring the economic viability of bioethanol production and distribution. Technological innovation continues to drive improvements in fermentation efficiency, reactor monitoring, and molecular distillation, enhancing product quality and market competitiveness. Overall, the market is a complex and dynamic industry, requiring continuous attention to process control, energy balance, and regulatory compliance.
We can help! Our analysts can customize this bioethanol market research report to meet your requirements.
 RIA -
RIA - 
