Biosimulation Market Analysis, Size, and Forecast 2024-2028: North America (US and Canada), Europe (France, Germany, Italy, and UK), Middle East and Africa (Egypt, KSA, Oman, and UAE), APAC (China, India, and Japan), South America (Argentina and Brazil), and Rest of World (ROW)

Biosimulation Market Analysis, Size, and Forecast 2024-2028:
North America (US and Canada), Europe (France, Germany, Italy, and UK), Middle East and Africa (Egypt, KSA, Oman, and UAE), APAC (China, India, and Japan), South America (Argentina and Brazil), and Rest of World (ROW)

Published: Aug 2024 168 Pages SKU: IRTNTR43362

Market Overview at a Glance

$4.74 B
Market Opportunity
18.52%
CAGR
15.18
YoY growth 2023-2024(%)

Biosimulation Market Size 2024-2028

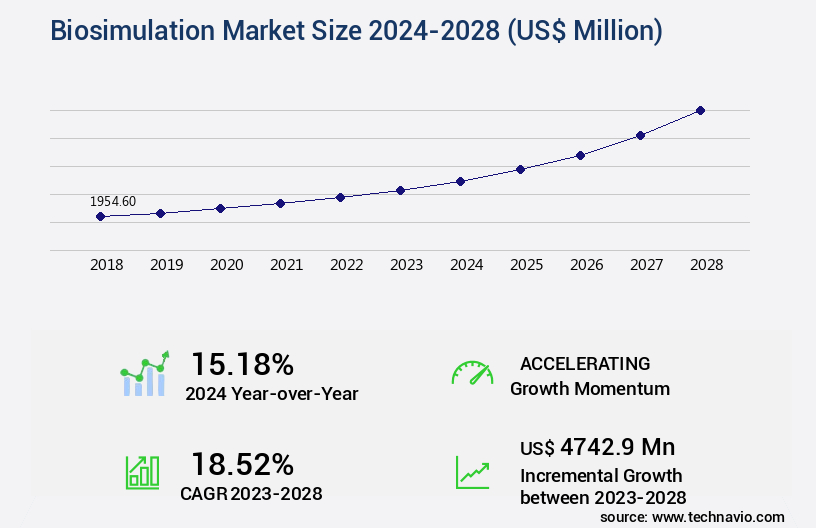
The biosimulation market size is valued to increase USD 4.74 billion, at a CAGR of 18.52% from 2023 to 2028. Increase in research funding and grants will drive the biosimulation market.

Major Market Trends & Insights

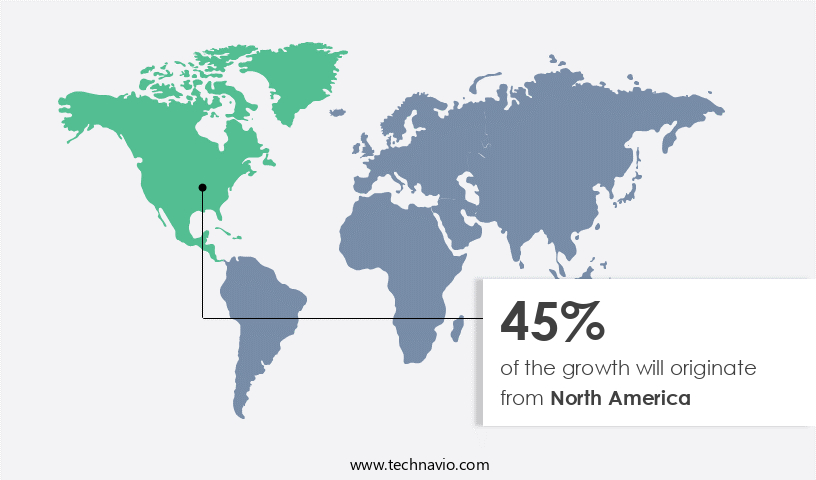
  • North America dominated the market and accounted for a 45% growth during the forecast period.
  • By End-user - Pharmaceuticals and biotechnology companies segment was valued at USD 1.05 billion in 2022
  • By Product - Software segment accounted for the largest market revenue share in 2022

Market Size & Forecast

  • Market Opportunities: USD 323.88 million
  • Market Future Opportunities: USD 4742.90 million
  • CAGR from 2023 to 2028 : 18.52%

Market Summary

  • The market represents a dynamic and innovative industry, driven by advancements in core technologies and applications. With the increasing implementation of big data and mathematical models for drug discovery, biosimulation has emerged as a critical tool in the pharmaceutical sector. According to recent reports, the adoption rate of biosimulation in drug development is projected to reach 50% by 2025. However, this evolving market also faces challenges, such as misconceptions about computer system validation and regulatory compliance.
  • Service types, including consulting and custom simulation, as well as product categories, such as software and hardware solutions, continue to shape the market landscape. As research funding and grants for biosimulation initiatives increase, the market is poised for continued growth and transformation.

What will be the Size of the Biosimulation Market during the forecast period?

Biosimulation Market Size

Get Key Insights on Market Forecast (PDF) Request Free Sample

How is the Biosimulation Market Segmented ?

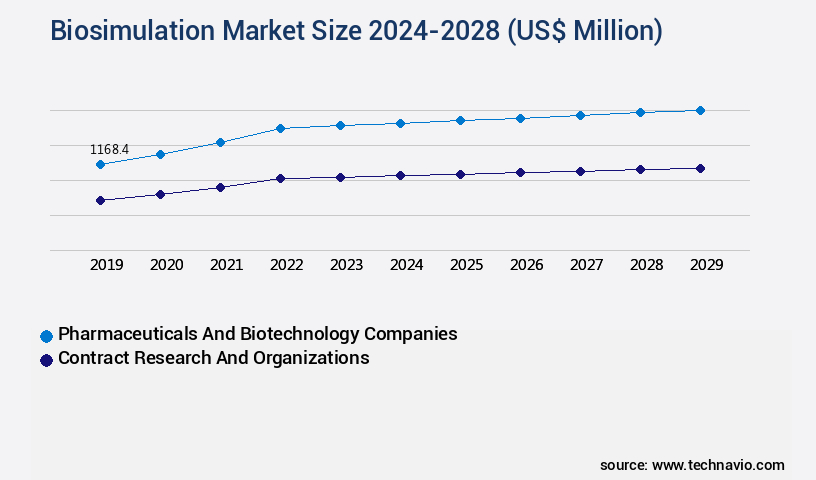
The biosimulation industry research report provides comprehensive data (region-wise segment analysis), with forecasts and estimates in "USD million" for the period 2024-2028, as well as historical data from 2018-2022 for the following segments.

  • End-user
    • Pharmaceuticals and biotechnology companies
    • Contract research and organizations
    • Others
  • Product
    • Software
    • Services
  • Application
    • Drug Discovery
    • Drug Development (Pre-Clinical Testing, Clinical Trials - Phase I, Phase II, Phase III)
    • Other Applications (Academic Research, Regulatory Submissions)
  • Geography
    • North America
      • US
      • Canada
    • Europe
      • France
      • Germany
      • Italy
      • UK
    • Middle East and Africa
      • Egypt
      • KSA
      • Oman
      • UAE
    • APAC
      • China
      • India
      • Japan
    • South America
      • Argentina
      • Brazil
    • Rest of World (ROW)

    By End-user Insights

    The pharmaceuticals and biotechnology companies segment is estimated to witness significant growth during the forecast period.

    The market is experiencing significant expansion, with pharmaceuticals and biotechnology companies leading the charge. These firms are increasingly utilizing biosimulation software and services for drug discovery and development, particularly in high-content screening (HCS). The adoption of these techniques enables pharmaceutical companies to identify drug targets more effectively and develop therapeutic approaches for complex diseases. Moreover, the shift from generic drugs to precision medicines has fueled the demand for advanced modeling solutions. Companies are investing in clinical trial simulation (CTS), modeling and simulation, computer-assisted trial design (CATD), model-based drug development (MBDD), and model-informed drug discovery and development (MID3). Biotechnology and pharmaceuticals firms are committed to creating comprehensive disease and population models to optimize therapeutic fields.

    Biosimulation technology is not limited to pharmaceuticals; it is also gaining traction in agriculture. Precision agriculture applications, such as yield improvement metrics, grain quality improvement, photosynthesis optimization, drought tolerance mechanisms, root development stimulators, and nitrogen fixation efficiency, are benefiting from biosimulation. Microbial inoculants, soil health indicators, beneficial microbial communities, and nutrient management strategies are essential components of sustainable agriculture techniques. Biosimulation technology is instrumental in enhancing crop stress tolerance, improving plant growth regulators, and providing biotic stress resistance. Fruit quality parameters, heavy metal detoxification, and plant hormone modulation are other areas where biosimulation is making a significant impact.

    Enhanced nutrient use, salinity stress mitigation, antioxidant enzyme production, humic acid fertilizers, and phosphorus uptake enhancement are some of the key trends in the agriculture sector. The integration of pest management techniques, microbial diversity analysis, and integrated pest management is another area where biosimulation is making strides. These advancements contribute to the continuous evolution of the market, making it a vital tool for various industries.

    Biosimulation Market Size

    Request Free Sample

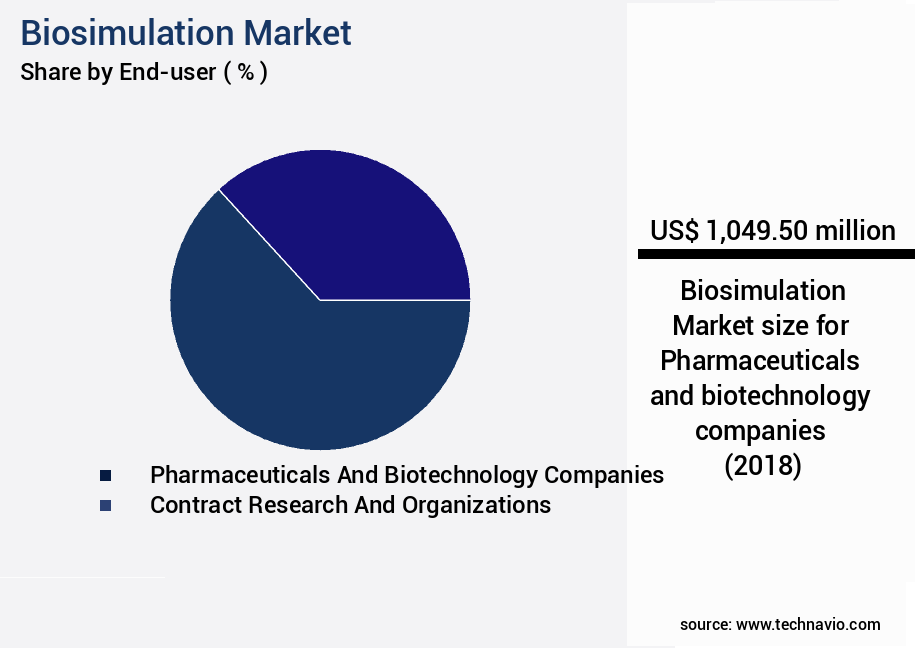
    The Pharmaceuticals and biotechnology companies segment was valued at USD 1.05 billion in 2018 and showed a gradual increase during the forecast period.

    Biosimulation Market Size

    Request Free Sample

    Regional Analysis

    North America is estimated to contribute 45% to the growth of the global market during the forecast period.Technavio’s analysts have elaborately explained the regional trends and drivers that shape the market during the forecast period.

    Biosimulation Market Share by Geography

    See How Biosimulation Market Demand is Rising in North America Request Free Sample

    In North America, the market holds a significant share of the global revenue in 2023, with the United States being the primary contributor. The region's growth is fueled by the increasing adoption of biosimulation and modeling technologies in the pharmaceutical and biotechnology industry. These advanced tools enable scientists to make informed decisions across various therapeutic areas and assess the safety and efficacy of new drug molecules during clinical trials. Moreover, the US market is witnessing a surge in demand for biosimulation in drug screening applications by pharmaceutical and biotechnology companies.

    The pharmaceutical industry's growth is driven by the growing awareness of complex chronic diseases and their high prevalence. The North American market's expansion is further supported by the region's robust research and development landscape, which fosters innovation and technological advancements in biosimulation.

    Market Dynamics

    Our researchers analyzed the data with 2023 as the base year, along with the key drivers, trends, and challenges. A holistic analysis of drivers will help companies refine their marketing strategies to gain a competitive advantage.

    The market is witnessing significant growth due to the increasing focus on enhancing plant growth and optimizing agricultural practices. Rhizosphere microbiome composition plays a crucial role in plant growth, and identifying plant growth promoting bacteria (PGPB) is a key area of research. These bacteria facilitate enhanced nutrient uptake mechanisms through various mechanisms, including soil enzyme activity and nutrient cycling. Moreover, the impact of microbial inoculants on yield is a significant factor driving market growth. For instance, beneficial microbes like nitrogen-fixing bacteria and phosphorus solubilizing bacteria contribute to improved nutrient use efficiency farming. Additionally, microbial inoculants play a vital role in enhancing plant hormone signaling pathways, enabling better water stress tolerance mechanisms and drought resistant crop development strategies.

    The adoption of sustainable agricultural practices, such as soil health improvement techniques and precision agriculture technology application, is also fueling market expansion. Integrated pest management approaches and crop disease resistance mechanisms are essential components of these practices, leading to a shift towards more eco-friendly farming methods. Compared to traditional farming techniques, the use of microbial inoculants in agriculture offers substantial benefits. For example, more than 70% of new product developments in the market focus on enhancing crop productivity maximization approaches, particularly in vegetable yield improvement methods. This underscores the market's potential for growth and the increasing importance of microbial inoculants in modern agriculture.

    In conclusion, the market is poised for significant expansion as the agricultural industry continues to seek innovative solutions for enhancing crop yields, improving nutrient use efficiency, and promoting sustainable farming practices. The integration of microbial inoculants into modern agriculture is a key trend driving market growth, with numerous applications in nutrient cycling, plant hormone signaling, and stress tolerance mechanisms.

    Biosimulation Market Size

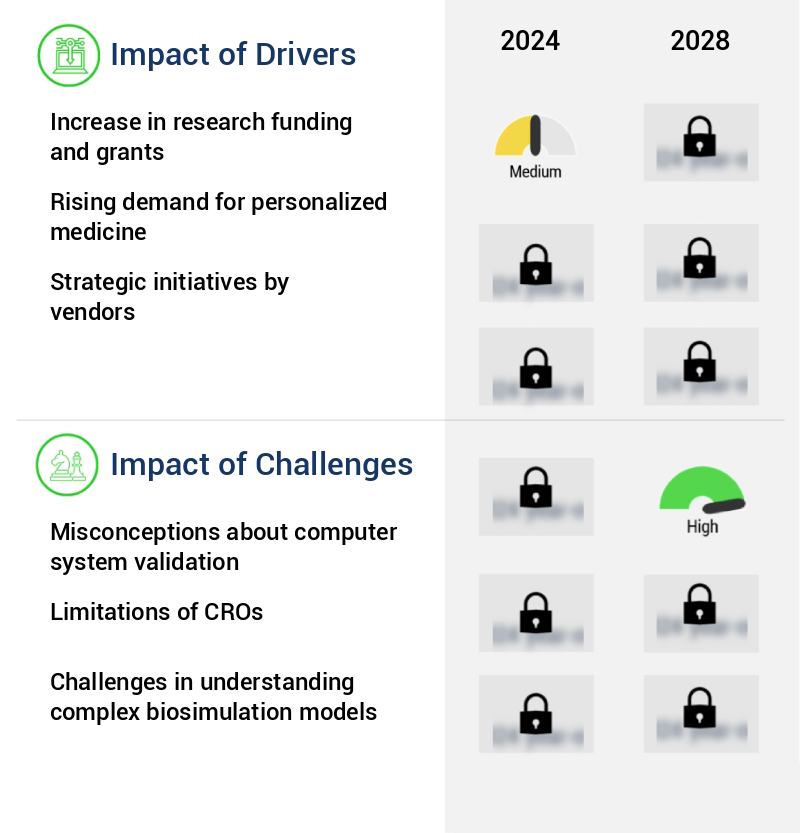
    What are the key market drivers leading to the rise in the adoption of Biosimulation Industry?

    • The significant growth in research funding and grants is the primary catalyst for market expansion. 

    • The market experiences significant growth due to substantial investment in computational biology research, encompassing modeling and simulation, by various public and private entities worldwide. This funding surge is aimed at advancing therapies for intricate diseases. Regulatory bodies like the FDA, NIH, and the EU are actively granting research funds to companies and academic institutions to explore novel opportunities in modeling and simulation.
    • The FDA is particularly focused on providing new funding avenues to enhance drug development safety through innovative clinical trial methods, including modeling and simulation, streamlined trial designs, and basket and umbrella trials. This commitment to innovation and collaboration is propelling the market forward, offering valuable solutions for the healthcare sector and beyond.

    What are the market trends shaping the Biosimulation Industry?

    • Big data implementation in drug discovery through the use of mathematical models and simulation is currently a significant market trend. This approach employs advanced analytical techniques to expedite and enhance the drug discovery process.

    • The pharmaceutical industry continues to play a pivotal role within the healthcare sector, with big data analytics increasingly shaping its landscape. Traditional drug discovery and development processes face pressure to enhance productivity, leading to the adoption of advanced analytical tools. Big data aids in streamlining various aspects, including drug discovery, clinical drug design, and monitoring adverse reactions. Historically, researchers relied on plant and animal compounds as potential drug candidates, but success rates were minimal, hovering around 1%.
    • Today, computational methods enable scientists to create target molecules, significantly increasing the chances of drug efficacy. This data-driven approach revolutionizes the pharmaceutical industry, offering a more efficient and effective means to address healthcare challenges.

    What challenges does the Biosimulation Industry face during its growth?

    • Misconceptions regarding computer system validation pose a significant challenge to the industry's growth. This issue arises from a lack of understanding about the importance and complexities of validating computer systems in regulated industries. Proper validation ensures compliance with regulatory requirements, enhances system reliability, and maintains data integrity. Failure to address these misconceptions could hinder industry progress and potentially lead to costly consequences. 

    • During the drug development process, investigational drugs' pharmacokinetic-pharmacodynamic (PK-PD) properties are studied using computer systems. Regulatory compliance necessitates validating these computer systems. Neglecting computer system validation (CSV) for the intended software functionality and expected data sets can lead to inaccurate results, potentially causing regulatory failure. Numerous regulations, such as 21 CFR Part 11, outline the requirements for CSV. Misconceptions about CSV responsibilities may lead users to assume the company has already performed validation.
    • As a professional, it is essential to maintain a formal tone and emphasize the importance of CSV in drug development. The evolving nature of this process underscores the continuous need for validated computer systems to ensure reliable PK-PD analysis.

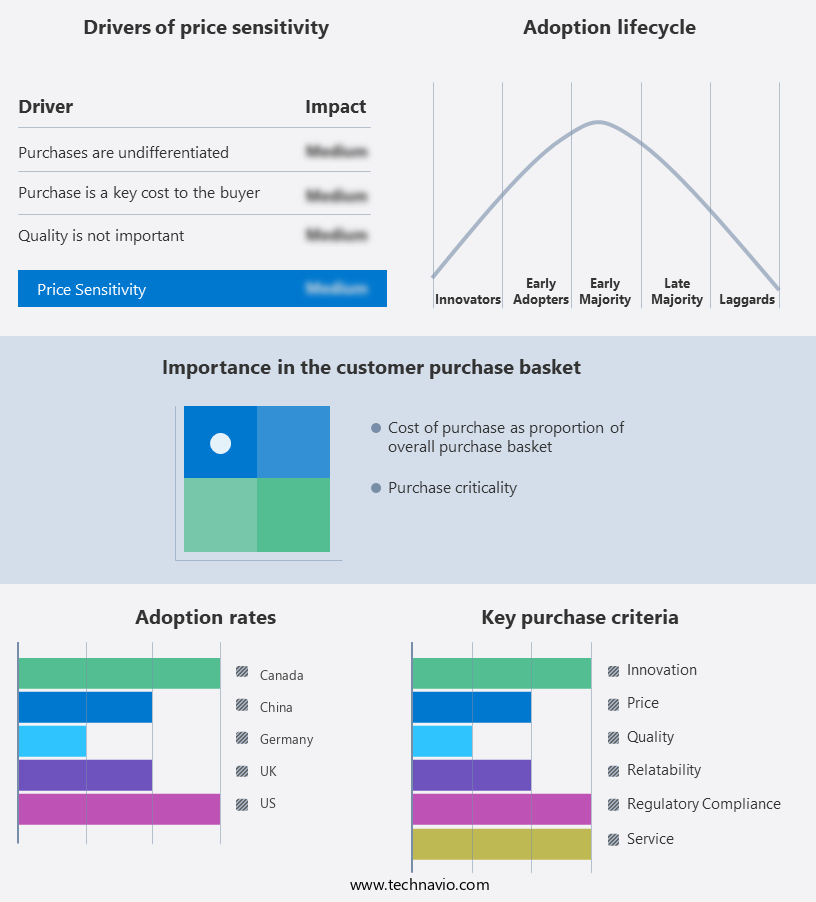
    Exclusive Technavio Analysis on Customer Landscape

    The biosimulation market forecasting report includes the adoption lifecycle of the market, covering from the innovator’s stage to the laggard’s stage. It focuses on adoption rates in different regions based on penetration. Furthermore, the biosimulation market report also includes key purchase criteria and drivers of price sensitivity to help companies evaluate and develop their market growth analysis strategies.

    Biosimulation Market Share by Geography

     Customer Landscape of Biosimulation Industry

    Competitive Landscape

    Companies are implementing various strategies, such as strategic alliances, biosimulation market forecast, partnerships, mergers and acquisitions, geographical expansion, and product/service launches, to enhance their presence in the industry.

    Advanced Chemistry Development Inc. - This company specializes in providing advanced biosimulation solutions, encompassing analytical lab management, green chemistry, and metabolite identification, enhancing research efficiency and accuracy in various industries.

    The industry research and growth report includes detailed analyses of the competitive landscape of the market and information about key companies, including:

    • Advanced Chemistry Development Inc.
    • Allucent
    • Altair Engineering Inc.
    • ANSYS Inc.
    • Applied BioMath LLC.
    • Cellworks Group Inc.
    • Certara Inc.
    • Chemical Computing Group ULC
    • Dassault Systemes SE
    • Genedata AG
    • INOSIM Software GmbH
    • Intelligen Inc.
    • LifeTec Group
    • Physiomics Plc
    • Rosa and Co. LLC
    • Schrodinger Inc.
    • Simulations Plus Inc.
    • Thermo Fisher Scientific Inc.
    • Via Science Inc.
    • Yokogawa Electric Corp.

    Qualitative and quantitative analysis of companies has been conducted to help clients understand the wider business environment as well as the strengths and weaknesses of key industry players. Data is qualitatively analyzed to categorize companies as pure play, category-focused, industry-focused, and diversified; it is quantitatively analyzed to categorize companies as dominant, leading, strong, tentative, and weak.

    Recent Development and News in Biosimulation Market

    • In January 2024, Merck KGaA and IN Silico announced a strategic collaboration to accelerate the development of biosimulations using Merck's small molecule library and IN Silico's computational modeling expertise (Merck KGaA press release).
    • In March 2024, Insilico Medicine raised USD300 million in a Series D funding round, led by Sequoia Capital, to advance its AI-driven drug discovery and biosimulation platform (Insilico Medicine press release).
    • In May 2024, the European Medicines Agency (EMA) approved the use of biosimulations as a tool for regulatory decision-making in the context of marketing authorization applications for biosimilars, marking a significant policy change (EMA press release).
    • In April 2025, Ginkgo Bioworks and Merck KGaA's BioReliance announced a partnership to integrate Ginkgo's organism design and manufacturing capabilities with BioReliance's contract development and manufacturing services for biosimilars, expanding their offerings in the market (Ginkgo Bioworks press release).

    Dive into Technavio’s robust research methodology, blending expert interviews, extensive data synthesis, and validated models for unparalleled Biosimulation Market insights. See full methodology.

    Market Scope

    Report Coverage

    Details

    Page number

    168

    Base year

    2023

    Historic period

    2018-2022

    Forecast period

    2024-2028

    Growth momentum & CAGR

    Accelerate at a CAGR of 18.52%

    Market growth 2024-2028

    USD 4742.9 million

    Market structure

    Fragmented

    YoY growth 2023-2024(%)

    15.18

    Key countries

    US, Canada, Germany, UK, Italy, France, China, India, Japan, Brazil, Egypt, UAE, Oman, Argentina, KSA, UAE, Brazil, and Rest of World (ROW)

    Competitive landscape

    Leading Companies, Market Positioning of Companies, Competitive Strategies, and Industry Risks

    Request Free Sample

    Research Analyst Overview

    • In the dynamic and evolving realm of biosimulation, the agricultural sector continues to witness significant advancements, particularly in the application of precision agriculture. This innovative approach to farming leverages technology to optimize yield improvement metrics and enhance grain quality. Photosynthesis optimization and drought tolerance mechanisms are key areas of focus, with root development stimulators and potassium availability playing crucial roles. Microbial inoculants, beneficial microbial communities, and growth-promoting rhizobacteria are increasingly utilized to boost nitrogen fixation efficiency and crop stress tolerance. Soil health indicators, such as crop disease resistance and soil nutrient cycling, are also essential elements in this context.
    • Organic farming practices and sustainable agriculture techniques further contribute to the market's continuous unfolding. Water use efficiency, plant growth regulators, and biotic stress resistance are among the essential factors driving the adoption of biosimulation in agriculture. Fruit quality parameters, heavy metal detoxification, and plant hormone modulation are other areas of interest, as farmers and researchers seek to optimize production and enhance crop resilience. Salinity stress mitigation, antioxidant enzyme production, and humic acid fertilizers are additional aspects of the market, reflecting the industry's commitment to addressing various agricultural challenges. Plant biomass production, plant-microbe interactions, and abiotic stress resilience are also critical areas of investigation, as the industry strives to improve phosphorus uptake enhancement and vegetable yield enhancement.
    • Integrated pest management, microbial diversity analysis, and enhanced nutrient use are further key components of the market. As the industry evolves, it continues to provide innovative solutions for farmers, addressing a wide range of agricultural challenges and contributing to sustainable, efficient, and high-yielding agricultural practices.

    What are the Key Data Covered in this Biosimulation Market Research and Growth Report?

    • What is the expected growth of the Biosimulation Market between 2024 and 2028?

      • USD 4.74 billion, at a CAGR of 18.52%

    • What segmentation does the market report cover?

      • The report is segmented by End-user (Pharmaceuticals and biotechnology companies, Contract research and organizations, and Others), Product (Software and Services), Geography (North America, Europe, Asia, and Rest of World (ROW)), and Application (Drug Discovery, Drug Development (Pre-Clinical Testing, Clinical Trials - Phase I, Phase II, Phase III), and Other Applications (Academic Research, Regulatory Submissions))

    • Which regions are analyzed in the report?

      • North America, Europe, Asia, and Rest of World (ROW)

    • What are the key growth drivers and market challenges?

      • Increase in research funding and grants, Misconceptions about computer system validation

    • Who are the major players in the Biosimulation Market?

      • Advanced Chemistry Development Inc., Allucent, Altair Engineering Inc., ANSYS Inc., Applied BioMath LLC., Cellworks Group Inc., Certara Inc., Chemical Computing Group ULC, Dassault Systemes SE, Genedata AG, INOSIM Software GmbH, Intelligen Inc., LifeTec Group, Physiomics Plc, Rosa and Co. LLC, Schrodinger Inc., Simulations Plus Inc., Thermo Fisher Scientific Inc., Via Science Inc., and Yokogawa Electric Corp.

    Market Research Insights

    • The market encompasses a range of applications in agriculture, including plant metabolomics, nutrition enhancement, and soil amendment technology. According to industry estimates, this market is projected to reach USD10 billion by 2025, growing at a compound annual growth rate of 12%. One key driver of this growth is the increasing demand for precision farming tools, which utilize biosimulation to optimize nutrient translocation, improve fertilizer use, and enhance crop productivity. Another factor is the need for climate change adaptation strategies, such as water conservation and chlorophyll content management, which are expected to account for over 25% of the market's growth.
    • Despite these opportunities, there remains a pressing need for resource optimization strategies to address the ecological challenges of sustainable intensification and rhizosphere microbiome management. For instance, biological nitrogen fixation and leaf area index optimization can improve agricultural input efficiency and reduce the reliance on synthetic fertilizers. Ultimately, biosimulation technologies offer a promising solution to the complex challenges facing modern agriculture, with potential applications in lipid content regulation, carbohydrate accumulation, biological control agents, and more.

    We can help! Our analysts can customize this biosimulation market research report to meet your requirements.

    Get in touch

    1 Executive Summary

    • 1.1 Market overview
      • Executive Summary - Chart on Market Overview
      • Executive Summary - Data Table on Market Overview
      • Executive Summary - Chart on Global Market Characteristics
      • Executive Summary - Chart on Market by Geography
      • Executive Summary - Chart on Market Segmentation by End-user
      • Executive Summary - Chart on Market Segmentation by Product
      • Executive Summary - Chart on Incremental Growth
      • Executive Summary - Data Table on Incremental Growth
      • Executive Summary - Chart on Company Market Positioning

    2 Market Landscape

    • 2.1 Market ecosystem
      • Parent Market
      • Data Table on - Parent Market
    • 2.2 Market characteristics
      • Market characteristics analysis
    • 2.3 Value chain analysis
      • Value Chain Analysis

    3 Market Sizing

    • 3.1 Market definition
      • Offerings of companies included in the market definition
    • 3.2 Market segment analysis
      • Market segments
    • 3.3 Market size 2023
      • 3.4 Market outlook: Forecast for 2023-2028
        • Chart on Global - Market size and forecast 2023-2028 ($ million)
        • Data Table on Global - Market size and forecast 2023-2028 ($ million)
        • Chart on Global Market: Year-over-year growth 2023-2028 (%)
        • Data Table on Global Market: Year-over-year growth 2023-2028 (%)

      4 Historic Market Size

      • 4.1 Global Biosimulation Market 2018 - 2022
        • Historic Market Size - Data Table on Global Biosimulation Market 2018 - 2022 ($ million)
      • 4.2 End-user segment analysis 2018 - 2022
        • Historic Market Size - End-user Segment 2018 - 2022 ($ million)
      • 4.3 Product segment analysis 2018 - 2022
        • Historic Market Size - Product Segment 2018 - 2022 ($ million)
      • 4.4 Geography segment analysis 2018 - 2022
        • Historic Market Size - Geography Segment 2018 - 2022 ($ million)
      • 4.5 Country segment analysis 2018 - 2022
        • Historic Market Size - Country Segment 2018 - 2022 ($ million)

      5 Five Forces Analysis

      • 5.1 Five forces summary
        • Five forces analysis - Comparison between 2023 and 2028
      • 5.2 Bargaining power of buyers
        • Bargaining power of buyers - Impact of key factors 2023 and 2028
      • 5.3 Bargaining power of suppliers
        • Bargaining power of suppliers - Impact of key factors in 2023 and 2028
      • 5.4 Threat of new entrants
        • Threat of new entrants - Impact of key factors in 2023 and 2028
      • 5.5 Threat of substitutes
        • Threat of substitutes - Impact of key factors in 2023 and 2028
      • 5.6 Threat of rivalry
        • Threat of rivalry - Impact of key factors in 2023 and 2028
      • 5.7 Market condition
        • Chart on Market condition - Five forces 2023 and 2028

      6 Market Segmentation by End-user

      • 6.1 Market segments
        • Chart on End-user - Market share (2023-2028) (%)
        • Data Table on End-user - Market share (2023-2028) (%)
      • 6.2 Comparison by End-user
        • Chart on Comparison by End-user
        • Data Table on Comparison by End-user
      • 6.3 Pharmaceuticals and biotechnology companies - Market size and forecast (2023-2028)
        • Chart on Pharmaceuticals and biotechnology companies - Market size and forecast (2023-2028) ($ million)
        • Data Table on Pharmaceuticals and biotechnology companies - Market size and forecast (2023-2028) ($ million)
        • Chart on Pharmaceuticals and biotechnology companies - Year-over-year growth (2023-2028) (%)
        • Data Table on Pharmaceuticals and biotechnology companies - Year-over-year growth (2023-2028) (%)
      • 6.4 Contract research and organizations - Market size and forecast (2023-2028)
        • Chart on Contract research and organizations - Market size and forecast (2023-2028) ($ million)
        • Data Table on Contract research and organizations - Market size and forecast (2023-2028) ($ million)
        • Chart on Contract research and organizations - Year-over-year growth (2023-2028) (%)
        • Data Table on Contract research and organizations - Year-over-year growth (2023-2028) (%)
      • 6.5 Others - Market size and forecast (2023-2028)
        • Chart on Others - Market size and forecast (2023-2028) ($ million)
        • Data Table on Others - Market size and forecast (2023-2028) ($ million)
        • Chart on Others - Year-over-year growth (2023-2028) (%)
        • Data Table on Others - Year-over-year growth (2023-2028) (%)
      • 6.6 Market opportunity by End-user
        • Market opportunity by End-user ($ million)
        • Data Table on Market opportunity by End-user ($ million)

      7 Market Segmentation by Product

      • 7.1 Market segments
        • Chart on Product - Market share (2023-2028) (%)
        • Data Table on Product - Market share (2023-2028) (%)
      • 7.2 Comparison by Product
        • Chart on Comparison by Product
        • Data Table on Comparison by Product
      • 7.3 Software - Market size and forecast (2023-2028)
        • Chart on Software - Market size and forecast (2023-2028) ($ million)
        • Data Table on Software - Market size and forecast (2023-2028) ($ million)
        • Chart on Software - Year-over-year growth (2023-2028) (%)
        • Data Table on Software - Year-over-year growth (2023-2028) (%)
      • 7.4 Services - Market size and forecast (2023-2028)
        • Chart on Services - Market size and forecast (2023-2028) ($ million)
        • Data Table on Services - Market size and forecast (2023-2028) ($ million)
        • Chart on Services - Year-over-year growth (2023-2028) (%)
        • Data Table on Services - Year-over-year growth (2023-2028) (%)
      • 7.5 Market opportunity by Product
        • Market opportunity by Product ($ million)
        • Data Table on Market opportunity by Product ($ million)

      8 Market Segmentation by Application

      • 8.1 Market segments
        • Chart on Application - Market share (2023-2028) (%)
        • Data Table on Application - Market share (2023-2028) (%)
      • 8.2 Comparison by Application
        • Chart on Comparison by Application
        • Data Table on Comparison by Application
      • 8.3 Drug Discovery - Market size and forecast (2023-2028)
        • Chart on Drug Discovery - Market size and forecast (2023-2028) ($ million)
        • Data Table on Drug Discovery - Market size and forecast (2023-2028) ($ million)
        • Chart on Drug Discovery - Year-over-year growth (2023-2028) (%)
        • Data Table on Drug Discovery - Year-over-year growth (2023-2028) (%)
      • 8.4 Drug Development (Pre-Clinical Testing, Clinical Trials - Phase I, Phase II, Phase III) - Market size and forecast (2023-2028)
        • Chart on Drug Development (Pre-Clinical Testing, Clinical Trials - Phase I, Phase II, Phase III) - Market size and forecast (2023-2028) ($ million)
        • Data Table on Drug Development (Pre-Clinical Testing, Clinical Trials - Phase I, Phase II, Phase III) - Market size and forecast (2023-2028) ($ million)
        • Chart on Drug Development (Pre-Clinical Testing, Clinical Trials - Phase I, Phase II, Phase III) - Year-over-year growth (2023-2028) (%)
        • Data Table on Drug Development (Pre-Clinical Testing, Clinical Trials - Phase I, Phase II, Phase III) - Year-over-year growth (2023-2028) (%)
      • 8.5 Other Applications (Academic Research, Regulatory Submissions) - Market size and forecast (2023-2028)
        • Chart on Other Applications (Academic Research, Regulatory Submissions) - Market size and forecast (2023-2028) ($ million)
        • Data Table on Other Applications (Academic Research, Regulatory Submissions) - Market size and forecast (2023-2028) ($ million)
        • Chart on Other Applications (Academic Research, Regulatory Submissions) - Year-over-year growth (2023-2028) (%)
        • Data Table on Other Applications (Academic Research, Regulatory Submissions) - Year-over-year growth (2023-2028) (%)
      • 8.6 Market opportunity by Application
        • Market opportunity by Application ($ million)
        • Data Table on Market opportunity by Application ($ million)

      9 Customer Landscape

      • 9.1 Customer landscape overview
        • Analysis of price sensitivity, lifecycle, customer purchase basket, adoption rates, and purchase criteria

      10 Geographic Landscape

      • 10.1 Geographic segmentation
        • Chart on Market share by geography 2023-2028 (%)
        • Data Table on Market share by geography 2023-2028 (%)
      • 10.2 Geographic comparison
        • Chart on Geographic comparison
        • Data Table on Geographic comparison
      • 10.3 North America - Market size and forecast 2023-2028
        • Chart on North America - Market size and forecast 2023-2028 ($ million)
        • Data Table on North America - Market size and forecast 2023-2028 ($ million)
        • Chart on North America - Year-over-year growth 2023-2028 (%)
        • Data Table on North America - Year-over-year growth 2023-2028 (%)
      • 10.4 Europe - Market size and forecast 2023-2028
        • Chart on Europe - Market size and forecast 2023-2028 ($ million)
        • Data Table on Europe - Market size and forecast 2023-2028 ($ million)
        • Chart on Europe - Year-over-year growth 2023-2028 (%)
        • Data Table on Europe - Year-over-year growth 2023-2028 (%)
      • 10.5 Asia - Market size and forecast 2023-2028
        • Chart on Asia - Market size and forecast 2023-2028 ($ million)
        • Data Table on Asia - Market size and forecast 2023-2028 ($ million)
        • Chart on Asia - Year-over-year growth 2023-2028 (%)
        • Data Table on Asia - Year-over-year growth 2023-2028 (%)
      • 10.6 Rest of World (ROW) - Market size and forecast 2023-2028
        • Chart on Rest of World (ROW) - Market size and forecast 2023-2028 ($ million)
        • Data Table on Rest of World (ROW) - Market size and forecast 2023-2028 ($ million)
        • Chart on Rest of World (ROW) - Year-over-year growth 2023-2028 (%)
        • Data Table on Rest of World (ROW) - Year-over-year growth 2023-2028 (%)
      • 10.7 US - Market size and forecast 2023-2028
        • Chart on US - Market size and forecast 2023-2028 ($ million)
        • Data Table on US - Market size and forecast 2023-2028 ($ million)
        • Chart on US - Year-over-year growth 2023-2028 (%)
        • Data Table on US - Year-over-year growth 2023-2028 (%)
      • 10.8 Germany - Market size and forecast 2023-2028
        • Chart on Germany - Market size and forecast 2023-2028 ($ million)
        • Data Table on Germany - Market size and forecast 2023-2028 ($ million)
        • Chart on Germany - Year-over-year growth 2023-2028 (%)
        • Data Table on Germany - Year-over-year growth 2023-2028 (%)
      • 10.9 UK - Market size and forecast 2023-2028
        • Chart on UK - Market size and forecast 2023-2028 ($ million)
        • Data Table on UK - Market size and forecast 2023-2028 ($ million)
        • Chart on UK - Year-over-year growth 2023-2028 (%)
        • Data Table on UK - Year-over-year growth 2023-2028 (%)
      • 10.10 Canada - Market size and forecast 2023-2028
        • Chart on Canada - Market size and forecast 2023-2028 ($ million)
        • Data Table on Canada - Market size and forecast 2023-2028 ($ million)
        • Chart on Canada - Year-over-year growth 2023-2028 (%)
        • Data Table on Canada - Year-over-year growth 2023-2028 (%)
      • 10.11 China - Market size and forecast 2023-2028
        • Chart on China - Market size and forecast 2023-2028 ($ million)
        • Data Table on China - Market size and forecast 2023-2028 ($ million)
        • Chart on China - Year-over-year growth 2023-2028 (%)
        • Data Table on China - Year-over-year growth 2023-2028 (%)
      • 10.12 Market opportunity by geography
        • Market opportunity by geography ($ million)
        • Data Tables on Market opportunity by geography ($ million)
      • 10.13 Italy - Market size and forecast (2023-2028)
        • Chart on Italy - Market size and forecast (2023-2028) ($ million)
        • Data Table on Italy - Market size and forecast (2023-2028) ($ million)
        • Chart on Italy - Year-over-year growth (2023-2028) (%)
        • Data Table on Italy - Year-over-year growth (2023-2028) (%)
      • 10.14 France - Market size and forecast (2023-2028)
        • Chart on France - Market size and forecast (2023-2028) ($ million)
        • Data Table on France - Market size and forecast (2023-2028) ($ million)
        • Chart on France - Year-over-year growth (2023-2028) (%)
        • Data Table on France - Year-over-year growth (2023-2028) (%)
      • 10.15 India - Market size and forecast (2023-2028)
        • Chart on India - Market size and forecast (2023-2028) ($ million)
        • Data Table on India - Market size and forecast (2023-2028) ($ million)
        • Chart on India - Year-over-year growth (2023-2028) (%)
        • Data Table on India - Year-over-year growth (2023-2028) (%)
      • 10.16 Japan - Market size and forecast (2023-2028)
        • Chart on Japan - Market size and forecast (2023-2028) ($ million)
        • Data Table on Japan - Market size and forecast (2023-2028) ($ million)
        • Chart on Japan - Year-over-year growth (2023-2028) (%)
        • Data Table on Japan - Year-over-year growth (2023-2028) (%)
      • 10.17 Brazil - Market size and forecast (2023-2028)
        • Chart on Brazil - Market size and forecast (2023-2028) ($ million)
        • Data Table on Brazil - Market size and forecast (2023-2028) ($ million)
        • Chart on Brazil - Year-over-year growth (2023-2028) (%)
        • Data Table on Brazil - Year-over-year growth (2023-2028) (%)
      • 10.18 Egypt - Market size and forecast (2023-2028)
        • Chart on Egypt - Market size and forecast (2023-2028) ($ million)
        • Data Table on Egypt - Market size and forecast (2023-2028) ($ million)
        • Chart on Egypt - Year-over-year growth (2023-2028) (%)
        • Data Table on Egypt - Year-over-year growth (2023-2028) (%)
      • 10.19 UAE - Market size and forecast (2023-2028)
        • Chart on UAE - Market size and forecast (2023-2028) ($ million)
        • Data Table on UAE - Market size and forecast (2023-2028) ($ million)
        • Chart on UAE - Year-over-year growth (2023-2028) (%)
        • Data Table on UAE - Year-over-year growth (2023-2028) (%)
      • 10.20 Oman - Market size and forecast (2023-2028)
        • Chart on Oman - Market size and forecast (2023-2028) ($ million)
        • Data Table on Oman - Market size and forecast (2023-2028) ($ million)
        • Chart on Oman - Year-over-year growth (2023-2028) (%)
        • Data Table on Oman - Year-over-year growth (2023-2028) (%)
      • 10.21 Argentina - Market size and forecast (2023-2028)
        • Chart on Argentina - Market size and forecast (2023-2028) ($ million)
        • Data Table on Argentina - Market size and forecast (2023-2028) ($ million)
        • Chart on Argentina - Year-over-year growth (2023-2028) (%)
        • Data Table on Argentina - Year-over-year growth (2023-2028) (%)
      • 10.22 KSA - Market size and forecast (2023-2028)
        • Chart on KSA - Market size and forecast (2023-2028) ($ million)
        • Data Table on KSA - Market size and forecast (2023-2028) ($ million)
        • Chart on KSA - Year-over-year growth (2023-2028) (%)
        • Data Table on KSA - Year-over-year growth (2023-2028) (%)

      11 Drivers, Challenges, and Opportunity/Restraints

      • 11.1 Market drivers
        • 11.2 Market challenges
          • 11.3 Impact of drivers and challenges
            • Impact of drivers and challenges in 2023 and 2028
          • 11.4 Market opportunities/restraints

            12 Competitive Landscape

            • 12.1 Overview
              • 12.2 Competitive Landscape
                • Overview on criticality of inputs and factors of differentiation
              • 12.3 Landscape disruption
                • Overview on factors of disruption
              • 12.4 Industry risks
                • Impact of key risks on business

              13 Competitive Analysis

              • 13.1 Companies profiled
                • Companies covered
              • 13.2 Market positioning of companies
                • Matrix on companies position and classification
              • 13.3 Advanced Chemistry Development Inc.
                • Advanced Chemistry Development Inc. - Overview
                • Advanced Chemistry Development Inc. - Product / Service
                • Advanced Chemistry Development Inc. - Key offerings
              • 13.4 Allucent
                • Allucent - Overview
                • Allucent - Product / Service
                • Allucent - Key offerings
              • 13.5 Altair Engineering Inc.
                • Altair Engineering Inc. - Overview
                • Altair Engineering Inc. - Business segments
                • Altair Engineering Inc. - Key news
                • Altair Engineering Inc. - Key offerings
                • Altair Engineering Inc. - Segment focus
              • 13.6 ANSYS Inc.
                • ANSYS Inc. - Overview
                • ANSYS Inc. - Product / Service
                • ANSYS Inc. - Key news
                • ANSYS Inc. - Key offerings
              • 13.7 Cellworks Group Inc.
                • Cellworks Group Inc. - Overview
                • Cellworks Group Inc. - Product / Service
                • Cellworks Group Inc. - Key offerings
              • 13.8 Certara Inc.
                • Certara Inc. - Overview
                • Certara Inc. - Product / Service
                • Certara Inc. - Key offerings
              • 13.9 Chemical Computing Group ULC
                • Chemical Computing Group ULC - Overview
                • Chemical Computing Group ULC - Product / Service
                • Chemical Computing Group ULC - Key offerings
              • 13.10 Dassault Systemes SE
                • Dassault Systemes SE - Overview
                • Dassault Systemes SE - Product / Service
                • Dassault Systemes SE - Key news
                • Dassault Systemes SE - Key offerings
              • 13.11 Genedata AG
                • Genedata AG - Overview
                • Genedata AG - Product / Service
                • Genedata AG - Key offerings
              • 13.12 INOSIM Software GmbH
                • INOSIM Software GmbH - Overview
                • INOSIM Software GmbH - Product / Service
                • INOSIM Software GmbH - Key offerings
              • 13.13 Intelligen Inc.
                • Intelligen Inc. - Overview
                • Intelligen Inc. - Product / Service
                • Intelligen Inc. - Key offerings
              • 13.14 LifeTec Group
                • LifeTec Group - Overview
                • LifeTec Group - Product / Service
                • LifeTec Group - Key offerings
              • 13.15 Rosa and Co. LLC
                • Rosa and Co. LLC - Overview
                • Rosa and Co. LLC - Product / Service
                • Rosa and Co. LLC - Key offerings
              • 13.16 Simulations Plus Inc.
                • Simulations Plus Inc. - Overview
                • Simulations Plus Inc. - Business segments
                • Simulations Plus Inc. - Key offerings
                • Simulations Plus Inc. - Segment focus
              • 13.17 Yokogawa Electric Corp.
                • Yokogawa Electric Corp. - Overview
                • Yokogawa Electric Corp. - Business segments
                • Yokogawa Electric Corp. - Key news
                • Yokogawa Electric Corp. - Key offerings
                • Yokogawa Electric Corp. - Segment focus

              14 Appendix

              • 14.1 Scope of the report
                • 14.2 Inclusions and exclusions checklist
                  • Inclusions checklist
                  • Exclusions checklist
                • 14.3 Currency conversion rates for US$
                  • Currency conversion rates for US$
                • 14.4 Research methodology
                  • Research methodology
                • 14.5 Data procurement
                  • Information sources
                • 14.6 Data validation
                  • Data validation
                • 14.7 Validation techniques employed for market sizing
                  • Validation techniques employed for market sizing
                • 14.8 Data synthesis
                  • Data synthesis
                • 14.9 360 degree market analysis
                  • 360 degree market analysis
                • 14.10 List of abbreviations
                  • List of abbreviations

                Research Methodology

                Technavio presents a detailed picture of the market by way of study, synthesis, and summation of data from multiple sources. The analysts have presented the various facets of the market with a particular focus on identifying the key industry influencers. The data thus presented is comprehensive, reliable, and the result of extensive research, both primary and secondary.

                INFORMATION SOURCES

                Primary sources

                • Manufacturers and suppliers
                • Channel partners
                • Industry experts
                • Strategic decision makers

                Secondary sources

                • Industry journals and periodicals
                • Government data
                • Financial reports of key industry players
                • Historical data
                • Press releases

                DATA ANALYSIS

                Data Synthesis

                • Collation of data
                • Estimation of key figures
                • Analysis of derived insights

                Data Validation

                • Triangulation with data models
                • Reference against proprietary databases
                • Corroboration with industry experts

                REPORT WRITING

                Qualitative

                • Market drivers
                • Market challenges
                • Market trends
                • Five forces analysis

                Quantitative

                • Market size and forecast
                • Market segmentation
                • Geographical insights
                • Competitive landscape

                Interested in this report?

                Get your sample now to see our research methodology and insights!

                Download Now

                Frequently Asked Questions

                Biosimulation market growth will increase by $ 4742.9 mn during 2024-2028.

                The Biosimulation market is expected to grow at a CAGR of 18.52% during 2024-2028.

                Biosimulation market is segmented by End-user( Pharmaceuticals and biotechnology companies, Contract research and organizations, Others) Product( Software, Services, Asia, ROW)

                Advanced Chemistry Development Inc., Allucent, Altair Engineering Inc., ANSYS Inc., Applied BioMath LLC., Cellworks Group Inc., Certara Inc., Chemical Computing Group ULC, Dassault Systemes SE, Genedata AG, INOSIM Software GmbH, Intelligen Inc., LifeTec Group, Physiomics Plc, Rosa and Co. LLC, Schrodinger Inc., Simulations Plus Inc., Thermo Fisher Scientific Inc., Via Science Inc., Yokogawa Electric Corp. are a few of the key vendors in the Biosimulation market.

                North America will register the highest growth rate of 45% among the other regions. Therefore, the Biosimulation market in North America is expected to garner significant business opportunities for the vendors during the forecast period.

                US, Canada, Germany, UK, Italy, France, China, India, Japan, Brazil, Egypt, UAE, Oman, Argentina, KSA, UAE, Brazil, Rest of World (ROW)

                • Increase in research funding and grantsA major factor that drives the growth of the global biosimulation market is the strong research funding in the field of computational biology that includes modeling and simulation. Many public and private stakeholders across the globe are investing in this field to develop therapies for the treatment of complex diseases. Regulatory bodies such as the FDA is the driving factor this market.
                • the National Institutes of Health (NIH) is the driving factor this market.
                • and the EU are in the process of granting research funds to companies and academic institutes to explore new opportunities in modeling and simulation. The FDA is also focusing on opening new funding opportunities to facilitate safety during the drug development process through efficient means is the driving factor this market.
                • including innovative clinical trial methods such as modeling and simulation is the driving factor this market.
                • seamless trial designs is the driving factor this market.
                • as well as basket and umbrella trials. These methods further help in expediting the drug discovery and development processes. Furthermore is the driving factor this market.
                • Certara is committed to supporting research on modeling and simulation at the Academic Centers of Excellence and various not-for-profit institutions wherein the concepts related to the in vitro-in vivo extrapolation (IVIVE) and mechanistic pharmacokinetic/pharmacodynamics (PK/PD) modeling are explored. Furthermore is the driving factor this market.
                • the market is witnessing an increase in the number of CROs from emerging countries is the driving factor this market.
                • which are conducting late-stage clinical studies for pharmaceutical companies. The increasing funding from governments and large investors in countries such as China for the development of pharmaceutical products is the main reason for such an evolution. The increasing foreign direct investments (FDI) and private equity investments are also supporting the changing market dynamics of emerging countries such as India and China. Therefore is the driving factor this market.
                • the presence of strong research funding and grants is expected to result in the development of novel therapies that ensure minimal side effects is the driving factor this market.
                • which will support the growth of the global biosimulation market during the forecast period. The COVID-19 outbreak is anticipated to boost the demand for biosimulation solutions. As of April 8 is the driving factor this market.
                • 2020 is the driving factor this market.
                • the global number of patients infected with COVID-19 was about 1.45 million is the driving factor this market.
                • and the number of fatalities associated with it was about 83 is the driving factor this market.
                • 000. Globally is the driving factor this market.
                • several pharmaceutical companies and drug development institutions are working on the development of vaccines and drugs for the prevention and treatment of COVID-19. Governing bodies and private organizations are providing funding for the development of such vaccines and drugs. For instance is the driving factor this market.
                • in April 2020 is the driving factor this market.
                • a collaboration between the University of Copenhagen is the driving factor this market.
                • Aarhus University is the driving factor this market.
                • and the Serum Institute received funding of about $3.69 million for the development of the COVID-19 treatment vaccine within a short period of time. Such a focus on drug development is anticipated to fuel the demand for biosimulation software to test the effectiveness of vaccines and drugs within a significantly short period of time. is the driving factor this market.

                The Biosimulation market vendors should focus on grabbing business opportunities from the Pharmaceuticals and biotechnology companies segment as it accounted for the largest market share in the base year.