
Drug Screening Market Size 2024-2028
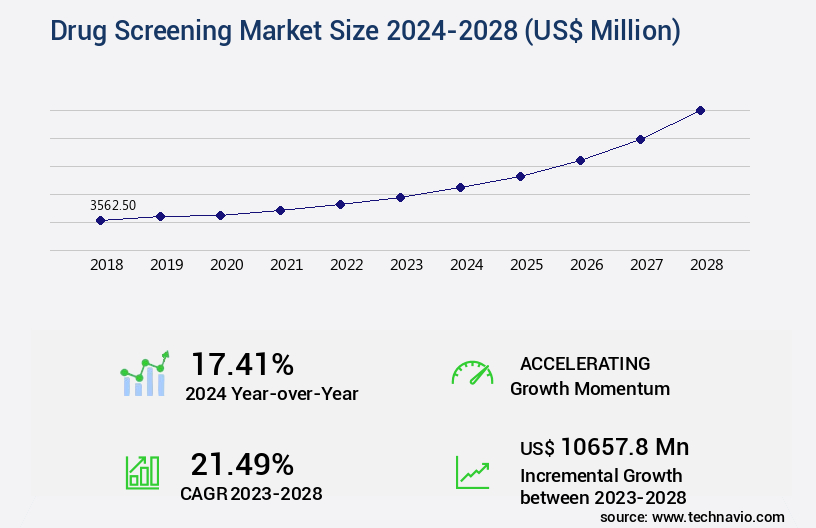
The drug screening market size is valued to increase USD 10.66 billion, at a CAGR of 21.49% from 2023 to 2028. Advancements in drug screening technologies will drive the drug screening market.
Major Market Trends & Insights
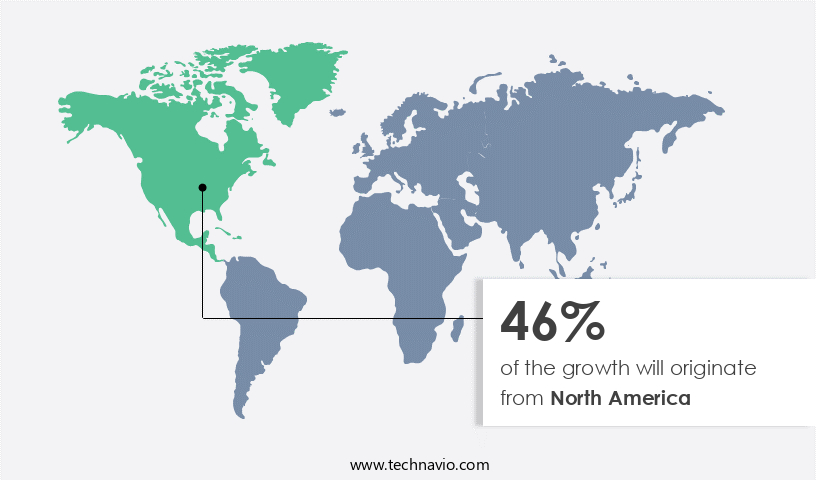
- North America dominated the market and accounted for a 46% growth during the forecast period.
- By Type - Drug screening products segment was valued at USD 2.35 billion in 2022
- By Application - Urine samples segment accounted for the largest market revenue share in 2022
Market Size & Forecast
- Market Opportunities: USD 380.90 million
- Market Future Opportunities: USD 10657.80 million
- CAGR : 21.49%
- North America: Largest market in 2022
Market Summary
- The market encompasses a continually evolving landscape shaped by advancements in core technologies and applications. Key technologies, such as mass spectrometry, chromatography, and immunoassay, dominate the market, while applications span various sectors, including pharmaceuticals, healthcare, and laboratories. Service types or product categories include in-vitro diagnostics, point-of-care testing, and laboratory services. Regulations, including FDA guidelines and international standards, significantly influence market dynamics. As of 2021, in-vitro diagnostics hold a market share of approximately 65% in the drug screening industry. The integration of artificial intelligence (AI) and machine learning (ML) in drug screening is a significant trend, driving market growth and offering enhanced accuracy and efficiency.
- Furthermore, the development of alternative testing methods, such as microfluidics and lab-on-a-chip technologies, presents new opportunities in the market.
What will be the Size of the Drug Screening Market during the forecast period?
Get Key Insights on Market Forecast (PDF) Request Free Sample
How is the Drug Screening Market Segmented and what are the key trends of market segmentation?
The drug screening industry research report provides comprehensive data (region-wise segment analysis), with forecasts and estimates in "USD million" for the period 2024-2028, as well as historical data from 2018-2022 for the following segments.
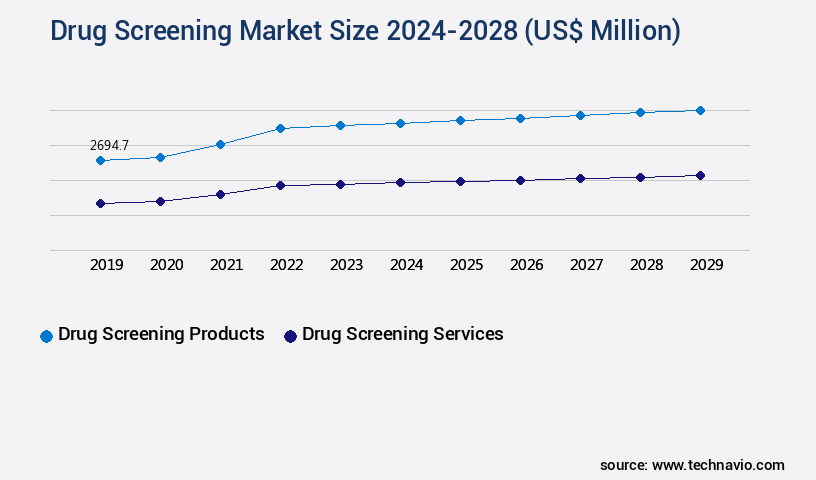
- Type
- Drug screening products
- Drug screening services
- Application
- Urine samples
- Breath samples
- Hair and blood samples
- Oral fluid samples
- Geography
- North America
- US
- Canada
- Europe
- Germany
- APAC
- China
- Japan
- Rest of World (ROW)
- North America
By Type Insights
The drug screening products segment is estimated to witness significant growth during the forecast period.
The market encompasses the demand for test kits, analyzers, and consumables, serving various industries in their endeavor to ensure regulatory compliance and maintain a drug-free work environment. The market's growth is fueled by increasing drug misuse, stringent regulations, and a growing emphasis on worker safety. For example, drug screening is essential in sectors like transportation, healthcare, and construction to maintain regulatory compliance and secure workplaces. Advancements in technology have led to the emergence of innovative drug screening solutions. Techniques such as thin-layer chromatography, gas chromatography-mass spectrometry, and high-performance liquid chromatography are widely used for drug screening due to their high accuracy and specificity.
Rapid diagnostic tests, immunoassay methods, and point-of-care testing have also gained popularity for their convenience and quick turnaround time. The market is marked by a competitive landscape, with key players like Abbott and Thermo Fisher offering a diverse range of drug screening products. Laboratory accreditation, method validation, and regulatory compliance are crucial aspects of the market, ensuring the reliability and accuracy of drug screening results. False negative and false positive rates, analytical sensitivity, precision testing, and accuracy assessment are essential considerations in the drug screening process. Sample preparation methods, data management systems, and quality control procedures are also vital components of the market.
The market for drug screening products is projected to grow significantly in the coming years, with an increasing number of industries recognizing the importance of drug screening for maintaining a safe and productive workforce. For instance, the demand for drug screening in the healthcare sector is expected to increase due to the growing prevalence of substance abuse and the need for accurate and reliable drug screening results. Moreover, the market is witnessing the integration of clinical decision support systems, which enable healthcare professionals to make informed decisions based on drug screening results. The use of confirmatory testing, chain of custody, and reference standards further enhances the reliability and accuracy of drug screening results.
In conclusion, the market is a dynamic and evolving landscape, driven by technological advancements, regulatory requirements, and the need for accurate and reliable drug screening solutions. The market's growth is expected to continue, with a focus on innovation, accuracy, and regulatory compliance.
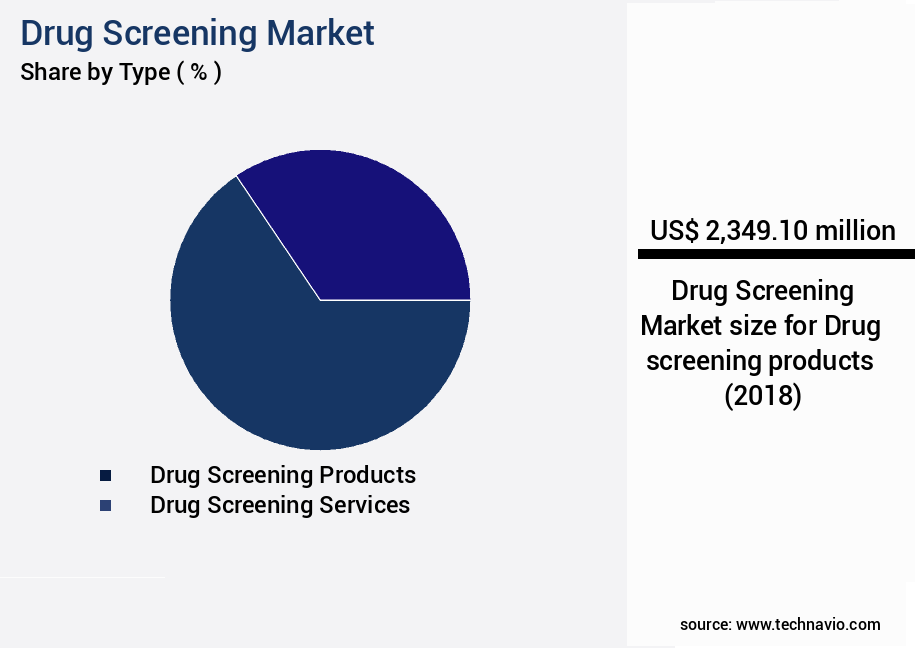
The Drug screening products segment was valued at USD 2.35 billion in 2018 and showed a gradual increase during the forecast period.
Regional Analysis
North America is estimated to contribute 46% to the growth of the global market during the forecast period.Technavio’s analysts have elaborately explained the regional trends and drivers that shape the market during the forecast period.
See How Drug Screening Market Demand is Rising in North America Request Free Sample
The market in North America is experiencing significant expansion due to stringent regulations and widespread testing programs in healthcare, transportation, and sporting sectors. In 2023, key factors fueling this growth included the increasing incidence of drug abuse and the demand for workplace safety. Quest Diagnostics, a leading industry player, responded to the opioid crisis by introducing a new drug testing panel specifically designed to detect fentanyl analogs.
Technological advancements, such as quick point-of-care testing tools and laboratory information management systems (LIMS), are also driving market growth. These developments underscore the market's potential for substantial growth during the forecast period.
Market Dynamics
Our researchers analyzed the data with 2023 as the base year, along with the key drivers, trends, and challenges. A holistic analysis of drivers will help companies refine their marketing strategies to gain a competitive advantage.
The market is a critical sector in the life sciences industry, driven by the need for accurate and efficient identification of drugs and metabolites in various samples. Technologies such as liquid chromatography tandem mass spectrometry (LC-MS/MS) drug testing play a pivotal role in this market, offering high sensitivity and specificity for detecting a wide range of substances. However, challenges persist, including immunoassay cross-reactivity interference and the need for optimization of drug screening cutoff concentrations. Gas chromatography mass spectrometry (GC-MS) remains another essential tool for metabolite identification, providing valuable insights into drug metabolism and pharmacokinetics. The market is further propelled by advancements in point-of-care testing device validation, enabling rapid, on-site drug screening for various applications.
Moreover, therapeutic drug monitoring (TDM) and pharmacokinetic analysis are increasingly reliant on mass spectrometry techniques, necessitating improvements in detection limits and high-throughput screening platform validation. Sample preparation techniques optimization is another critical area of focus, as it significantly impacts the accuracy and reliability of drug screening results. Improved accuracy assessment methodologies are also gaining traction, with a growing emphasis on minimizing false positives and negatives. In this context, a notable trend is the adoption of advanced statistical approaches and machine learning algorithms to enhance the accuracy and specificity of drug screening results. Compared to traditional methods, the adoption rates of automated, high-throughput drug screening platforms are nearly double, enabling faster turnaround times and increased productivity.
This shift towards automation is a significant driver of market growth, as labor-intensive manual methods are gradually being phased out. In conclusion, the market is a dynamic and evolving landscape, characterized by continuous innovation and advancements in analytical technologies. The focus on improving accuracy, reducing turnaround times, and minimizing costs is driving the adoption of advanced technologies and techniques, ultimately enhancing the overall efficiency and reliability of drug screening processes.
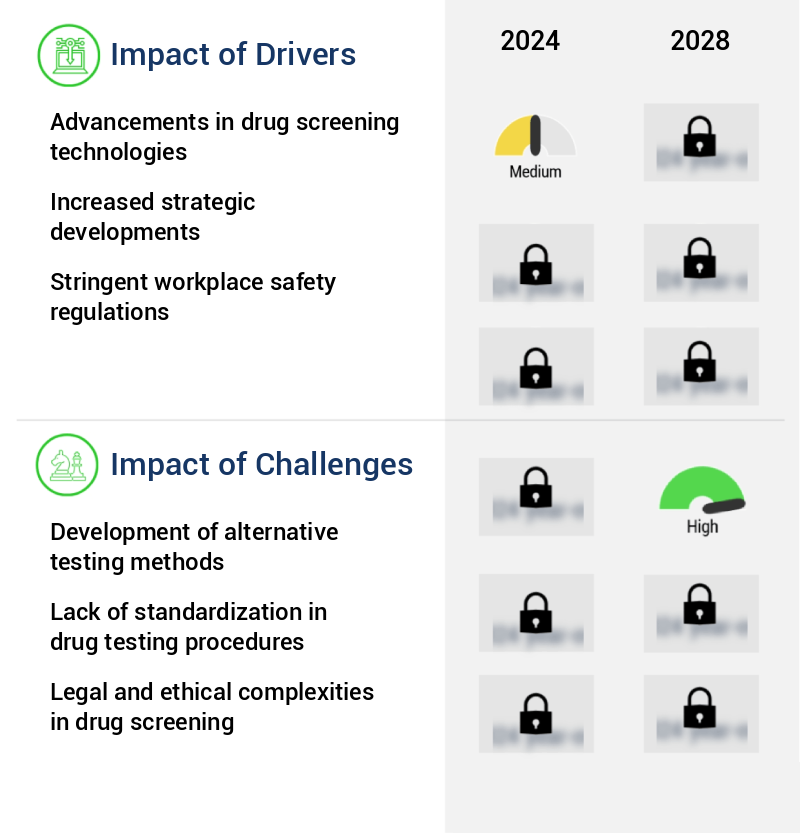
What are the key market drivers leading to the rise in the adoption of Drug Screening Industry?
- The significant advancements in drug screening technologies serve as the primary catalyst for market growth.
- The global drugs screening market experiences continuous growth due to advancements in drug detection technology. Innovations in testing equipment and procedures enhance the sensitivity, specificity, and effectiveness of drug screening. For example, the emergence of immunoassay-based fast tests enables on-site, rapid drug screening with immediate results. Furthermore, advanced analytical techniques like liquid chromatography-mass spectrometry (LC-MS) facilitate precise identification and quantification of drug compounds.
- Technological breakthroughs, such as microfluidic devices, biosensors, and lab-on-a-chip platforms, offer improved sensitivity, lower sample volumes, and quicker turnaround times. These advancements contribute to more reliable drug screening results, enabling better identification of a wide range of substances and their metabolites.
What are the market trends shaping the Drug Screening Industry?
- The integration of artificial intelligence (AI) and machine learning (ML) is becoming a prominent trend in the markets. These advanced technologies significantly enhance the drug discovery and development process.
- In the dynamic global drugs screening market, the incorporation of artificial intelligence (AI) and machine learning (ML) technologies is revolutionizing the industry. Traditional drug screening procedures are being enhanced through the application of advanced AI and ML algorithms, leading to increased precision, effectiveness, and reliability. These systems are capable of processing vast amounts of data and identifying trends indicative of drug use, thereby reducing the likelihood of human error. For example, AI-based algorithms can facilitate intricate drug test result analysis, while ML models can be trained to recognize emerging medication trends and adapt testing methods accordingly.
- Furthermore, AI-powered software streamlines data management and reporting, optimizing workflows and the drug screening decision-making process overall. The integration of AI and ML in drugs screening is a continuous and evolving process, with applications spanning various sectors and industries.
What challenges does the Drug Screening Industry face during its growth?
- The development of alternative testing methods poses a significant challenge to the industry's growth, requiring continuous innovation and investment to meet evolving regulatory requirements and consumer demands.
- The global drugs screening market experiences ongoing shifts as alternative methods for drug testing gain traction, challenging the dominance of traditional urine and blood testing. Sweat patch testing, oral fluid testing, and hair follicle testing each offer distinct advantages and disadvantages. For instance, sweat patch testing provides a longer detection window, while oral fluid testing offers a less invasive approach. Hair follicle testing, on the other hand, offers a broader detection window, but requires more complex laboratory analysis. The adoption of these alternative techniques poses challenges for companies conducting drug testing, necessitating investments in new technologies and potential alterations to their practices.
- Regulatory frameworks and standardization procedures may also require modifications to accommodate these new testing methodologies. As the market continues to evolve, it is crucial for companies to stay informed and adapt to meet the shifting consumer preferences and regulatory requirements.
Exclusive Technavio Analysis on Customer Landscape
The drug screening market forecasting report includes the adoption lifecycle of the market, covering from the innovator’s stage to the laggard’s stage. It focuses on adoption rates in different regions based on penetration. Furthermore, the drug screening market report also includes key purchase criteria and drivers of price sensitivity to help companies evaluate and develop their market growth analysis strategies.
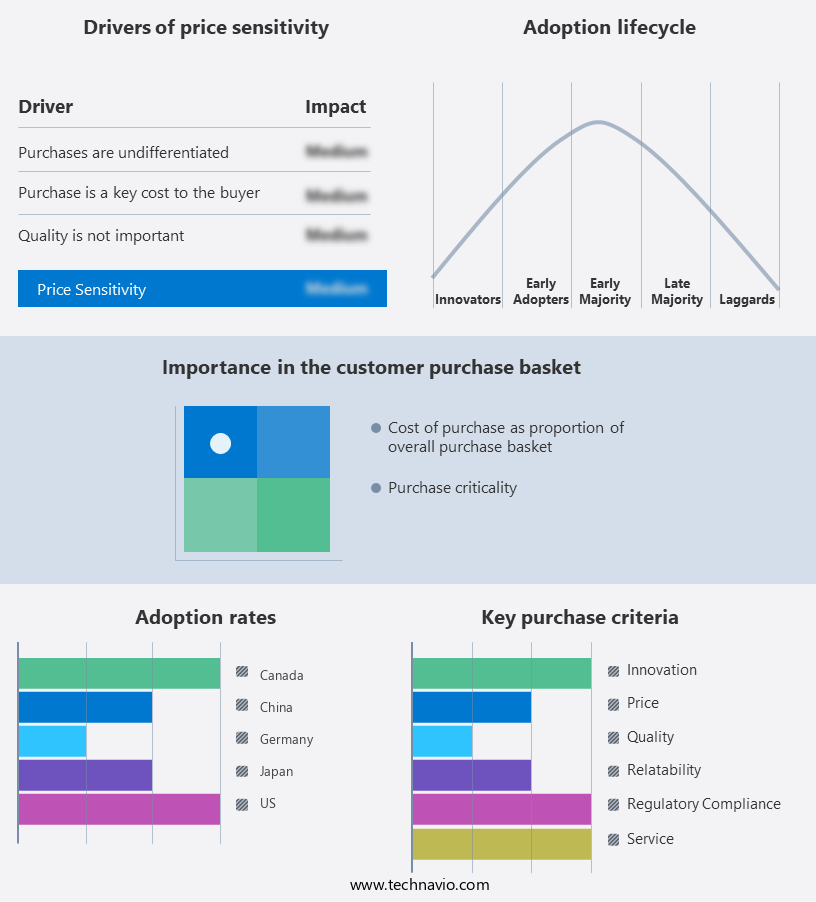
Customer Landscape of Drug Screening Industry
Competitive Landscape
Companies are implementing various strategies, such as strategic alliances, drug screening market forecast, partnerships, mergers and acquisitions, geographical expansion, and product/service launches, to enhance their presence in the industry.
Abbott Laboratories - This company specializes in providing drug screening solutions, including drug testing kits and devices, for various industries and applications. Their offerings enable efficient and accurate identification of potential substance use, contributing to workplace safety and regulatory compliance.
The industry research and growth report includes detailed analyses of the competitive landscape of the market and information about key companies, including:
- Abbott Laboratories
- Alfa Scientific Designs Inc
- bioMerieux SA
- Bio Rad Laboratories Inc.
- Bombardier Recreational Products Inc.
- Dragerwerk AG and Co. KGaA
- F. Hoffmann La Roche Ltd.
- Healgen Scientific, LLC
- Laboratory Corp. of America Holdings
- Lifeloc Technologies Inc.
- LINEAR CHEMICALS S.L.U
- Lochness Medical Supplies Inc.
- Omega Laboratories Inc.
- OraSure Technologies Inc.
- Premier Biotech Inc.
- Psychemedics Corp.
- Quest Diagnostics Inc.
- Shimadzu Corp.
- Siemens AG
- Thermo Fisher Scientific Inc.
Qualitative and quantitative analysis of companies has been conducted to help clients understand the wider business environment as well as the strengths and weaknesses of key industry players. Data is qualitatively analyzed to categorize companies as pure play, category-focused, industry-focused, and diversified; it is quantitatively analyzed to categorize companies as dominant, leading, strong, tentative, and weak.
Recent Development and News in Drug Screening Market
- In January 2024, Thermo Fisher Scientific, a leading life sciences solutions provider, announced the launch of its new Oncology Research Panel for its Q Exacta™ system. This innovative panel offers over 1,000 cancer-related genes and variants for comprehensive tumor profiling, marking a significant advancement in personalized oncology treatments (Thermo Fisher Scientific Press Release).
- In March 2024, Roche Diagnostics and Illumina, Inc. Entered into a strategic partnership to co-develop and commercialize a new, fully automated, sample-to-answer solution for infectious disease testing. This collaboration aims to improve diagnostic turnaround times and enhance laboratory efficiency (Roche Diagnostics Press Release).
- In May 2024, Quidel Corporation completed the acquisition of Alere's Point of Care Business from Abbott Laboratories for approximately USD1.2 billion. This acquisition significantly expanded Quidel's product portfolio and solidified its position as a leading provider of rapid diagnostic tests in various markets (Quidel Corporation Press Release).
- In February 2025, the U.S. Food and Drug Administration (FDA) granted marketing authorization for DiaSorin Molecular's new real-time PCR test, LIAISON XL® Analyzer, for the detection and differentiation of SARS-CoV-2 variants. This approval marks a crucial step in addressing the ongoing COVID-19 pandemic and improving the accuracy of diagnostic tests (FDA Press Release).
Dive into Technavio’s robust research methodology, blending expert interviews, extensive data synthesis, and validated models for unparalleled Drug Screening Market insights. See full methodology.
|
Market Scope |
|
|
Report Coverage |
Details |
|
Page number |
160 |
|
Base year |
2023 |
|
Historic period |
2018-2022 |
|
Forecast period |
2024-2028 |
|
Growth momentum & CAGR |
Accelerate at a CAGR of 21.49% |
|
Market growth 2024-2028 |
USD 10657.8 million |
|
Market structure |
Fragmented |
|
YoY growth 2023-2024(%) |
17.41 |
|
Key countries |
US, Germany, China, Japan, and Canada |
|
Competitive landscape |
Leading Companies, Market Positioning of Companies, Competitive Strategies, and Industry Risks |
Research Analyst Overview
- The market is a dynamic and evolving landscape, with ongoing advancements in technologies and techniques shaping its trajectory. Thin-layer chromatography and mass spectrometry techniques continue to play pivotal roles in drug metabolism studies, offering high-resolution separations and precise identification of compounds. Gas chromatography-mass spectrometry (GC-MS) and liquid chromatography-mass spectrometry (LC-MS) are particularly noteworthy, delivering exceptional sensitivity and accuracy in drug screening applications. False negative rates and detection limits are critical performance metrics in this domain, with rapid diagnostic tests, immunoassay methods, and point-of-care testing offering rapid results and low false positives. High-performance liquid chromatography (HPLC) and capillary electrophoresis are essential tools for chromatographic separation, ensuring precise analysis and reliable result interpretation.
- Laboratory accreditation, clinical validity, and regulatory compliance are cornerstones of drug screening, with ELISA sensitivity, chain of custody, and specificity assays ensuring accurate and reliable results. Clinical decision support and method validation are essential components of the drug screening process, ensuring that testing remains effective and aligned with the latest scientific research. Sample preparation methods, data management systems, and quality control procedures are integral to maintaining the integrity and reliability of drug screening results. Analytical specificity and precision testing are ongoing priorities, with reference standards and confirmatory testing playing crucial roles in ensuring the accuracy and consistency of drug screening outcomes.
- Toxicology testing and analytical sensitivity are essential areas of focus in the market, with regulatory compliance and regulatory bodies driving the adoption of advanced techniques and technologies. The ongoing evolution of drug screening technologies and methodologies reflects the dynamic nature of this market, with continuous innovation and improvement shaping its future.
What are the Key Data Covered in this Drug Screening Market Research and Growth Report?
-
What is the expected growth of the Drug Screening Market between 2024 and 2028?
-
USD 10.66 billion, at a CAGR of 21.49%
-
-
What segmentation does the market report cover?
-
The report segmented by Type (Drug screening products and Drug screening services), Application (Urine samples, Breath samples, Hair and blood samples, and Oral fluid samples), and Geography (North America, Europe, Asia, and Rest of World (ROW))
-
-
Which regions are analyzed in the report?
-
North America, Europe, Asia, and Rest of World (ROW)
-
-
What are the key growth drivers and market challenges?
-
Advancements in drug screening technologies, Development of alternative testing methods
-
-
Who are the major players in the Drug Screening Market?
-
Key Companies Abbott Laboratories, Alfa Scientific Designs Inc, bioMerieux SA, Bio Rad Laboratories Inc., Bombardier Recreational Products Inc., Dragerwerk AG and Co. KGaA, F. Hoffmann La Roche Ltd., Healgen Scientific, LLC, Laboratory Corp. of America Holdings, Lifeloc Technologies Inc., LINEAR CHEMICALS S.L.U, Lochness Medical Supplies Inc., Omega Laboratories Inc., OraSure Technologies Inc., Premier Biotech Inc., Psychemedics Corp., Quest Diagnostics Inc., Shimadzu Corp., Siemens AG, and Thermo Fisher Scientific Inc.
-
Market Research Insights
- The market encompasses a range of services and technologies used to confirmatory test for illicit substances in various contexts, including abstinence verification and occupational drug testing. Report generation, test performance characteristics, and external quality assessment are essential components of this market. Drug metabolites, such as THC-COOH and opiates, are frequently screened for, necessitating rigorous internal controls and proficiency testing to ensure adulteration detection and maintain legal defensibility. Cutoff concentrations for various drugs differ, with forensic toxicology and therapeutic drug monitoring requiring more stringent thresholds. The market includes diverse screening panels, result reporting mechanisms, and sample integrity maintenance practices.
- Quality assurance measures extend to specimen collection, instrument calibration, assay validation, data integrity, and oral fluid testing. Interference substances, such as certain medications and chemicals, pose challenges to test performance and necessitate ongoing research and development. Despite these complexities, the market continues to evolve, with urine and blood drug testing remaining the most common methods, while hair follicle testing and oral fluid testing gain popularity.
We can help! Our analysts can customize this drug screening market research report to meet your requirements.
 RIA -
RIA - 
