
Life Science Software Market Size 2025-2029
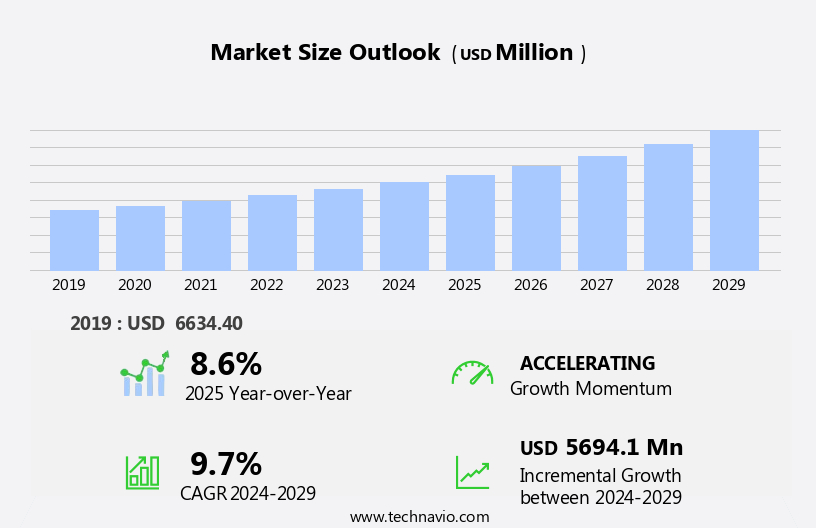
The life science software market size is forecast to increase by USD 5.69 billion, at a CAGR of 9.7% between 2024 and 2029.
- The market is experiencing significant growth, driven by the increasing emphasis on managing and storing vast amounts of patient data. This trend is particularly pronounced in the context of precision medicine, which relies on comprehensive patient data to deliver personalized treatments. However, this data-centric approach presents challenges, as the life sciences industry grapples with heightened security and privacy concerns. Ensuring the protection of sensitive patient information is a critical priority, necessitating robust data security measures and adherence to stringent regulatory standards.
- These dynamics underscore the importance of investing in advanced life science software solutions that can effectively manage and secure large volumes of data, while enabling the delivery of precision medicine treatments. Companies that can successfully navigate these challenges and capitalize on the opportunities presented by the growing focus on patient data will be well-positioned to thrive in this dynamic market.
What will be the Size of the Life Science Software Market during the forecast period?
Explore in-depth regional segment analysis with market size data - historical 2019-2023 and forecasts 2025-2029 - in the full report.
Request Free Sample
The market is characterized by its continuous evolution and dynamic nature, with ongoing advancements shaping the industry landscape. This market encompasses a range of applications, including agile development for research projects, biomarker discovery through data analysis, and research data management for genomics and proteomics research. Deep learning models and bioinformatics software play a pivotal role in this sector, enabling the processing and interpretation of vast amounts of scientific data. Technical support and software development ensure seamless integration of these tools, while machine learning algorithms and data visualization enhance their capabilities. Cloud-based software solutions, such as software-as-a-service (SaaS) and scientific data management systems, facilitate accessibility and collaboration among researchers and teams.
Clinical trial management, training and consulting, and regulatory affairs are also critical components of the market, ensuring compliance and efficiency in drug discovery and development processes. The integration of various tools, including chromatography data systems, spectroscopy data analysis, and automated workflow management, further enriches the life science software ecosystem. API integrations and software maintenance ensure compatibility and reliability, while user experience (UX) and user interface (UI) design optimize the interaction between researchers and software platforms. Computational biology, high-throughput screening, and molecular modeling are further applications that contribute to the ongoing advancements in the market, underscoring its importance in driving innovation and discovery in the scientific community.
How is this Life Science Software Industry segmented?
The life science software industry research report provides comprehensive data (region-wise segment analysis), with forecasts and estimates in "USD million" for the period 2025-2029, as well as historical data from 2019-2023 for the following segments.
- End-user
- Pharmaceutical
- Biotechnology
- Others
- Deployment
- Cloud-based
- On-premises
- Application
- Preclinical and clinical trials
- Supply chain management
- Research and development
- Commercial engagement and branding
- Others
- Geography
- North America
- US
- Canada
- Europe
- France
- Germany
- Italy
- UK
- APAC
- China
- India
- Japan
- South Korea
- Rest of World (ROW)
- North America
By End-user Insights
The pharmaceutical segment is estimated to witness significant growth during the forecast period.
Life science software plays a pivotal role in the pharmaceutical sector, providing a standardized healthcare infrastructure that complements existing Enterprise Resource Planning (ERP) systems. This software enhances logistics partnerships and facilitates collaboration with contract packagers. It also boosts company visibility, supports analytics, and offers risk management solutions. Throughout the product lifecycle, life science software expedites clinical trial management, product and project delivery, and regulatory compliance. It fosters innovative product development through collaborative efforts and enables personalized medicine through advanced analytics of clinical, sensor, and Big Data. Life science software solutions encompass various applications, such as machine learning algorithms for drug discovery, bioinformatics software for genomics research, and chromatography data systems for proteomics research.
Cloud-based software and software-as-a-service (SaaS) models offer flexibility and ease of integration with other systems. User experience (UX) and automated workflow management ensure efficient data integration and seamless data visualization. Deep learning models and API integrations streamline software development and maintenance, while regulatory affairs ensure compliance with evolving regulations. Mobile applications and spectroscopy data analysis tools provide accessibility and real-time data processing, enabling top-line growth for pharmaceutical companies. The market is expected to experience significant growth due to its ability to lower time-to-market, speed up research, and streamline commercial operations.
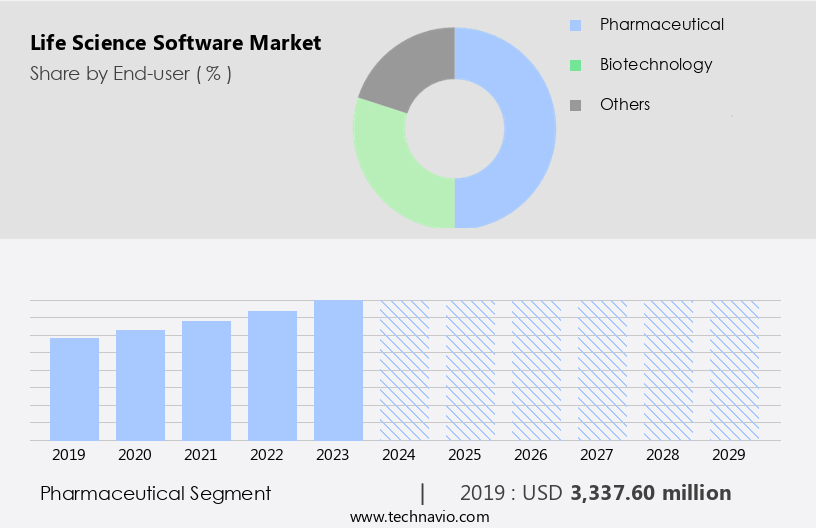
The Pharmaceutical segment was valued at USD 3.34 billion in 2019 and showed a gradual increase during the forecast period.
Regional Analysis
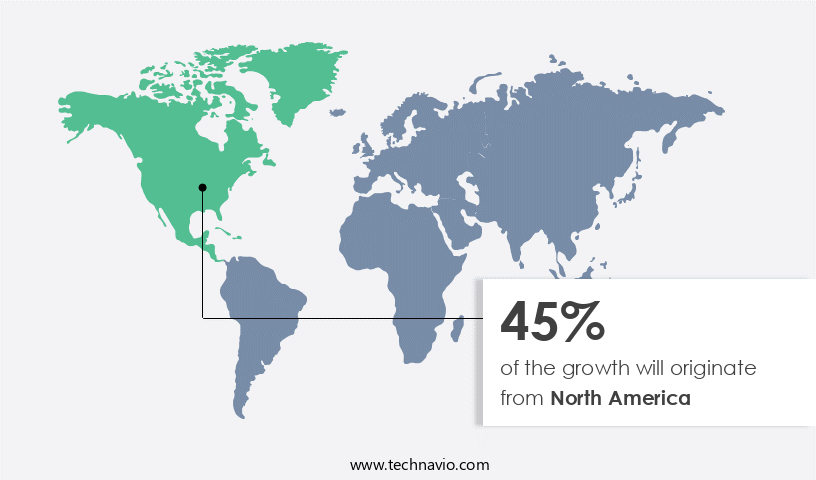
North America is estimated to contribute 45% to the growth of the global market during the forecast period.Technavio’s analysts have elaborately explained the regional trends and drivers that shape the market during the forecast period.
The market in North America is experiencing significant growth, driven by the increasing demand for secure data management and easy access to patient information. The US and Canada are major contributors to this market due to their technological maturity and early adoption of advanced technologies, such as machine learning algorithms, predictive analytics, and cloud-based solutions. The extensive digitalization of the life sciences industry in these economies has led to a massive generation of data, necessitating the use of software for effective management and analysis. Oracle and Veeva Systems are among the prominent players in the market, offering solutions for research data management, clinical trial management, scientific data management, and software-as-a-service (SaaS).
Agile development and automated workflow management are crucial in the development of bioinformatics software, molecular modeling, and computational biology. Deep learning models and user experience (UX) design are essential for data visualization and spectroscopy data analysis. Validation and qualification, regulatory affairs, and technical support are critical aspects of the market. Proteomics research, drug discovery, and high-throughput screening require software integration, while chromatography data systems and user interface (UI) design ensure efficient data management and analysis. API integrations and software maintenance are essential for ensuring seamless data flow and continuous improvement. The market trends include the adoption of cloud-based software, mobile applications, and automated workflow management.
Machine learning algorithms and deep learning models are transforming the industry by enabling predictive analytics and data integration. The market is expected to continue growing as the need for advanced software solutions in the life sciences industry persists.
Market Dynamics
Our researchers analyzed the data with 2024 as the base year, along with the key drivers, trends, and challenges. A holistic analysis of drivers will help companies refine their marketing strategies to gain a competitive advantage.
What are the key market drivers leading to the rise in the adoption of Life Science Software Industry?
- The increasing priority placed on the secure storage and management of patient information serves as the primary catalyst for market growth in this sector.
- The life sciences software market is witnessing significant growth due to the increasing need for efficient scientific data management and integration. With the surge in patient data, healthcare providers are investing heavily in advanced solutions, such as machine learning algorithms and chromatography data systems, to manage and analyze this data. Cloud-based software is gaining popularity due to its accessibility and scalability, enabling organizations to store and process large volumes of data more effectively. Clinical trial management is another key area where life sciences software is making a significant impact. These solutions help streamline the clinical trial process, ensuring data accuracy and compliance with regulatory requirements.
- Training and consulting services are also in demand to help organizations effectively implement and utilize these software solutions. Data integration is a critical challenge for many organizations in the life sciences industry. The need to connect various data sources and systems is driving demand for software solutions that can seamlessly integrate data from different sources and provide a unified view. Overall, the life sciences software market is expected to continue growing as organizations seek to improve their data management capabilities and gain insights to drive better healthcare outcomes.
What are the market trends shaping the Life Science Software Industry?
- Precision medicine is gaining prominence as the next market trend. This approach to healthcare focuses on customized treatment plans based on an individual's genetic makeup and other unique factors.
- In the realm of Life Sciences, Precision Medicine is revolutionizing the industry with its data-driven approach to healthcare. By incorporating genomics and recognizing lifestyle and environmental factors as critical determinants of human health, this methodology is extensively utilized in genomics and medical device manufacturing. The implementation of Precision Medicine addresses issues stemming from human error, thereby enhancing product and service quality. The technology's adoption in the Life Sciences sector is on the rise due to its error-free, consistent, and unwavering nature. Machines, unlike humans, do not lose focus, become emotional, or tire, ensuring the delivery of precise and accurate results.
- Precision Medicine dismantles the traditional concept of disease by identifying its subtypes, necessitating tailored treatments. These therapies are initiated at an early stage, making them more costly than standard care therapies. Bioinformatics software, a crucial component of Precision Medicine, employs deep learning models to analyze vast amounts of data. Software development in this area focuses on enhancing user experience (UX) and computational biology, enabling seamless interaction and data interpretation. Technical support is essential in the implementation and optimization of these advanced solutions. Proteomics research and drug discovery significantly benefit from the integration of Precision Medicine and its associated software tools.
- In conclusion, Precision Medicine's adoption in the Life Sciences sector is driven by its potential to improve healthcare outcomes and reduce human error. The integration of advanced technologies like deep learning models, bioinformatics software, and computational biology tools is essential for its successful implementation. Technical support plays a vital role in ensuring the seamless adoption and optimization of these solutions.
What challenges does the Life Science Software Industry face during its growth?
- The life sciences industry faces significant growth challenges due to escalating data security and privacy concerns, necessitating substantial investments in robust cybersecurity measures to safeguard sensitive information and maintain public trust.
- In the life science industry, cloud-based software solutions have gained significant traction due to their cost-effective nature and ease of accessibility. Organizations are increasingly opting for these solutions, which offer multiple features at affordable prices. The healthcare sector, including government agencies, heavily relies on cloud infrastructure for storing sensitive data. Centralized data storage and high-speed networks enable increased productivity and facilitate seamless data sharing and collaboration. Cloud-based life science software solutions offer several advantages. They require minimal upfront investment, ensuring cost savings. Software maintenance is simplified as updates and patches are automatically applied. Enhanced security features protect sensitive data, while API integrations allow for seamless data exchange between applications.
- Additionally, these solutions enable automated workflow management, making spectroscopy data analysis more efficient and harmonious. Mobile applications provide users with access to real-time information, further increasing convenience and productivity. Cloud solutions play a crucial role in addressing functional gaps in existing systems and processes. They offer the capacity to connect various departments and teams, fostering a more immersive and harmonious work environment. Recent research emphasizes the importance of user interface design in enhancing user experience and productivity. Cloud-based life science software solutions prioritize UI design, ensuring a professional and intuitive user experience. In conclusion, the adoption of cloud-based life science software solutions is a strategic investment for organizations seeking to optimize their operations, enhance collaboration, and improve overall productivity.
Exclusive Customer Landscape
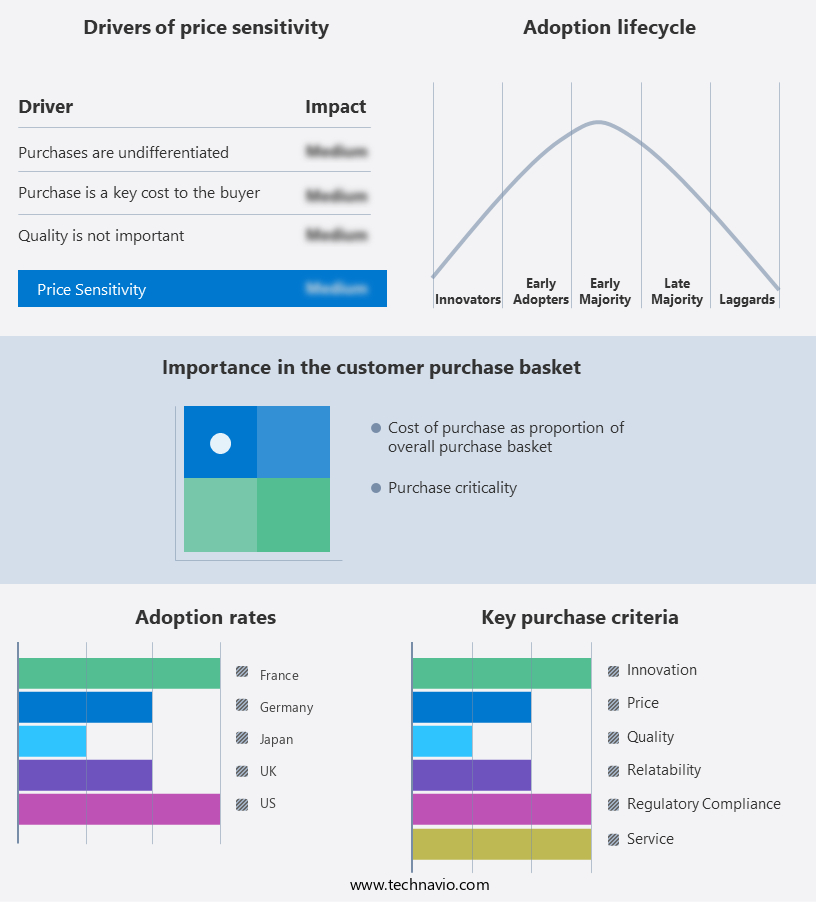
The life science software market forecasting report includes the adoption lifecycle of the market, covering from the innovator’s stage to the laggard’s stage. It focuses on adoption rates in different regions based on penetration. Furthermore, the life science software market report also includes key purchase criteria and drivers of price sensitivity to help companies evaluate and develop their market growth analysis strategies.
Customer Landscape
Key Companies & Market Insights
Companies are implementing various strategies, such as strategic alliances, life science software market forecast, partnerships, mergers and acquisitions, geographical expansion, and product/service launches, to enhance their presence in the industry.
ANSYS Inc. - This company specializes in advanced life science software solutions, featuring KnowItAll - a spectroscopy tool designed for managing and analyzing spectral data in research applications, particularly in the fields of protein and nucleic acid studies. KnowItAll streamlines data processing, enabling researchers to extract valuable insights from complex spectral information. By utilizing sophisticated algorithms and intuitive interfaces, this software enhances research productivity and facilitates groundbreaking discoveries.
The industry research and growth report includes detailed analyses of the competitive landscape of the market and information about key companies, including:
- ANSYS Inc.
- Bio Rad Laboratories Inc.
- Cegedim SA.
- Clario
- Dassault Systemes SE
- Dotmatics
- Fujitsu Ltd.
- Hewlett Packard Enterprise Co.
- Honeywell International Inc.
- International Business Machines Corp.
- IQVIA Holdings Inc.
- Oracle Corp.
- Perkin Elmer Inc.
- Salesforce Inc.
- SoftFormance
- Thermo Fisher Scientific Inc.
- Trinity
- Veeva Systems Inc.
- ZS Associates Inc.
Qualitative and quantitative analysis of companies has been conducted to help clients understand the wider business environment as well as the strengths and weaknesses of key industry players. Data is qualitatively analyzed to categorize companies as pure play, category-focused, industry-focused, and diversified; it is quantitatively analyzed to categorize companies as dominant, leading, strong, tentative, and weak.
Recent Development and News in Life Science Software Market
- In February 2023, Thermo Fisher Scientific, a leading life sciences solutions provider, announced the launch of its new LabSolutions LIMS 9.3 software, which offers enhanced data management capabilities and improved user experience for laboratories (Thermo Fisher Scientific Press Release, 2023).
- In May 2024, Illumina and Microsoft entered into a strategic partnership to integrate Microsoft Azure's AI capabilities into Illumina's genomics workflows, aiming to accelerate research and diagnostics in the life sciences sector (Microsoft News Center, 2024).
- In August 2024, PerkinElmer completed the acquisition of CytoVale, a biotech company specializing in microfluidic cell analysis, expanding PerkinElmer's portfolio in the life sciences software market (PerkinElmer Press Release, 2024).
- In November 2025, the European Commission approved the Horizon Europe research and innovation program, which includes a significant focus on digital transformation in the life sciences sector, with a â¬1 billion investment in digital solutions for health, research, and innovation (European Commission Press Release, 2025).
Research Analyst Overview
- In the life science industry, biotechnology companies are leveraging advanced technologies to drive innovation and improve efficiency. Cloud computing enables these firms to store and process large datasets from clinical trials and next-generation sequencing (NGS), microarray technology, and mass spectrometry. Regulatory approvals are streamlined through digital platforms, reducing the time and cost of bringing new products to market. Big data analytics and predictive modeling are revolutionizing pharmaceutical development by identifying potential drug targets and optimizing clinical trial designs. Data governance is crucial to ensure data standardization and privacy, as academic research institutions and biotech startups collaborate on precision medicine initiatives.
- Venture capital investments in open source software, workflow automation, and biorepository management are transforming the industry. Open data standards facilitate collaboration and accelerate innovation, while biopharmaceutical manufacturing and personalized medicine rely on data analytics for quality control and patient-specific treatments. Data privacy remains a concern, with regulatory requirements and ethical considerations shaping the use of patient data. Drug repurposing and digital pathology are also gaining traction, offering new opportunities for innovation and cost savings. Overall, the market is dynamic, with trends towards increased collaboration, data-driven insights, and regulatory compliance.
Dive into Technavio’s robust research methodology, blending expert interviews, extensive data synthesis, and validated models for unparalleled Life Science Software Market insights. See full methodology.
|
Market Scope |
|
|
Report Coverage |
Details |
|
Page number |
230 |
|
Base year |
2024 |
|
Historic period |
2019-2023 |
|
Forecast period |
2025-2029 |
|
Growth momentum & CAGR |
Accelerate at a CAGR of 9.7% |
|
Market growth 2025-2029 |
USD 5694.1 million |
|
Market structure |
Fragmented |
|
YoY growth 2024-2025(%) |
8.6 |
|
Key countries |
US, Canada, China, Germany, France, UK, Japan, India, South Korea, and Italy |
|
Competitive landscape |
Leading Companies, Market Positioning of Companies, Competitive Strategies, and Industry Risks |
What are the Key Data Covered in this Life Science Software Market Research and Growth Report?
- CAGR of the Life Science Software industry during the forecast period
- Detailed information on factors that will drive the growth and forecasting between 2025 and 2029
- Precise estimation of the size of the market and its contribution of the industry in focus to the parent market
- Accurate predictions about upcoming growth and trends and changes in consumer behaviour
- Growth of the market across North America, Europe, APAC, South America, and Middle East and Africa
- Thorough analysis of the market’s competitive landscape and detailed information about companies
- Comprehensive analysis of factors that will challenge the life science software market growth of industry companies
We can help! Our analysts can customize this life science software market research report to meet your requirements.
 RIA -
RIA - 
