Blockchain Gaming Market Analysis APAC, North America, Europe, South America, Middle East and Africa - US, China, The Philippines, Germany, UK - Size and Forecast 2024-2028

Blockchain Gaming Market Analysis APAC, North America, Europe, South America, Middle East and Africa - US, China, The Philippines, Germany, UK - Size and Forecast 2024-2028

Published: Jan 2024 151 Pages SKU: IRTNTR77340

Market Overview at a Glance

$43.46 B
Market Opportunity
58.51%
CAGR
57.51
YoY growth 2023-2024(%)

Blockchain Gaming Market Size 2024-2028

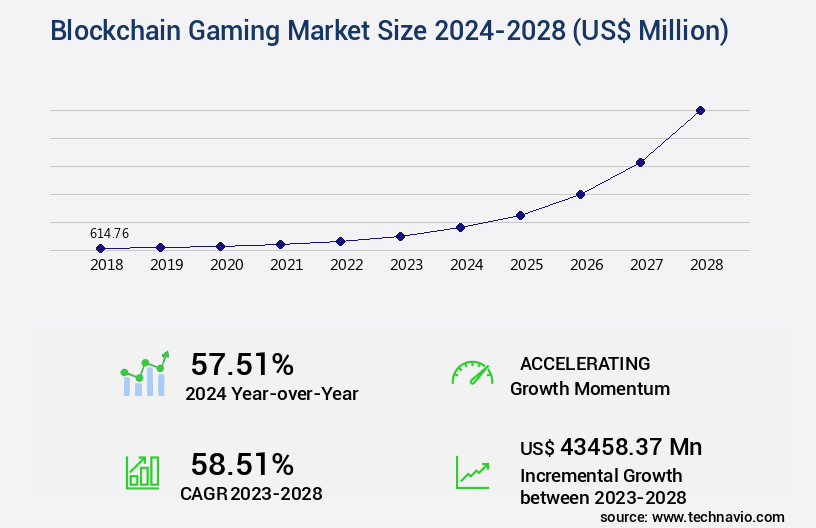
The blockchain gaming market size is valued to increase USD 43.46 billion, at a CAGR of 58.51% from 2023 to 2028. Rise of professional gaming will drive the blockchain gaming market.

Major Market Trends & Insights

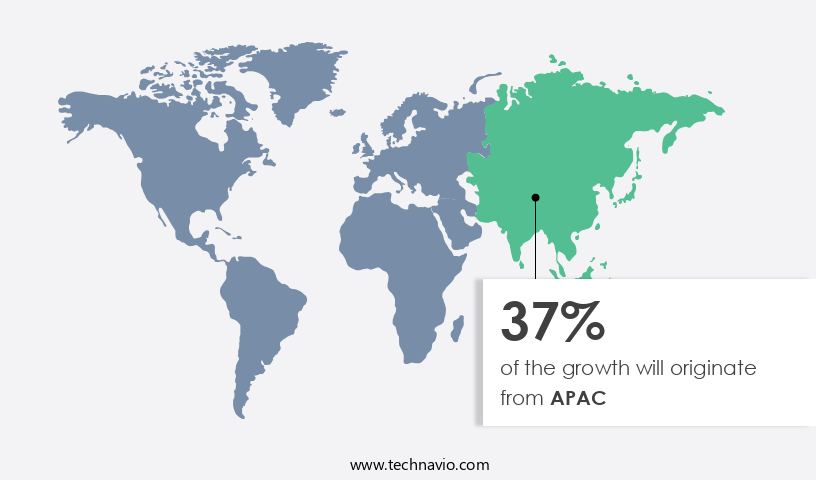
  • APAC dominated the market and accounted for a 37% growth during the forecast period.
  • By Type - Role playing games segment was valued at USD 226.41 billion in 2022
  • By Platform - ETH segment accounted for the largest market revenue share in 2022

Market Size & Forecast

  • Market Opportunities: USD 7.00 million
  • Market Future Opportunities: USD 43458.37 million
  • CAGR : 58.51%
  • APAC: Largest market in 2022

Market Summary

  • The market represents a dynamic and innovative sector, driven by the integration of core technologies such as decentralized finance (DeFi) and non-fungible tokens (NFTs). These technologies enable the emergence of play-to-earn gaming models, which have gained significant traction among gamers and investors alike. According to recent data, the market is projected to account for over 15% of the total blockchain market by 2025, reflecting the growing importance of this sector. However, challenges persist, including the limited game development expertise and regulatory uncertainties.
  • Despite these hurdles, opportunities abound, particularly in the form of increased user engagement, new revenue streams, and the potential for interoperability between different gaming platforms. The continuous unfolding of market activities and evolving patterns underscores the importance of staying informed in this rapidly evolving landscape.

What will be the Size of the Blockchain Gaming Market during the forecast period?

Blockchain Gaming Market Size

Get Key Insights on Market Forecast (PDF) Request Free Sample

How is the Blockchain Gaming Market Segmented and what are the key trends of market segmentation?

The blockchain gaming industry research report provides comprehensive data (region-wise segment analysis), with forecasts and estimates in "USD million" for the period 2024-2028, as well as historical data from 2018-2022 for the following segments.

  • Type
    • Role playing games
    • Open world games
    • Collectible games
  • Platform
    • ETH
    • BNB chain
    • Polygon
    • Others
  • Geography
    • North America
      • US
    • Europe
      • Germany
      • UK
    • APAC
      • China
      • The Philippines
    • Rest of World (ROW)

By Type Insights

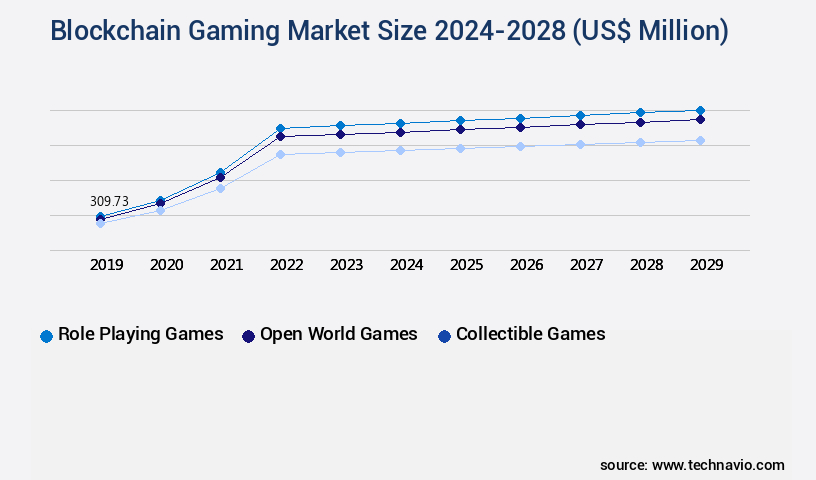
The role playing games segment is estimated to witness significant growth during the forecast period.

In the burgeoning market, role-playing games (RPGs) currently hold a significant share. According to recent data, RPGs accounted for approximately 60% of the market in 2023. This dominance can be attributed to the integration of blockchain technology, enabling cross-platform compatibility and expanding the player base. In-app purchases and virtual economy simulations have gained traction, with asset tokenization playing a crucial role in these games. The gamefi ecosystem, which includes blockchain gaming platforms, multiplayer game architecture, and NFT marketplaces, is a key driver for the market's growth. Anti-cheat mechanisms, metaverse gaming, tokenomics design, and virtual land ownership are essential components of this ecosystem.

Scalability solutions, interoperability standards, data encryption techniques, and cross-chain compatibility are other critical trends shaping the market. Smart contracts, user authentication systems, in-game asset ownership, and play-to-earn mechanics are transforming the gaming experience. Game engine optimization, game item rarity, and proof-of-stake consensus are essential elements that contribute to the market's continuous evolution. Cryptocurrency integration, game development frameworks, decentralized governance, wallet integration, and NFT integration are also gaining popularity. Future expectations indicate that the market will continue to grow, with in-game asset ownership and play-to-earn mechanics expected to increase by 35%. Decentralized exchanges (DEXs) and blockchain security audits are expected to play a significant role in the market's expansion.

Blockchain Gaming Market Size

Request Free Sample

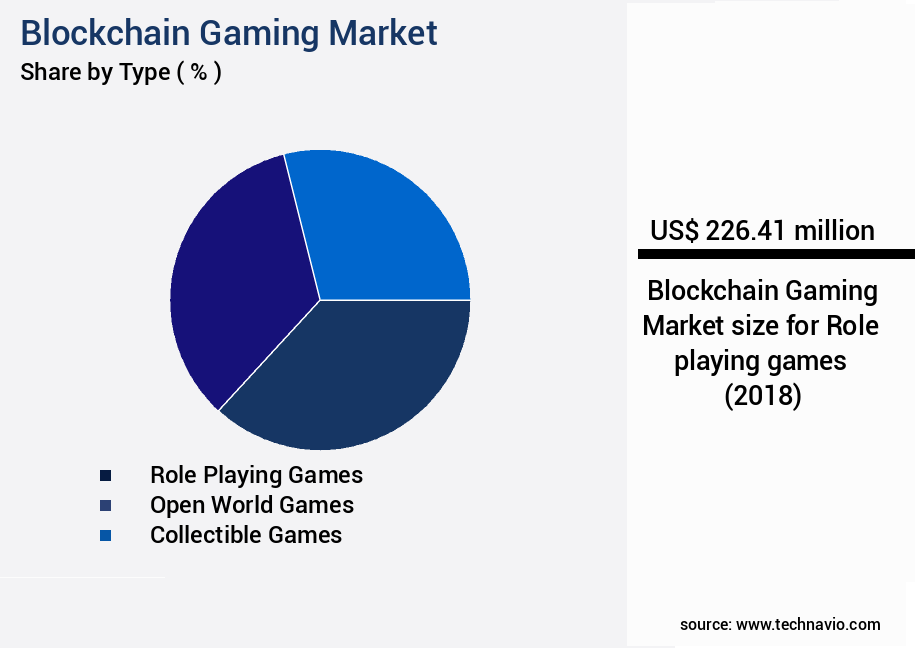
The Role playing games segment was valued at USD 226.41 billion in 2018 and showed a gradual increase during the forecast period.

Community management tools, digital asset management, and non-fungible tokens (NFTs) are other areas of potential growth. The integration of blockchain technology in gaming is revolutionizing the industry, offering new opportunities for developers, players, and investors. This transformation is ongoing, with new trends and applications continuously emerging. 

Blockchain Gaming Market Size

Request Free Sample

Regional Analysis

APAC is estimated to contribute 37% to the growth of the global market during the forecast period. Technavio's analysts have elaborately explained the regional trends and drivers that shape the market during the forecast period.

Blockchain Gaming Market Share by Geography

See How Blockchain Gaming Market Demand is Rising in APAC Request Free Sample

The APAC region holds a significant share in the market, with countries like South Korea, Japan, and China contributing substantially due to their large gaming populations and tech-savvy demographics. The regional market is poised for substantial growth, fueled by the adoption of blockchain technology and smart contracts. These innovations offer benefits such as asset ownership and control, and prevention of fraud and cheating, making the region an ideal landscape for blockchain gaming.

According to recent reports, the APAC market is expected to witness considerable expansion, with a considerable number of gamers embracing this technology. The region's strong gaming culture and the potential for increased user engagement make it a promising market for blockchain gaming companies.

Market Dynamics

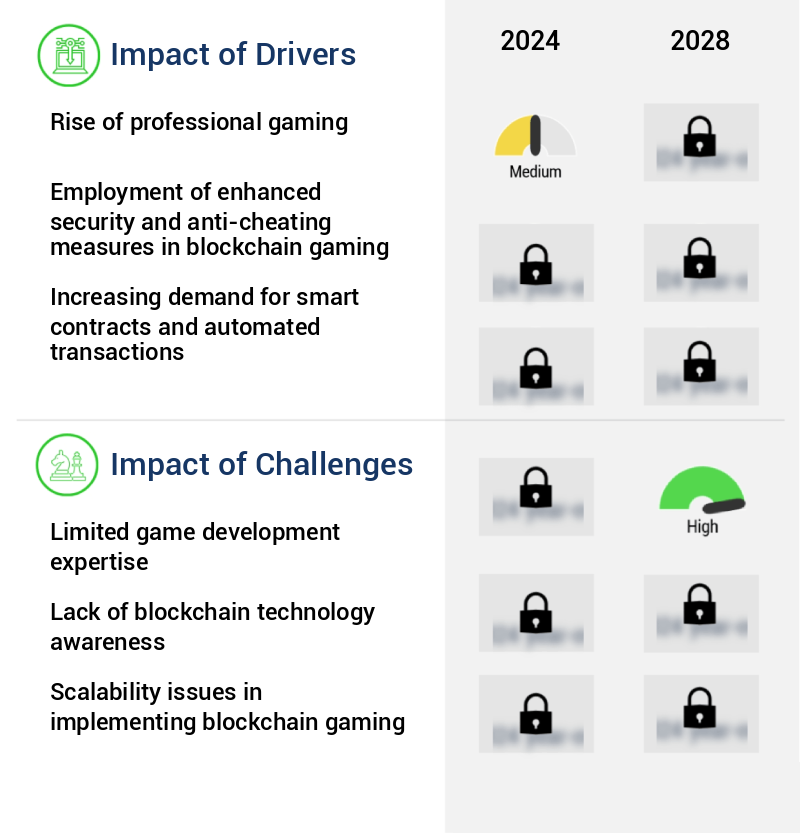
Our researchers analyzed the data with 2023 as the base year, along with the key drivers, trends, and challenges. A holistic analysis of drivers will help companies refine their marketing strategies to gain a competitive advantage.

The market is experiencing unprecedented growth, driven by the integration of NFT marketplaces in gaming platforms and the implementation of decentralized governance structures through Gaming DAOs. This shift towards decentralization offers players increased control over in-game assets, enabling digital rights management and virtual land ownership in the burgeoning metaverse development. Smart contract security audits are a critical focus for blockchain game developers, ensuring the integrity of play-to-earn tokenomics design models and cross-chain compatibility. In-game asset ownership and rarity algorithm implementation are essential components of these designs, with random number generator security and scalability solutions being key considerations for blockchain gaming networks.

Interoperability standards are essential for the NFT gaming ecosystem, allowing seamless integration and transactional efficiency between various platforms. Data encryption techniques and proof of stake consensus mechanisms are crucial elements of blockchain gaming security, while wallet integration with cryptocurrencies and anti-cheat mechanisms are essential for maintaining a fair and secure gaming environment. Game engine optimization and multiplayer game architecture are essential aspects of blockchain game development. Gas fees optimization strategies are also crucial to ensure a smooth user experience. The market for blockchain gaming is rapidly evolving, with adoption rates in the decentralized segment outpacing traditional gaming platforms by a significant margin.

This shift towards decentralization represents a paradigm shift in the gaming industry, offering players unprecedented control and ownership over their digital assets. Compared to traditional gaming markets, the blockchain gaming sector is projected to see exponential growth, with a substantial portion of new product developments focusing on this emerging technology. The potential for virtual economies and the integration of blockchain technology into game design models offer a wealth of opportunities for innovation and disruption in the gaming industry.

Blockchain Gaming Market Size

What are the key market drivers leading to the rise in the adoption of Blockchain Gaming Industry?

  • The emergence of professional gaming is the primary catalyst fueling market growth. 
  • The gaming industry has witnessed significant expansion, captivating audiences of all ages worldwide. This dynamic market, once primarily associated with children and adolescents, has evolved into a multibillion-dollar sector. Millions of adults have embraced gaming as a hobby, and some have even turned it into a lucrative career. The emergence of professional gaming, or esports, is a notable trend contributing to the industry's growth.
  • Esports players, teams, and tournaments have garnered substantial sponsorships and media attention, creating new opportunities for revenue generation. The intersection of gaming and blockchain technology is another intriguing development, with the potential to revolutionize gaming experiences and create new business models. This ongoing evolution underscores the industry's continuous growth and adaptability.

What are the market trends shaping the Blockchain Gaming Industry?

  • The emerging trend in the gaming market is the increase in popularity of play-to-earn gaming models. Play-to-earn gaming models are gaining traction as the next market trend.
  • The play-to-earn gaming model, where players can acquire cryptocurrency or valuable in-game assets, is a novel approach that has gained significant traction in the gaming industry. This economic incentive system has attracted a diverse player base, including those who view gaming as a potential source of income. The shift towards play-to-earn games, facilitated by blockchain technology, represents a new era in gaming. This model's allure lies in the direct translation of virtual achievements into tangible rewards, fostering increased user engagement.
  • Numerous players are drawn to the potential financial benefits, expanding the gaming community beyond traditional demographics. The play-to-earn gaming market's continuous evolution showcases its adaptability and potential to disrupt traditional gaming models.

What challenges does the Blockchain Gaming Industry face during its growth?

  • The lack of sufficient game development expertise poses a significant challenge to the industry's growth. With the increasing demand for advanced and immersive gaming experiences, the need for professionals with specialized skills in this field is more crucial than ever. To address this challenge, companies can invest in training programs, collaborate with educational institutions, or hire external experts to expand their in-house capabilities. By strengthening their game development teams, organizations can enhance their competitive edge and contribute to the industry's continued growth. 
  • The digital gaming market experiences continuous evolution, with creators constantly pushing boundaries to engage players. According to recent studies, the gaming industry's global revenue reached an impressive index number of 175.8 billion U.S. Dollars in 2020, marking a significant increase compared to the previous year. This growth is primarily driven by the increasing popularity of mobile gaming and the emergence of immersive technologies like virtual reality (VR) and augmented reality (AR). However, the market landscape is not without challenges. Traditional gaming genres face growing competition from innovative titles, as players seek fresh experiences. In response, gaming companies invest heavily in creative content, ensuring that new releases offer unique gameplay mechanics and captivating narratives.
  • This approach not only keeps players engaged but also attracts new audiences, contributing to the industry's ongoing expansion. In summary, the digital gaming market's future lies in continuous innovation and the ability to cater to evolving player preferences. With the integration of VR and AR technologies, the industry is poised for further growth and transformation.

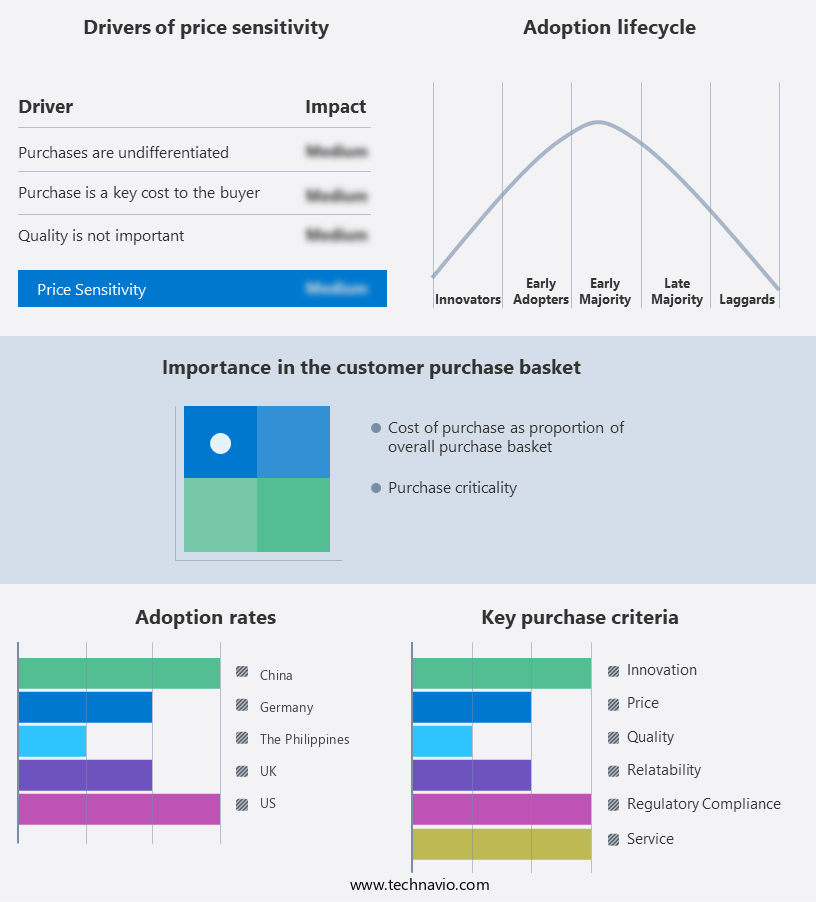
Exclusive Customer Landscape

The blockchain gaming market forecasting report includes the adoption lifecycle of the market, covering from the innovator's stage to the laggard's stage. It focuses on adoption rates in different regions based on penetration. Furthermore, the blockchain gaming market report also includes key purchase criteria and drivers of price sensitivity to help companies evaluate and develop their market growth analysis strategies.

Blockchain Gaming Market Share by Geography

 Customer Landscape of Blockchain Gaming Industry

Competitive Landscape & Market Insights

Companies are implementing various strategies, such as strategic alliances, blockchain gaming market forecast, partnerships, mergers and acquisitions, geographical expansion, and product/service launches, to enhance their presence in the industry.

Animoca Brands Corp. Ltd. - This company leads in the blockchain gaming industry through various brands, including Blond ISH, Ledger, SnoopDogg, Paris, and The Walking Dead. 

The industry research and growth report includes detailed analyses of the competitive landscape of the market and information about key companies, including:

  • Animoca Brands Corp. Ltd.
  • Big Time Studios
  • Cubix
  • Dapper Labs Inc.
  • Decentraland Foundation
  • EverdreamSoft SA.
  • Find Satoshi Lab
  • Gods Unchained
  • HYTOPIA
  • Immutable Pty Ltd
  • Merit Circle
  • My Crypto Heroes
  • Mythical Games
  • Ozone Networks Inc.
  • Quy Technology Pvt. Ltd.
  • Sky Mavis
  • VK LLC
  • World of Ether
  • Yield Guild Games Association

Qualitative and quantitative analysis of companies has been conducted to help clients understand the wider business environment as well as the strengths and weaknesses of key industry players. Data is qualitatively analyzed to categorize companies as pure play, category-focused, industry-focused, and diversified; it is quantitatively analyzed to categorize companies as dominant, leading, strong, tentative, and weak.

Recent Development and News in Blockchain Gaming Market

  • In January 2024, gaming giant Electronic Arts (EA) announced the launch of its new blockchain-based platform, EA Blockchain, aimed at creating digital ownership for gamers and enabling interoperability across different games (EA Press Release).
  • In March 2024, Ubisoft partnered with Animoca Brands to develop blockchain games using Ubisoft's intellectual properties, marking a significant move by a major game publisher into the blockchain gaming space (Ubisoft Press Release).
  • In May 2024, Dapper Labs, creators of the popular blockchain game CryptoKitties, raised a USD 250 million Series C funding round led by Coatue Management, valuing the company at USD 2.6 billion (TechCrunch).
  • In February 2025, the European Union's executive body, the European Commission, published a proposal for a regulation on markets in crypto-assets, which, if passed, would provide a legal framework for blockchain gaming and other crypto-asset markets in Europe (European Commission Press Release).

Dive into Technavio's robust research methodology, blending expert interviews, extensive data synthesis, and validated models for unparalleled Blockchain Gaming Market insights. See full methodology.

Market Scope

Report Coverage

Details

Page number

151

Base year

2023

Historic period

2018-2022

Forecast period

2024-2028

Growth momentum & CAGR

Accelerate at a CAGR of 58.51%

Market growth 2024-2028

USD 43,458.37 million

Market structure

Fragmented

YoY growth 2023-2024(%)

57.51

Key countries

US, China, The Philippines, Germany, and UK

Competitive landscape

Leading Companies, Market Positioning of Companies, Competitive Strategies, and Industry Risks

Request Free Sample

Research Analyst Overview

  • In the burgeoning realm of blockchain gaming, virtual economy simulations have emerged as a pivotal component, enabling players to engage in immersive experiences and monetize in-app purchases through asset tokenization. The GameFi ecosystem, a dynamic intersection of decentralized finance (DeFi) and gaming, is witnessing significant growth. Blockchain gaming platforms are revolutionizing multiplayer game architecture by implementing NFT marketplaces, ensuring secure and transparent asset trading. Anti-cheat mechanisms are being fortified to maintain fairness and integrity. Metaverse gaming is gaining traction, offering players the opportunity to explore virtual worlds and own virtual land. Scalability solutions and interoperability standards are crucial for the industry's growth, ensuring seamless integration of blockchain gaming platforms and enabling cross-chain compatibility.
  • Data encryption techniques and smart contracts underpin security and trust, while user authentication systems facilitate in-game asset ownership. Play-to-earn mechanics, a significant shift from traditional gaming models, are driving user engagement. Game engine optimization and game item rarity further enhance the gaming experience. Proof-of-stake consensus and cryptocurrency integration provide incentives for players and developers alike. Game development frameworks are evolving to accommodate decentralized governance, wallet integration, and NFT integration. Decentralized exchanges (DEXs) facilitate seamless trading of in-game assets, while blockchain security audits ensure platform safety. Community management tools and digital asset management systems further strengthen the ecosystem.
  • As the market continues to evolve, it presents a unique blend of innovation, investment opportunities, and entertainment.

What are the Key Data Covered in this Blockchain Gaming Market Research and Growth Report?

  • What is the expected growth of the Blockchain Gaming Market between 2024 and 2028?

    • USD 43.46 billion, at a CAGR of 58.51%

  • What segmentation does the market report cover?

    • The report segmented by Type (Role playing games, Open world games, and Collectible games), Platform (ETH, BNB chain, Polygon, and Others), and Geography (APAC, North America, Europe, South America, and Middle East and Africa)

  • Which regions are analyzed in the report?

    • APAC, North America, Europe, South America, and Middle East and Africa

  • What are the key growth drivers and market challenges?

    • Rise of professional gaming, Limited game development expertise

  • Who are the major players in the Blockchain Gaming Market?

    • Key Companies Animoca Brands Corp. Ltd., Big Time Studios, Cubix, Dapper Labs Inc., Decentraland Foundation, EverdreamSoft SA., Find Satoshi Lab, Gods Unchained, HYTOPIA, Immutable Pty Ltd, Merit Circle, My Crypto Heroes, Mythical Games, Ozone Networks Inc., Quy Technology Pvt. Ltd., Sky Mavis, VK LLC, World of Ether, and Yield Guild Games Association

Market Research Insights

  • The market continues to evolve, integrating advanced technologies to enhance gameplay experiences. Two significant aspects of this sector are the integration of decentralized storage and the implementation of smart contract security. According to recent estimates, the decentralized storage market in gaming is projected to reach USD 3.1 billion by 2026, growing at a compound annual growth rate of 43.8%. In contrast, smart contract security in gaming is expected to expand at a CAGR of 54.2% during the same period, reaching USD 3.7 billion.
  • These figures underscore the importance of secure data storage and smart contract functionality in the blockchain gaming landscape. As the market matures, developers will focus on optimizing gas fees, reducing network latency, and designing scalable solutions to accommodate growing user bases. Additionally, community building strategies, NFT minting processes, and reward distribution systems will continue to shape player engagement and in-game economies.

We can help! Our analysts can customize this blockchain gaming market research report to meet your requirements.

Get in touch

1 Executive Summary

  • 1.1 Market overview
    • Exhibit 01: Executive Summary – Chart on Market Overview
    • Exhibit 02: Executive Summary – Data Table on Market Overview
    • Exhibit 03: Executive Summary – Chart on Global Market Characteristics
    • Exhibit 04: Executive Summary – Chart on Market by Geography
    • Exhibit 05: Executive Summary – Chart on Market Segmentation by Type
    • Exhibit 06: Executive Summary – Chart on Market Segmentation by Platform
    • Exhibit 07: Executive Summary – Chart on Incremental Growth
    • Exhibit 08: Executive Summary – Data Table on Incremental Growth
    • Exhibit 09: Executive Summary – Chart on Vendor Market Positioning

2 Market Landscape

  • 2.1 Market ecosystem
    • Exhibit 10: Parent market
    • Exhibit 11: Market Characteristics

3 Market Sizing

  • 3.1 Market definition
    • Exhibit 12: Offerings of vendors included in the market definition
  • 3.2 Market segment analysis
    • Exhibit 13: Market segments
  • 3.3 Market size 2023
    • 3.4 Market outlook: Forecast for 2023-2028
      • Exhibit 14: Chart on Global - Market size and forecast 2023-2028 ($ million)
      • Exhibit 15: Data Table on Global - Market size and forecast 2023-2028 ($ million)
      • Exhibit 16: Chart on Global Market: Year-over-year growth 2023-2028 (%)
      • Exhibit 17: Data Table on Global Market: Year-over-year growth 2023-2028 (%)

    4 Historic Market Size

    • 4.1 Global blockchain gaming market 2018 - 2022
      • Exhibit 18: Historic Market Size – Data Table on global blockchain gaming market 2018 - 2022 ($ million)
    • 4.2 Type Segment Analysis 2018 - 2022
      • Exhibit 19: Historic Market Size – Type Segment 2018 - 2022 ($ million)
    • 4.3 Platform Segment Analysis 2018 - 2022
      • Exhibit 20: Historic Market Size – Platform Segment 2018 - 2022 ($ million)
    • 4.4 Geography Segment Analysis 2018 - 2022
      • Exhibit 21: Historic Market Size – Geography Segment 2018 - 2022 ($ million)
    • 4.5 Country Segment Analysis 2018 - 2022
      • Exhibit 22: Historic Market Size – Country Segment 2018 - 2022 ($ million)

    5 Five Forces Analysis

    • 5.1 Five forces summary
      • Exhibit 23: Five forces analysis - Comparison between 2023 and 2028
    • 5.2 Bargaining power of buyers
      • Exhibit 24: Chart on Bargaining power of buyers – Impact of key factors 2023 and 2028
    • 5.3 Bargaining power of suppliers
      • Exhibit 25: Bargaining power of suppliers – Impact of key factors in 2023 and 2028
    • 5.4 Threat of new entrants
      • Exhibit 26: Threat of new entrants – Impact of key factors in 2023 and 2028
    • 5.5 Threat of substitutes
      • Exhibit 27: Threat of substitutes – Impact of key factors in 2023 and 2028
    • 5.6 Threat of rivalry
      • Exhibit 28: Threat of rivalry – Impact of key factors in 2023 and 2028
    • 5.7 Market condition
      • Exhibit 29: Chart on Market condition - Five forces 2023 and 2028

    6 Market Segmentation by Type

    • 6.1 Market segments
      • Exhibit 30: Chart on Type - Market share 2023-2028 (%)
      • Exhibit 31: Data Table on Type - Market share 2023-2028 (%)
    • 6.2 Comparison by Type
      • Exhibit 32: Chart on Comparison by Type
      • Exhibit 33: Data Table on Comparison by Type
    • 6.3 Role playing games - Market size and forecast 2023-2028
      • Exhibit 34: Chart on Role playing games - Market size and forecast 2023-2028 ($ million)
      • Exhibit 35: Data Table on Role playing games - Market size and forecast 2023-2028 ($ million)
      • Exhibit 36: Chart on Role playing games - Year-over-year growth 2023-2028 (%)
      • Exhibit 37: Data Table on Role playing games - Year-over-year growth 2023-2028 (%)
    • 6.4 Open world games - Market size and forecast 2023-2028
      • Exhibit 38: Chart on Open world games - Market size and forecast 2023-2028 ($ million)
      • Exhibit 39: Data Table on Open world games - Market size and forecast 2023-2028 ($ million)
      • Exhibit 40: Chart on Open world games - Year-over-year growth 2023-2028 (%)
      • Exhibit 41: Data Table on Open world games - Year-over-year growth 2023-2028 (%)
    • 6.5 Collectible games - Market size and forecast 2023-2028
      • Exhibit 42: Chart on Collectible games - Market size and forecast 2023-2028 ($ million)
      • Exhibit 43: Data Table on Collectible games - Market size and forecast 2023-2028 ($ million)
      • Exhibit 44: Chart on Collectible games - Year-over-year growth 2023-2028 (%)
      • Exhibit 45: Data Table on Collectible games - Year-over-year growth 2023-2028 (%)
    • 6.6 Market opportunity by Type
      • Exhibit 46: Market opportunity by Type ($ million)
      • Exhibit 47: Data Table on Market opportunity by Type ($ million)

    7 Market Segmentation by Platform

    • 7.1 Market segments
      • Exhibit 48: Chart on Platform - Market share 2023-2028 (%)
      • Exhibit 49: Data Table on Platform - Market share 2023-2028 (%)
    • 7.2 Comparison by Platform
      • Exhibit 50: Chart on Comparison by Platform
      • Exhibit 51: Data Table on Comparison by Platform
    • 7.3 ETH - Market size and forecast 2023-2028
      • Exhibit 52: Chart on ETH - Market size and forecast 2023-2028 ($ million)
      • Exhibit 53: Data Table on ETH - Market size and forecast 2023-2028 ($ million)
      • Exhibit 54: Chart on ETH - Year-over-year growth 2023-2028 (%)
      • Exhibit 55: Data Table on ETH - Year-over-year growth 2023-2028 (%)
    • 7.4 BNB chain - Market size and forecast 2023-2028
      • Exhibit 56: Chart on BNB chain - Market size and forecast 2023-2028 ($ million)
      • Exhibit 57: Data Table on BNB chain - Market size and forecast 2023-2028 ($ million)
      • Exhibit 58: Chart on BNB chain - Year-over-year growth 2023-2028 (%)
      • Exhibit 59: Data Table on BNB chain - Year-over-year growth 2023-2028 (%)
    • 7.5 Polygon - Market size and forecast 2023-2028
      • Exhibit 60: Chart on Polygon - Market size and forecast 2023-2028 ($ million)
      • Exhibit 61: Data Table on Polygon - Market size and forecast 2023-2028 ($ million)
      • Exhibit 62: Chart on Polygon - Year-over-year growth 2023-2028 (%)
      • Exhibit 63: Data Table on Polygon - Year-over-year growth 2023-2028 (%)
    • 7.6 Others - Market size and forecast 2023-2028
      • Exhibit 64: Chart on Others - Market size and forecast 2023-2028 ($ million)
      • Exhibit 65: Data Table on Others - Market size and forecast 2023-2028 ($ million)
      • Exhibit 66: Chart on Others - Year-over-year growth 2023-2028 (%)
      • Exhibit 67: Data Table on Others - Year-over-year growth 2023-2028 (%)
    • 7.7 Market opportunity by Platform
      • Exhibit 68: Market opportunity by Platform ($ million)
      • Exhibit 69: Data Table on Market opportunity by Platform ($ million)

    8 Customer Landscape

    • 8.1 Customer landscape overview
      • Exhibit 70: Analysis of price sensitivity, lifecycle, customer purchase basket, adoption rates, and purchase criteria

    9 Geographic Landscape

    • 9.1 Geographic segmentation
      • Exhibit 71: Chart on Market share by geography 2023-2028 (%)
      • Exhibit 72: Data Table on Market share by geography 2023-2028 (%)
    • 9.2 Geographic comparison
      • Exhibit 73: Chart on Geographic comparison
      • Exhibit 74: Data Table on Geographic comparison
    • 9.3 APAC - Market size and forecast 2023-2028
      • Exhibit 75: Chart on APAC - Market size and forecast 2023-2028 ($ million)
      • Exhibit 76: Data Table on APAC - Market size and forecast 2023-2028 ($ million)
      • Exhibit 77: Chart on APAC - Year-over-year growth 2023-2028 (%)
      • Exhibit 78: Data Table on APAC - Year-over-year growth 2023-2028 (%)
    • 9.4 North America - Market size and forecast 2023-2028
      • Exhibit 79: Chart on North America - Market size and forecast 2023-2028 ($ million)
      • Exhibit 80: Data Table on North America - Market size and forecast 2023-2028 ($ million)
      • Exhibit 81: Chart on North America - Year-over-year growth 2023-2028 (%)
      • Exhibit 82: Data Table on North America - Year-over-year growth 2023-2028 (%)
    • 9.5 Europe - Market size and forecast 2023-2028
      • Exhibit 83: Chart on Europe - Market size and forecast 2023-2028 ($ million)
      • Exhibit 84: Data Table on Europe - Market size and forecast 2023-2028 ($ million)
      • Exhibit 85: Chart on Europe - Year-over-year growth 2023-2028 (%)
      • Exhibit 86: Data Table on Europe - Year-over-year growth 2023-2028 (%)
    • 9.6 South America - Market size and forecast 2023-2028
      • Exhibit 87: Chart on South America - Market size and forecast 2023-2028 ($ million)
      • Exhibit 88: Data Table on South America - Market size and forecast 2023-2028 ($ million)
      • Exhibit 89: Chart on South America - Year-over-year growth 2023-2028 (%)
      • Exhibit 90: Data Table on South America - Year-over-year growth 2023-2028 (%)
    • 9.7 Middle East and Africa - Market size and forecast 2023-2028
      • Exhibit 91: Chart on Middle East and Africa - Market size and forecast 2023-2028 ($ million)
      • Exhibit 92: Data Table on Middle East and Africa - Market size and forecast 2023-2028 ($ million)
      • Exhibit 93: Chart on Middle East and Africa - Year-over-year growth 2023-2028 (%)
      • Exhibit 94: Data Table on Middle East and Africa - Year-over-year growth 2023-2028 (%)
    • 9.8 US - Market size and forecast 2023-2028
      • Exhibit 95: Chart on US - Market size and forecast 2023-2028 ($ million)
      • Exhibit 96: Data Table on US - Market size and forecast 2023-2028 ($ million)
      • Exhibit 97: Chart on US - Year-over-year growth 2023-2028 (%)
      • Exhibit 98: Data Table on US - Year-over-year growth 2023-2028 (%)
    • 9.9 China - Market size and forecast 2023-2028
      • Exhibit 99: Chart on China - Market size and forecast 2023-2028 ($ million)
      • Exhibit 100: Data Table on China - Market size and forecast 2023-2028 ($ million)
      • Exhibit 101: Chart on China - Year-over-year growth 2023-2028 (%)
      • Exhibit 102: Data Table on China - Year-over-year growth 2023-2028 (%)
    • 9.10 The Philippines - Market size and forecast 2023-2028
      • Exhibit 103: Chart on The Philippines - Market size and forecast 2023-2028 ($ million)
      • Exhibit 104: Data Table on The Philippines - Market size and forecast 2023-2028 ($ million)
      • Exhibit 105: Chart on The Philippines - Year-over-year growth 2023-2028 (%)
      • Exhibit 106: Data Table on The Philippines - Year-over-year growth 2023-2028 (%)
    • 9.11 Germany - Market size and forecast 2023-2028
      • Exhibit 107: Chart on Germany - Market size and forecast 2023-2028 ($ million)
      • Exhibit 108: Data Table on Germany - Market size and forecast 2023-2028 ($ million)
      • Exhibit 109: Chart on Germany - Year-over-year growth 2023-2028 (%)
      • Exhibit 110: Data Table on Germany - Year-over-year growth 2023-2028 (%)
    • 9.12 UK - Market size and forecast 2023-2028
      • Exhibit 111: Chart on UK - Market size and forecast 2023-2028 ($ million)
      • Exhibit 112: Data Table on UK - Market size and forecast 2023-2028 ($ million)
      • Exhibit 113: Chart on UK - Year-over-year growth 2023-2028 (%)
      • Exhibit 114: Data Table on UK - Year-over-year growth 2023-2028 (%)
    • 9.13 Market opportunity by geography
      • Exhibit 115: Market opportunity by geography ($ million)
      • Exhibit 116: Data Tables on Market opportunity by geography ($ million)

    10 Drivers, Challenges, and Trends

    • 10.1 Market drivers
      • 10.2 Market challenges
        • 10.3 Impact of drivers and challenges
          • Exhibit 117: Impact of drivers and challenges in 2023 and 2028
        • 10.4 Market trends

          11 Vendor Landscape

          • 11.1 Overview
            • 11.2 Vendor landscape
              • Exhibit 118: Overview on Criticality of inputs and Factors of differentiation
            • 11.3 Landscape disruption
              • Exhibit 119: Overview on factors of disruption
            • 11.4 Industry risks
              • Exhibit 120: Impact of key risks on business

            12 Vendor Analysis

            • 12.1 Vendors covered
              • Exhibit 121: Vendors covered
            • 12.2 Market positioning of vendors
              • Exhibit 122: Matrix on vendor position and classification
            • 12.3 Animoca Brands Corp. Ltd.
              • Exhibit 123: Animoca Brands Corp. Ltd. - Overview
              • Exhibit 124: Animoca Brands Corp. Ltd. - Product / Service
              • Exhibit 125: Animoca Brands Corp. Ltd. - Key offerings
            • 12.4 Cubix
              • Exhibit 126: Cubix - Overview
              • Exhibit 127: Cubix - Product / Service
              • Exhibit 128: Cubix - Key offerings
            • 12.5 Dapper Labs Inc.
              • Exhibit 129: Dapper Labs Inc. - Overview
              • Exhibit 130: Dapper Labs Inc. - Product / Service
              • Exhibit 131: Dapper Labs Inc. - Key offerings
            • 12.6 Decentraland Foundation
              • Exhibit 132: Decentraland Foundation - Overview
              • Exhibit 133: Decentraland Foundation - Product / Service
              • Exhibit 134: Decentraland Foundation - Key offerings
            • 12.7 EverdreamSoft SA.
              • Exhibit 135: EverdreamSoft SA. - Overview
              • Exhibit 136: EverdreamSoft SA. - Product / Service
              • Exhibit 137: EverdreamSoft SA. - Key offerings
            • 12.8 Gods Unchained
              • Exhibit 138: Gods Unchained - Overview
              • Exhibit 139: Gods Unchained - Product / Service
              • Exhibit 140: Gods Unchained - Key offerings
            • 12.9 Immutable Pty Ltd
              • Exhibit 141: Immutable Pty Ltd - Overview
              • Exhibit 142: Immutable Pty Ltd - Product / Service
              • Exhibit 143: Immutable Pty Ltd - Key offerings
            • 12.10 My Crypto Heroes
              • Exhibit 144: My Crypto Heroes - Overview
              • Exhibit 145: My Crypto Heroes - Product / Service
              • Exhibit 146: My Crypto Heroes - Key offerings
            • 12.11 Mythical Games
              • Exhibit 147: Mythical Games - Overview
              • Exhibit 148: Mythical Games - Product / Service
              • Exhibit 149: Mythical Games - Key offerings
            • 12.12 Ozone Networks Inc.
              • Exhibit 150: Ozone Networks Inc. - Overview
              • Exhibit 151: Ozone Networks Inc. - Product / Service
              • Exhibit 152: Ozone Networks Inc. - Key offerings
            • 12.13 Quy Technology Pvt. Ltd.
              • Exhibit 153: Quy Technology Pvt. Ltd. - Overview
              • Exhibit 154: Quy Technology Pvt. Ltd. - Product / Service
              • Exhibit 155: Quy Technology Pvt. Ltd. - Key offerings
            • 12.14 Sky Mavis
              • Exhibit 156: Sky Mavis - Overview
              • Exhibit 157: Sky Mavis - Product / Service
              • Exhibit 158: Sky Mavis - Key offerings
            • 12.15 VK LLC
              • Exhibit 159: VK LLC - Overview
              • Exhibit 160: VK LLC - Product / Service
              • Exhibit 161: VK LLC - Key offerings
            • 12.16 World of Ether
              • Exhibit 162: World of Ether - Overview
              • Exhibit 163: World of Ether - Product / Service
              • Exhibit 164: World of Ether - Key offerings
            • 12.17 Yield Guild Games Association
              • Exhibit 165: Yield Guild Games Association - Overview
              • Exhibit 166: Yield Guild Games Association - Product / Service
              • Exhibit 167: Yield Guild Games Association - Key offerings

            13 Appendix

            • 13.1 Scope of the report
              • 13.2 Inclusions and exclusions checklist
                • Exhibit 168: Inclusions checklist
                • Exhibit 169: Exclusions checklist
              • 13.3 Currency conversion rates for US$
                • Exhibit 170: Currency conversion rates for US$
              • 13.4 Research methodology
                • Exhibit 171: Research methodology
                • Exhibit 172: Validation techniques employed for market sizing
                • Exhibit 173: Information sources
              • 13.5 List of abbreviations
                • Exhibit 174: List of abbreviations

              Research Methodology

              Technavio presents a detailed picture of the market by way of study, synthesis, and summation of data from multiple sources. The analysts have presented the various facets of the market with a particular focus on identifying the key industry influencers. The data thus presented is comprehensive, reliable, and the result of extensive research, both primary and secondary.

              INFORMATION SOURCES

              Primary sources

              • Manufacturers and suppliers
              • Channel partners
              • Industry experts
              • Strategic decision makers

              Secondary sources

              • Industry journals and periodicals
              • Government data
              • Financial reports of key industry players
              • Historical data
              • Press releases

              DATA ANALYSIS

              Data Synthesis

              • Collation of data
              • Estimation of key figures
              • Analysis of derived insights

              Data Validation

              • Triangulation with data models
              • Reference against proprietary databases
              • Corroboration with industry experts

              REPORT WRITING

              Qualitative

              • Market drivers
              • Market challenges
              • Market trends
              • Five forces analysis

              Quantitative

              • Market size and forecast
              • Market segmentation
              • Geographical insights
              • Competitive landscape

              Interested in this report?

              Get your sample now to see our research methodology and insights!

              Download Now

              Frequently Asked Questions

              Blockchain Gaming market growth will increase by $ 43458.37 mn during 2024-2028 .

              The Blockchain Gaming market is expected to grow at a CAGR of 58.51% during 2024-2028 .

              Blockchain Gaming market is segmented by Type( Role playing games, Open world games, Collectible games) Platform( ETH, BNB chain, Polygon, Others)

              Animoca Brands Corp. Ltd., Big Time Studios, Cubix, Dapper Labs Inc., Decentraland Foundation, EverdreamSoft SA., Find Satoshi Lab, Gods Unchained, HYTOPIA, Immutable Pty Ltd, Merit Circle, My Crypto Heroes, Mythical Games, Ozone Networks Inc., Quy Technology Pvt. Ltd., Sky Mavis, VK LLC, World of Ether, Yield Guild Games Association are a few of the key vendors in the Blockchain Gaming market.

              APAC will register the highest growth rate of 37% among the other regions. Therefore, the Blockchain Gaming market in APAC is expected to garner significant business opportunities for the vendors during the forecast period.

              US, China, The Philippines, Germany, UK

              • Rise of professional gamingGaming has gained immense popularity across the world. With gaming being increasingly available to people is the driving factor this market.
              • several gaming enthusiasts are choosing gaming as a career option. The video gaming industry that once revolved only around children and teenagers is currently a multi-billion-dollar industry with gamers of every age. There are millions of successful adults across the world who consider themselves hardcore gamers. Moreover is the driving factor this market.
              • many children who grew up with a passion for gaming have chosen gaming as a career option. The rise in professional gaming is the driving factor this market.
              • also known as esports is the driving factor this market.
              • has the potential to positively impact the growth of the global blockchain gaming market. The intersection of blockchain and professional gaming creates new opportunities for blockchain gaming development and adoption. Several role playing games require talented artists to bring the designer's ideas to life by creating vivid characters and environments from scratch. In addition is the driving factor this market.
              • game artists make use of communication technologies and animated characters with life-like mannerisms to deeply immerse their audiences in the gaming environment is the driving factor this market.
              • which increases the demand for professional gaming. Moreover is the driving factor this market.
              • professional gaming is also enabling the players to earn from the online gaming platforms. Blockchain technology is being integrated into esports platforms to enhance transparency is the driving factor this market.
              • secure transactions is the driving factor this market.
              • and create unique digital assets for players. Therefore is the driving factor this market.
              • the rise in professional gaming will drive the growth of the global blockchain gaming market during the forecast period. is the driving factor this market.

              The Blockchain Gaming market vendors should focus on grabbing business opportunities from the Role playing games segment as it accounted for the largest market share in the base year.