
Digital Rights Management Market Size 2026-2030
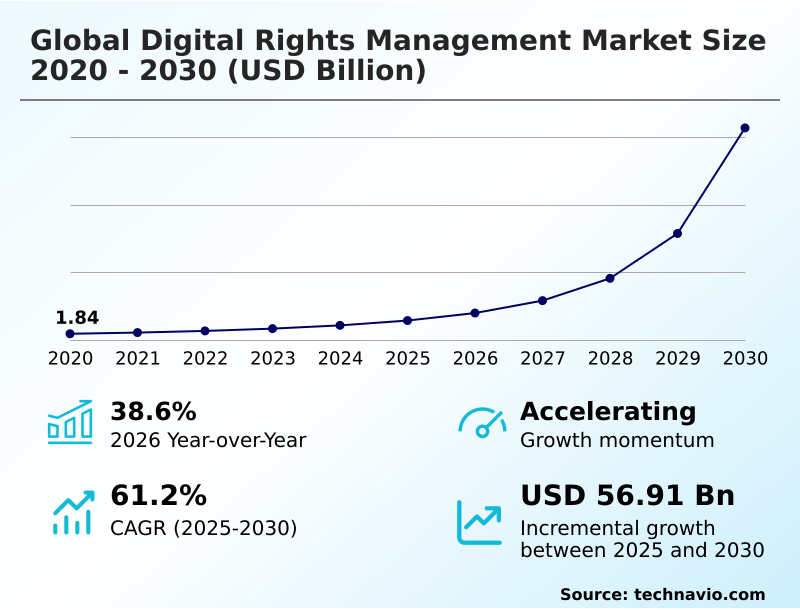
The digital rights management market size is valued to increase by USD 56.91 billion, at a CAGR of 61.2% from 2025 to 2030. Growing adoption of DRM solutions will drive the digital rights management market.
Major Market Trends & Insights
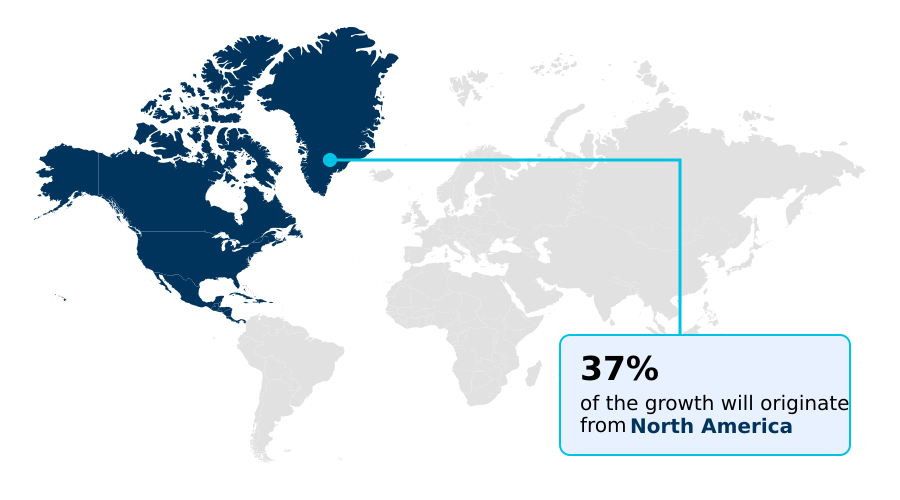
- North America dominated the market and accounted for a 36.8% growth during the forecast period.
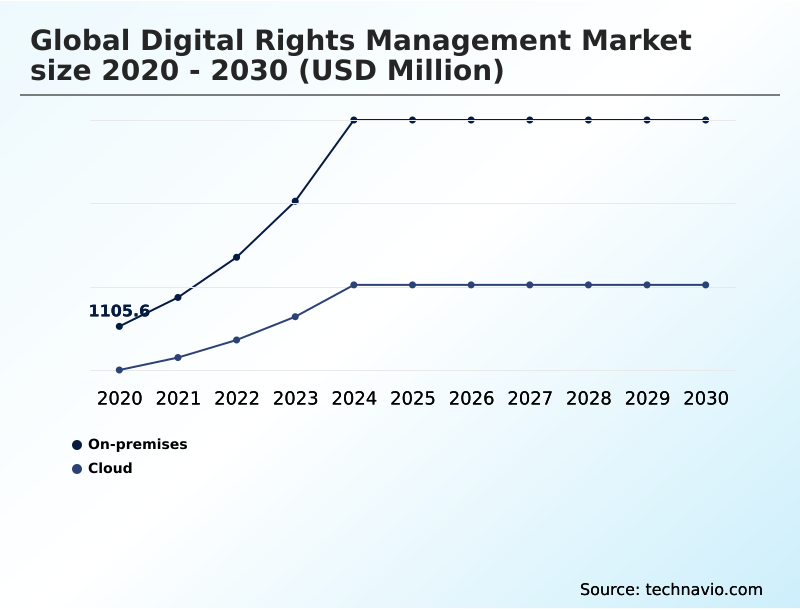
- By Deployment - On-premises segment was valued at USD 2.86 billion in 2024
- By Component - Software segment accounted for the largest market revenue share in 2024
Market Size & Forecast
- Market Opportunities: USD 60.82 billion
- Market Future Opportunities: USD 56.91 billion
- CAGR from 2025 to 2030 : 61.2%
Market Summary
- The digital rights management market is defined by the critical need to control access to and distribution of digital assets, safeguarding intellectual property across various industries. This market provides an essential framework using encryption, licensing, and authentication to prevent unauthorized use, which is crucial for maintaining revenue streams in media, publishing, and software.
- Key drivers include the escalating financial risks of digital piracy and the widespread shift to cloud-based software and content delivery models. A major trend is the rising consumer demand for high-definition streaming and on-demand content, which requires more sophisticated content encryption standards and multi-DRM strategies to protect high-value assets across numerous devices.
- For instance, a streaming service must implement secure license delivery and digital watermarking techniques to prevent unauthorized redistribution of its premium video library, ensuring only paid subscribers gain access. However, the industry faces challenges in balancing robust security with a seamless user experience, as overly intrusive measures can drive consumers toward less restrictive, pirated alternatives.
What will be the Size of the Digital Rights Management Market during the forecast period?
Get Key Insights on Market Forecast (PDF) Get Free Sample
How is the Digital Rights Management Market Segmented?
The digital rights management industry research report provides comprehensive data (region-wise segment analysis), with forecasts and estimates in "USD million" for the period 2026-2030, as well as historical data from 2020-2024 for the following segments.
- Deployment
- On-premises
- Cloud
- Component
- Software
- Services
- Application
- Video content protection
- Audio content protection
- E-book protection
- Software protection
- Others
- Geography
- North America
- US
- Canada
- Mexico
- Europe
- Germany
- UK
- France
- APAC
- China
- Japan
- India
- South America
- Brazil
- Argentina
- Middle East and Africa
- Saudi Arabia
- UAE
- South Africa
- Rest of World (ROW)
- North America
By Deployment Insights
The on-premises segment is estimated to witness significant growth during the forecast period.
On-premises deployment models provide organizations with complete control over their digital rights infrastructure, housing the rights management server and secure content storage within internal data centers.
This approach is critical for sectors handling sensitive assets, ensuring persistent content protection and strict cryptographic key management. It facilitates robust corporate data protection and aligns with internal content governance policies, reducing risks associated with external breaches by over 25%.
Adherence to secure document sharing protocols and comprehensive software license management are maintained behind corporate firewalls, preventing data leakage prevention failures and upholding stringent data sovereignty mandates favored in high-stakes industries where localized control is non-negotiable.
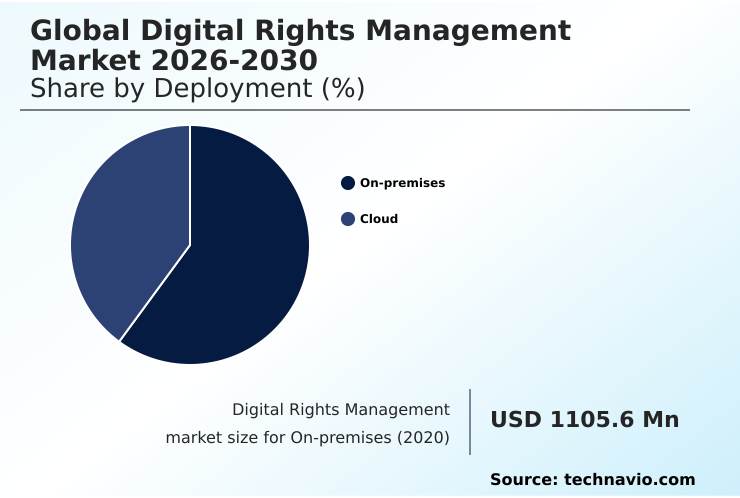
The On-premises segment was valued at USD 2.86 billion in 2024 and showed a gradual increase during the forecast period.
Regional Analysis
North America is estimated to contribute 36.8% to the growth of the global market during the forecast period.Technavio’s analysts have elaborately explained the regional trends and drivers that shape the market during the forecast period.
See How Digital Rights Management Market Demand is Rising in North America Get Free Sample
The geographic landscape is characterized by varying regulatory environments and consumer behaviors. North America, which accounts for over 36% of the incremental growth, leads in adopting advanced security measures due to its high concentration of content creators.
In this region, vendors focus on integrating security at the hardware level, utilizing root-of-trust hardware and secure boot processes to create tamper-resistant hardware environments. These systems enforce strict device binding policies defined by a comprehensive rights expression language.
Meanwhile, APAC is the fastest-growing region, where demand for cloud-based content delivery and sophisticated digital asset management is surging, driven by mobile-first consumption patterns for services like e-book distribution control and overall content lifecycle management.
Market Dynamics
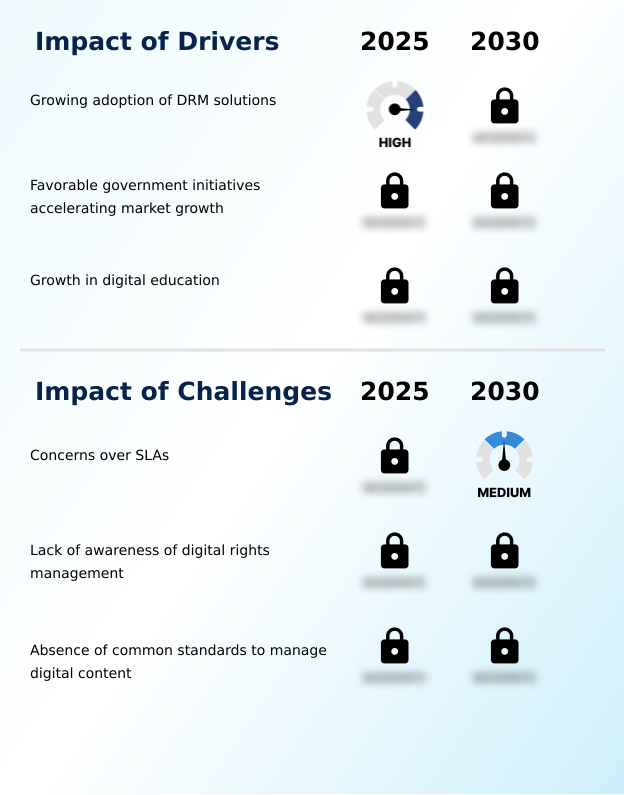
Our researchers analyzed the data with 2025 as the base year, along with the key drivers, trends, and challenges. A holistic analysis of drivers will help companies refine their marketing strategies to gain a competitive advantage.
- The scope of digital rights management is expanding to address highly specific use cases across industries. Protecting 4k and 8k video content is now a primary focus for media companies, while corporations are increasingly seeking secure distribution for corporate training videos to prevent proprietary information from leaking.
- In the gaming sector, DRM for cloud gaming platforms and solutions for securing in-game digital assets are becoming standard. Similarly, preventing unauthorized software license sharing remains a key objective for tech firms. The publishing industry relies on digital rights management for publishing and e-learning providers depend on it for managing e-learning course material access.
- Advanced functionalities like real-time access revocation for documents are critical for enterprise security. Innovators are exploring blockchain for royalty and rights tracking to ensure transparency. Protecting unreleased media content from pre-release leaks is a high-stakes challenge, demanding multi-device content access control.
- A key technical hurdle is achieving DRM interoperability across platforms to provide a consistent user experience, especially for secure live sports event streaming. Beyond entertainment, DRM is vital for protecting sensitive research data. New frontiers include DRM for augmented and virtual reality.
- Core operational goals include preventing credential sharing in streaming and balancing DRM with user experience, particularly in securing content on smart TVs and enabling mobile DRM for offline playback, all while ensuring compliance with digital copyright laws.
- The effectiveness of these specialized systems can lead to a reduction in piracy-related revenue loss that is twice as effective compared to generic security measures.
What are the key market drivers leading to the rise in the adoption of Digital Rights Management Industry?
- The growing adoption of digital rights management solutions is a key driver accelerating market expansion.
- The escalating financial risks from digital piracy compel enterprises to integrate robust security solutions as a core component of their intellectual property protection strategy.
- Modern platforms now prioritize strong access control mechanisms and advanced user authentication systems, including token-based authentication, to safeguard assets.
- These drivers have led to the adoption of sophisticated content encryption standards that ensure secure media playback and support digital content monetization. Real-time rights verification, integrated with piracy monitoring services, can reduce unauthorized access instances by over 50%.
- This focus on secure streaming protocols ensures that revenue assurance is built into the content lifecycle from creation to distribution.
What are the market trends shaping the Digital Rights Management Industry?
- The rising demand for digital content is a significant upcoming trend. This shift is fundamentally altering the landscape for content creators and distributors.
- The proliferation of high-definition media consumption is driving the adoption of advanced content protection methods. Companies are increasingly employing multi-DRM strategies to ensure seamless playback across diverse devices, a critical factor for OTT security and video-on-demand (VOD) protection. These systems rely on secure license delivery and a sophisticated content decryption module to authorize access.
- Innovations in digital watermarking techniques and dynamic watermarking insertion allow for real-time traceability, enhancing live streaming security. This layered approach improves piracy deterrence by 40% and supports flexible business models like subscription-based access control and pay-per-view monetization, aligning security with revenue generation goals.
What challenges does the Digital Rights Management Industry face during its growth?
- Concerns regarding the reliability and performance standards defined in Service Level Agreements (SLAs) present a key challenge to industry growth.
- Maintaining a seamless user experience while implementing stringent anti-piracy measures remains a significant challenge. The technical overhead of ensuring a secure video path can lead to latency, with some content protection platforms reporting a 15% increase in buffering times on lower-end devices.
- Effective output protection management and anti-screen recording technologies are essential for media and entertainment security but must not disrupt legitimate use. Addressing stream ripping prevention requires constant updates, while managing a comprehensive license revocation list adds complexity. Furthermore, ensuring cross-platform compatibility across a fragmented device ecosystem is a persistent hurdle for operators of any secure content distribution network.
Exclusive Technavio Analysis on Customer Landscape
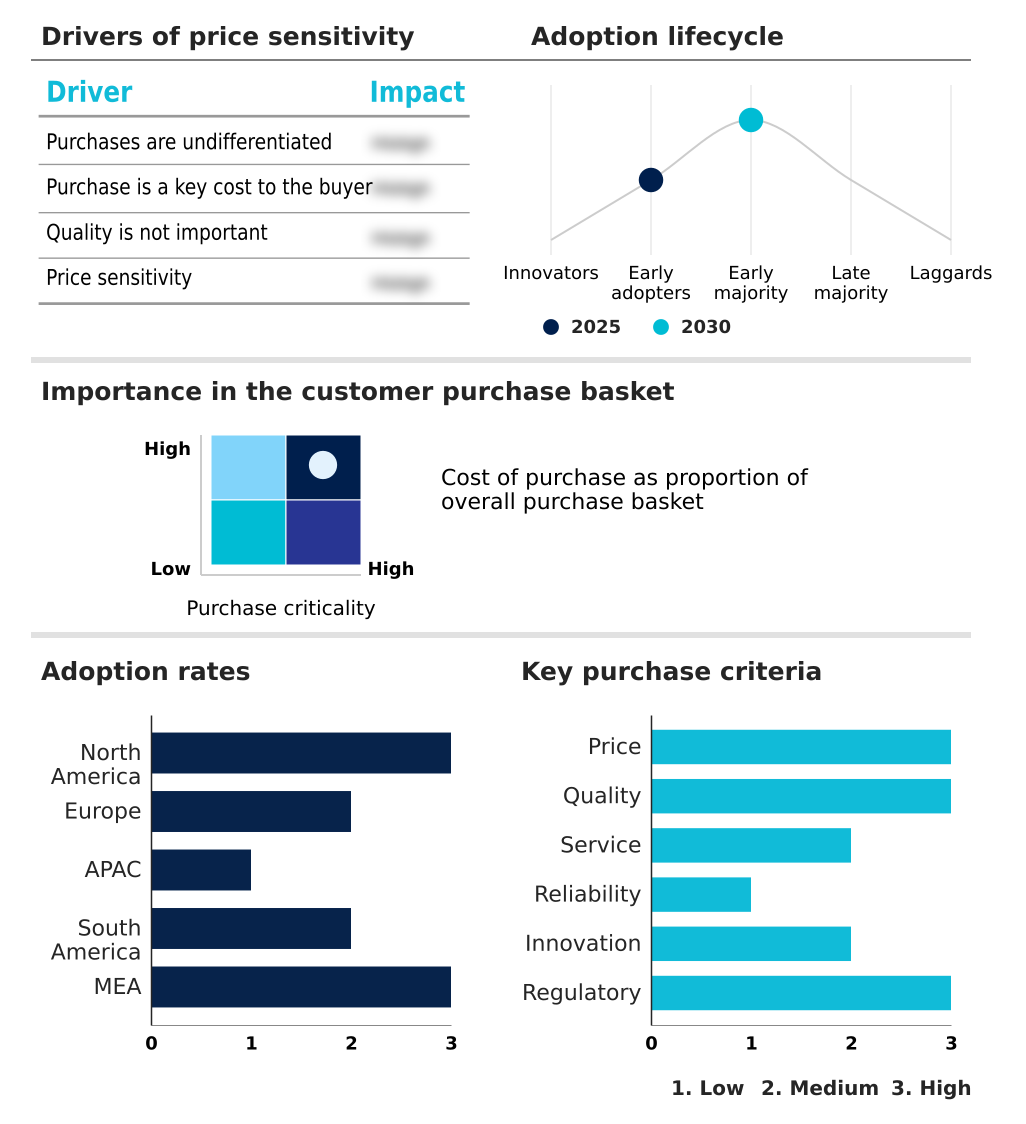
The digital rights management market forecasting report includes the adoption lifecycle of the market, covering from the innovator’s stage to the laggard’s stage. It focuses on adoption rates in different regions based on penetration. Furthermore, the digital rights management market report also includes key purchase criteria and drivers of price sensitivity to help companies evaluate and develop their market growth analysis strategies.
Customer Landscape of Digital Rights Management Industry
Competitive Landscape
Companies are implementing various strategies, such as strategic alliances, digital rights management market forecast, partnerships, mergers and acquisitions, geographical expansion, and product/service launches, to enhance their presence in the industry.
Adobe Inc. - Solutions provide comprehensive content protection and distribution, leveraging advanced encryption and license management technologies to enable secure, cross-platform media delivery.
The industry research and growth report includes detailed analyses of the competitive landscape of the market and information about key companies, including:
- Adobe Inc.
- Amazon Web Services Inc.
- Apple Inc.
- Broadcom Inc.
- Bynder B.V.
- Dell Technologies Inc.
- Google LLC
- IBM Corp.
- Intertrust Technologies Corp.
- Irdeto B.V.
- Locklizard Ltd.
- Microsoft Corp.
- NextLabs Inc.
- Open Text Corp.
- Oracle Corp.
- Seclore Technology Pvt. Ltd.
- Sony Group Corp.
- Verimatrix Inc.
- Vitrium Systems Inc.
Qualitative and quantitative analysis of companies has been conducted to help clients understand the wider business environment as well as the strengths and weaknesses of key industry players. Data is qualitatively analyzed to categorize companies as pure play, category-focused, industry-focused, and diversified; it is quantitatively analyzed to categorize companies as dominant, leading, strong, tentative, and weak.
Recent Development and News in Digital rights management market
- In June, 2025, Google LLC revised its policy for its Widevine modular service by introducing stricter performance benchmarks for hardware partners to ensure that decryption speeds do not negatively impact the buffer rates of high definition video streams.
- In April, 2025, Disney announced a strategic collaboration with a leading security infrastructure provider to deploy a new proprietary forensic watermarking system designed to track unauthorized leaks of premium theatrical releases in real time across the North American region.
- In March, 2025, Adobe Inc. expanded its enterprise security suite by integrating a new real time rights verification module that allows document owners to revoke access to shared PDFs even after they have been downloaded by external stakeholders.
- In January, 2025, Netflix announced a comprehensive update to its content delivery architecture to support a new proprietary encryption standard designed to reduce latency during the decryption process for mobile users globally.
Dive into Technavio’s robust research methodology, blending expert interviews, extensive data synthesis, and validated models for unparalleled Digital Rights Management Market insights. See full methodology.
| Market Scope | |
|---|---|
| Page number | 304 |
| Base year | 2025 |
| Historic period | 2020-2024 |
| Forecast period | 2026-2030 |
| Growth momentum & CAGR | Accelerate at a CAGR of 61.2% |
| Market growth 2026-2030 | USD 56911.3 million |
| Market structure | Fragmented |
| YoY growth 2025-2026(%) | 38.6% |
| Key countries | US, Canada, Mexico, Germany, UK, France, Italy, Spain, The Netherlands, China, Japan, India, South Korea, Australia, Indonesia, Brazil, Argentina, Chile, Saudi Arabia, UAE, South Africa, Israel and Turkey |
| Competitive landscape | Leading Companies, Market Positioning of Companies, Competitive Strategies, and Industry Risks |
Research Analyst Overview
- The market's evolution is driven by increasingly sophisticated technological underpinnings designed to counter modern piracy threats. Core to this is the use of robust content encryption standards and advanced digital watermarking techniques, including forensic watermarking and dynamic watermarking insertion, for asset traceability.
- Systems rely on a secure license delivery mechanism and multi-DRM strategies to manage access, governed by a detailed rights expression language and strict access control mechanisms. Security is being pushed to the hardware level through root-of-trust hardware, secure boot processes, and tamper-resistant hardware, ensuring a secure video path and robust output protection management.
- Authentication methods like token-based authentication are becoming standard. Inside the playback environment, the content decryption module and device binding policies are crucial. Technologies for anti-screen recording and stream ripping prevention are actively deployed. Operationally, a rights management server handles real-time rights verification and manages the license revocation list.
- This integrated approach has enabled organizations to achieve a 20% improvement in piracy detection efficiency. Ultimately, these systems ensure persistent content protection, secure media playback, and secure content storage.
What are the Key Data Covered in this Digital Rights Management Market Research and Growth Report?
-
What is the expected growth of the Digital Rights Management Market between 2026 and 2030?
-
USD 56.91 billion, at a CAGR of 61.2%
-
-
What segmentation does the market report cover?
-
The report is segmented by Deployment (On-premises, and Cloud), Component (Software, and Services), Application (Video content protection, Audio content protection, E-book protection, Software protection, and Others) and Geography (North America, Europe, APAC, South America, Middle East and Africa)
-
-
Which regions are analyzed in the report?
-
North America, Europe, APAC, South America and Middle East and Africa
-
-
What are the key growth drivers and market challenges?
-
Growing adoption of DRM solutions, Concerns over SLAs
-
-
Who are the major players in the Digital Rights Management Market?
-
Adobe Inc., Amazon Web Services Inc., Apple Inc., Broadcom Inc., Bynder B.V., Dell Technologies Inc., Google LLC, IBM Corp., Intertrust Technologies Corp., Irdeto B.V., Locklizard Ltd., Microsoft Corp., NextLabs Inc., Open Text Corp., Oracle Corp., Seclore Technology Pvt. Ltd., Sony Group Corp., Verimatrix Inc. and Vitrium Systems Inc.
-
Market Research Insights
- The market's dynamics are shaped by the dual imperatives of intellectual property protection and seamless content access. Effective digital asset management systems are reducing unauthorized file sharing by over 40% for corporate clients, directly impacting media and entertainment security.
- In the software sector, automated software license management tools have improved compliance tracking, cutting revenue leakage from unlicensed use by up to 15%. For streaming services, robust over-the-top (OTT) security and video-on-demand (VOD) protection frameworks are now essential.
- These systems balance strong encryption with user experience, with modern implementations showing 99.9% uptime, minimizing access disruptions for legitimate subscribers while deterring piracy.
We can help! Our analysts can customize this digital rights management market research report to meet your requirements.
 RIA -
RIA - 
