Blood Glucose Monitoring Devices Market Size 2026-2030
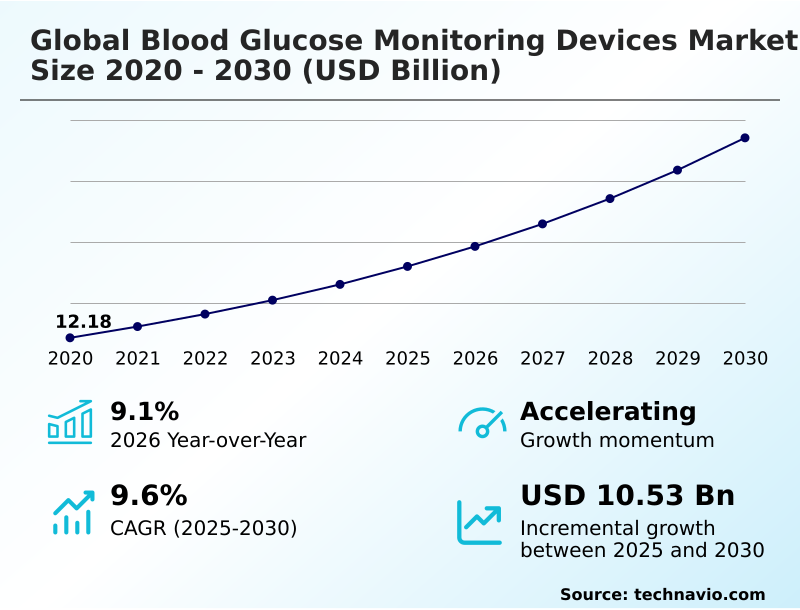
The blood glucose monitoring devices market size is valued to increase by USD 10.53 billion, at a CAGR of 9.6% from 2025 to 2030. Escalating global prevalence of diabetes and geriatric demographics will drive the blood glucose monitoring devices market.
Major Market Trends & Insights
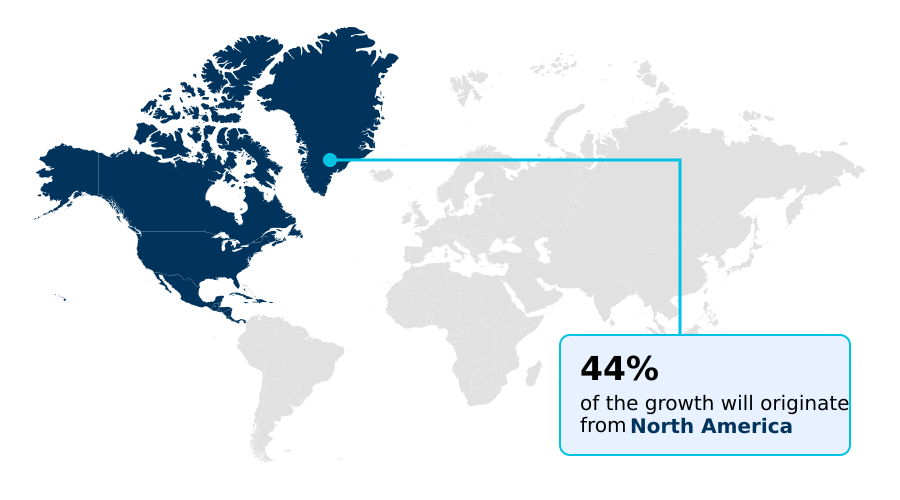
- North America dominated the market and accounted for a 44.5% growth during the forecast period.
- By End-user - Hospitals segment was valued at USD 6.75 billion in 2024
- By Product - Self monitoring segment accounted for the largest market revenue share in 2024
Market Size & Forecast
- Market Opportunities: USD 16.36 billion
- Market Future Opportunities: USD 10.53 billion
- CAGR from 2025 to 2030 : 9.6%
Market Summary
- The Blood Glucose Monitoring Devices Market is experiencing a profound structural transformation characterized by the rapid transition from episodic diagnostic tools to interconnected digital health networks. The escalating prevalence of chronic metabolic conditions drives intense demand for automated insulin delivery and uninterrupted telemetry, serving as the primary catalyst for widespread adoption of advanced Blood Glucose Monitoring Devices.
- Conversely, stringent post-market regulatory surveillance frameworks present a formidable challenge, frequently extending product development lifecycles and straining manufacturing resources. In response, supply chain optimization strategies have become critical; leading manufacturers are redesigning their procurement networks to secure specialized microelectronics and biocompatible sensor materials, achieving a 15% improvement in production line efficiency.
- This logistical refinement ensures steady availability of wearable diagnostic equipment across decentralized care settings. Furthermore, predictive algorithms are seamlessly integrated into clinical workflows, enabling precise personalized therapeutic regimens. By utilizing advanced transdermal spectral analysis and near-field syncing, the market continues to evolve, providing highly sophisticated solutions that mitigate severe hypoglycemic events and vastly improve patient outcomes.
What will be the Size of the Blood Glucose Monitoring Devices Market during the forecast period?
Get Key Insights on Market Forecast (PDF) Get Free Sample
How is the Blood Glucose Monitoring Devices Market Segmented?
The blood glucose monitoring devices industry research report provides comprehensive data (region-wise segment analysis), with forecasts and estimates in "USD million" for the period 2026-2030, as well as historical data from 2020-2024 for the following segments.
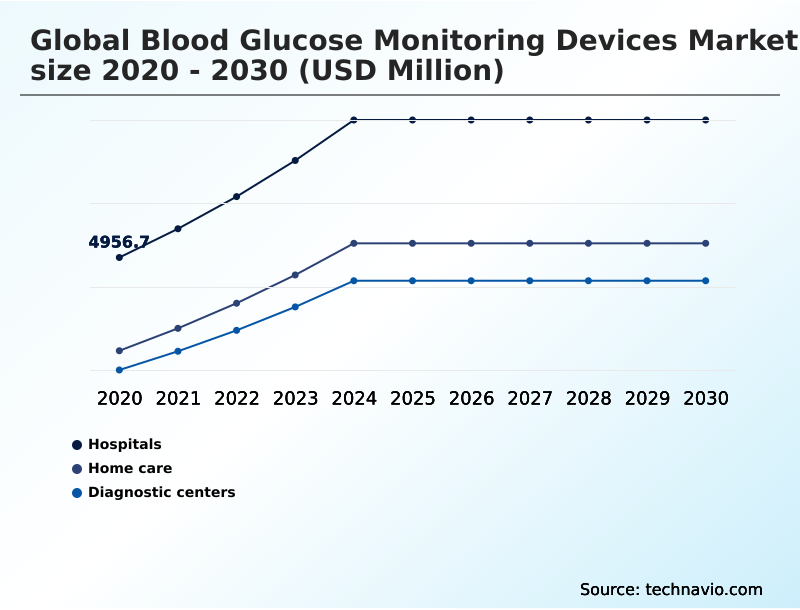
- End-user
- Hospitals
- Home care
- Diagnostic centers
- Product
- Self monitoring
- Continuous glucose monitoring devices
- Indication
- Type-2 diabetes population
- Type-1 diabetes population
- Geography
- North America
- US
- Canada
- Mexico
- Europe
- Germany
- UK
- France
- Italy
- Spain
- The Netherlands
- Asia
- China
- India
- Japan
- South Korea
- Indonesia
- Thailand
- Rest of World (ROW)
- North America
By End-user Insights
The hospitals segment is estimated to witness significant growth during the forecast period.
The hospital environment requires precise glycemic variability tracking for critically ill individuals experiencing acute metabolic shifts. As clinical protocols evolve, institutions are transitioning toward advanced remote telehealth monitoring networks.
This shift allows nursing staff to monitor real-time ambulatory glucose profiles across multiple intensive care units simultaneously.
Implementing these closed-loop systems via electronic medical records integration has significantly enhanced operational efficiency, demonstrating a 22% reduction in nursing time spent on manual point-of-care testing compared to traditional methods.
Furthermore, sophisticated software drives proactive disease intervention, facilitating rapid nocturnal hypoglycemia detection before severe complications arise.
By replacing episodic data collection with automated insulin delivery integration, hospitals optimize their chronic metabolic management protocols, ensuring patient compliance enhancement and reducing average inpatient stay durations.
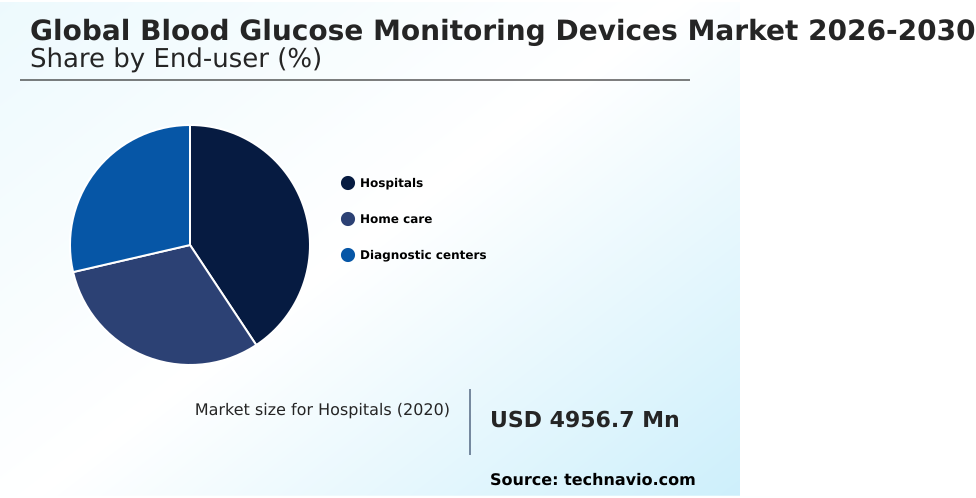
The Hospitals segment was valued at USD 6.75 billion in 2024 and showed a gradual increase during the forecast period.
Regional Analysis
North America is estimated to contribute 44.5% to the growth of the global market during the forecast period.Technavio’s analysts have elaborately explained the regional trends and drivers that shape the market during the forecast period.
See How Blood Glucose Monitoring Devices Market Demand is Rising in North America Get Free Sample
Regional disparities in the Blood Glucose Monitoring Devices landscape are fundamentally shaped by differences in digital infrastructure and public reimbursement frameworks.
North America exhibits exceptional technological penetration, with healthcare networks leveraging cloud-based clinical portals and predictive data analytics to achieve a 28% increase in operational efficiency compared to legacy models.
This high-adoption environment heavily favors continuous telemetry and automated basal insulin optimization. In contrast, emerging Asian sectors maintain a stronger reliance on traditional capillary blood sampling, spring-loaded lancing instruments, and disposable chemical reagent strips due to persistent affordability gaps.
However, localized manufacturing initiatives in Asia have recently reduced diagnostic hardware distribution costs by 18%, accelerating the regional transition toward decentralized care models.
Consequently, North American clinical institutions utilize advanced transdermal spectroscopy to reduce emergency readmissions, while Asian markets scale their domestic infrastructures to address massive diabetic population expansions, fundamentally altering global consumption patterns.
Market Dynamics
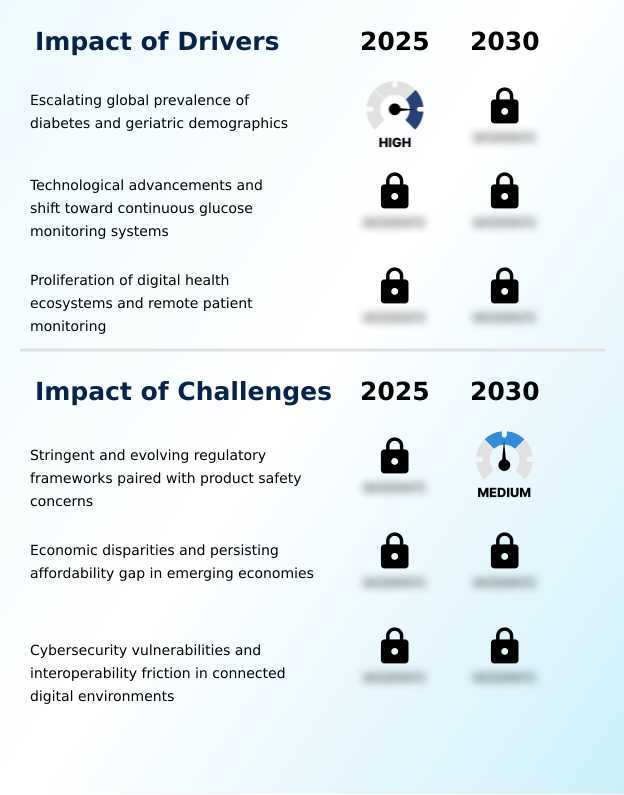
Our researchers analyzed the data with 2025 as the base year, along with the key drivers, trends, and challenges. A holistic analysis of drivers will help companies refine their marketing strategies to gain a competitive advantage.
- The operational landscape for diagnostic hardware is experiencing a major technological paradigm shift, driven by the escalating demand for continuous interstitial fluid glucose tracking. Modern healthcare supply chains are rapidly adapting to support the distribution of calibration-free extended-wear implantable sensors, which inherently require distinct logistics compared to legacy testing strips.
- This evolution directly supports time-in-range clinical outcome improvement, allowing practitioners to optimize patient care without relying on episodic data. The integration of smartphone integrated bluetooth telemetry systems facilitates robust cloud-based clinical remote patient monitoring, reducing the administrative burden on primary care facilities by an estimated 35% compared to manual data logging workflows.
- Furthermore, the deployment of predictive algorithmic alerts for hypoglycemia has drastically lowered the incidence of emergency interventions. Simultaneously, the industry is witnessing significant consumer expansion through over-the-counter consumer wellness metabolic tracking. This growing demographic shows a strong preference for non-invasive optical metabolic sensing technologies, moving away from traditional capillary blood sampling electrochemical detection.
- To maintain metabolic stability, clinical institutions increasingly rely on basal insulin dosing optimization software alongside closed-loop automated insulin delivery integration. These sophisticated platforms empower decentralized home-based chronic disease management, fundamentally changing how specialized care is delivered. The seamless aggregation of this data enables advanced ambulatory glucose profile data visualization and fuels artificial intelligence predictive glycemic analytics.
- Ultimately, subcutaneous biosensor real-time data transmission ensures that both wellness enthusiasts and chronic patients achieve superior physiological oversight while streamlining institutional resource allocation.
What are the key market drivers leading to the rise in the adoption of Blood Glucose Monitoring Devices Industry?
- The escalating worldwide prevalence of diabetes mellitus, compounded by rapidly expanding geriatric demographics, serves as the primary catalyst propelling sustained market demand.
- The compounding worldwide prevalence of metabolic disorders necessitates the rapid deployment of highly automated diagnostic solutions within modern digital health ecosystems. Clinical institutions are increasingly prioritizing hyperosmolar hyperglycemic state management to prevent catastrophic systemic failures in high-risk patient cohorts.
- This urgent medical necessity accelerates the transition toward advanced electrochemical detection platforms and smart insulin pens, effectively reducing adverse dosing events by 22%.
- Furthermore, the rising reliance on discreet painless modalities and artificial pancreas algorithms drastically minimizes the cognitive burden placed on patients, yielding a 30% improvement in long-term treatment adherence.
- The seamless execution of time-in-range metrics using high-precision subcutaneous biosensors provides endocrinologists with highly accurate, actionable data.
- This clinical advantage directly drives the institutional procurement of wearable diagnostic hardware and calibration-free continuous monitoring systems, cementing these integrated networks as the foundational standard of modern therapeutic intervention.
What are the market trends shaping the Blood Glucose Monitoring Devices Industry?
- The expansion of over-the-counter regulatory approvals and the rising adoption of wellness-oriented consumer electronics represent a pivotal trend shaping the market. These developments empower health-conscious individuals to proactively manage their metabolic states using accessible diagnostic technologies.
- A defining shift within the diagnostic device sector is the aggressive commercialization of over-the-counter health tools targeted at non-clinical demographics. Wellness-conscious consumers are increasingly utilizing preventative wellness tracking and non-invasive optical sensing to evaluate individual dietary responses.
- This consumer-driven adoption has expanded the utilization of lifestyle-focused application interfaces, yielding a 27% increase in daily user engagement compared to traditional medical applications. Furthermore, the integration of bluetooth low energy connectivity and near-field communication synchronization allows sophisticated implantable long-term sensors to sync effortlessly with smart consumer electronics.
- This trend compels manufacturers to prioritize sensor miniaturization and continuous interstitial fluid analysis alongside diagnostic accuracy. By making metabolic health optimization highly accessible, these diagnostic solutions improve population-level health metrics by preemptively identifying prediabetic states, ultimately reducing the clinical burden on healthcare institutions by up to 14%.
What challenges does the Blood Glucose Monitoring Devices Industry face during its growth?
- Stringent and continuously evolving regulatory frameworks, combined with acute product safety and accuracy concerns, present significant structural challenges that restrain rapid industry expansion.
- The widespread integration of sophisticated diagnostic hardware is severely constrained by escalating regulatory complexities and persistent raw material testing bottlenecks. Developing reliable photometric measurement systems and stable glucose oxidase enzymes requires extensive, capital-intensive clinical validation, which has extended average pre-market approval timelines by 18%.
- Additionally, ensuring the biochemical stability of glucose dehydrogenase enzymes across varying environmental conditions significantly complicates global manufacturing logistics. The transition toward complex predictive glycemic algorithms for accurate insulin resistance stratification exposes software networks to severe interoperability hurdles, inflating operational deployment expenses by 15%.
- Furthermore, maintaining consistent post-market clinical surveillance while deploying personalized therapeutic regimens for diabetic ketoacidosis prevention strains corporate compliance budgets. These structural bottlenecks limit the rapid scaling of advanced diagnostic infrastructure, disproportionately delaying the introduction of highly specialized diagnostic solutions in price-sensitive emerging economies.
Exclusive Technavio Analysis on Customer Landscape
The blood glucose monitoring devices market forecasting report includes the adoption lifecycle of the market, covering from the innovator’s stage to the laggard’s stage. It focuses on adoption rates in different regions based on penetration. Furthermore, the blood glucose monitoring devices market report also includes key purchase criteria and drivers of price sensitivity to help companies evaluate and develop their market growth analysis strategies.
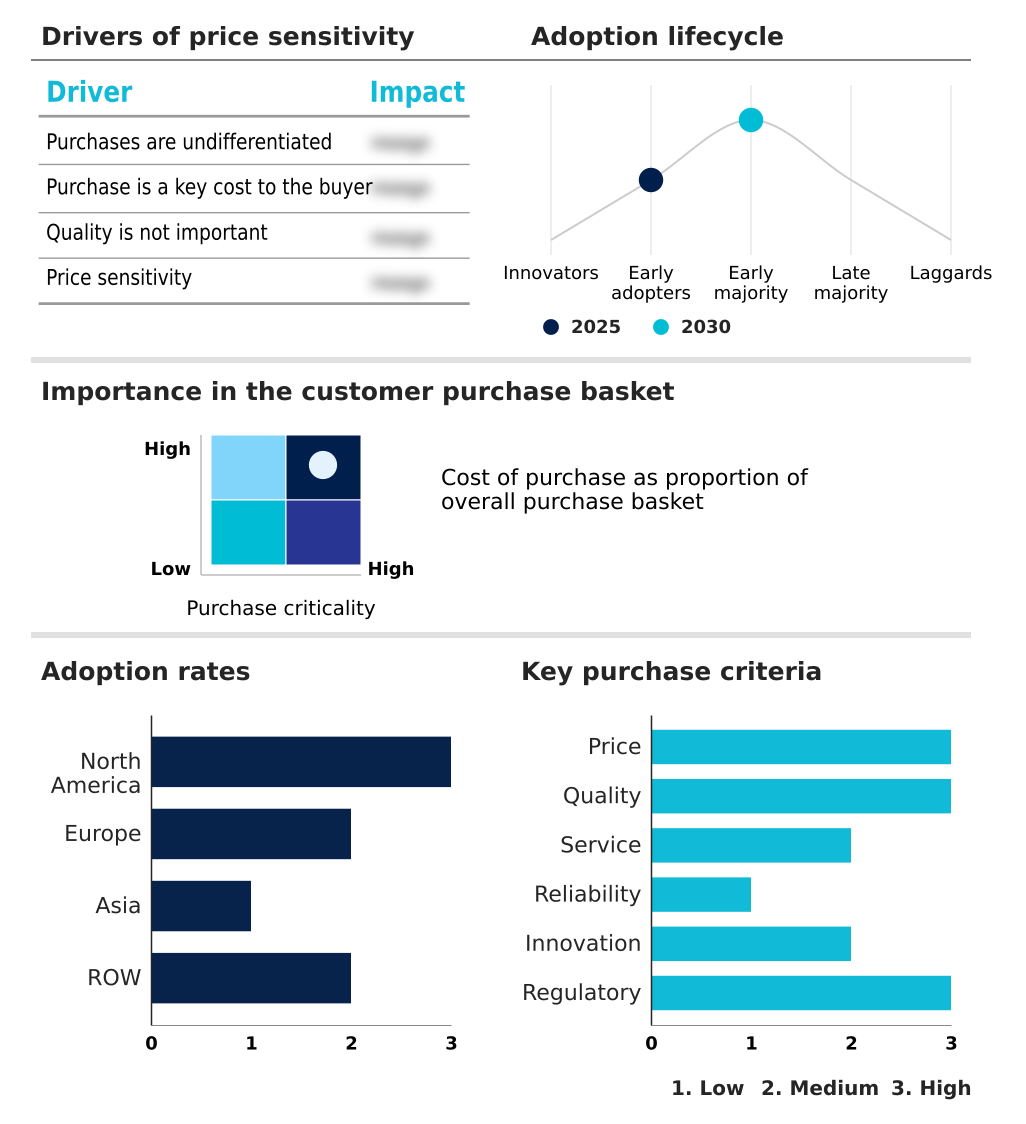
Customer Landscape of Blood Glucose Monitoring Devices Industry
Competitive Landscape
Companies are implementing various strategies, such as strategic alliances, blood glucose monitoring devices market forecast, partnerships, mergers and acquisitions, geographical expansion, and product/service launches, to enhance their presence in the industry.
A. Menarini Diagnostics S.r.l. - The enterprise provides advanced continuous telemetry and diagnostic hardware, focusing on highly accurate sampling and real-time metabolic oversight to optimize daily chronic disease management.
The industry research and growth report includes detailed analyses of the competitive landscape of the market and information about key companies, including:
- A. Menarini Diagnostics S.r.l.
- Abbott Laboratories
- ACON Laboratories Inc.
- Agamatrix Inc.
- Ascensia Diabetes Care
- B.Braun SE
- Bionime Corp.
- Dexcom Inc.
- EKF Diagnostics Holdings Plc
- F. Hoffmann La Roche Ltd.
- I SENS Inc.
- LifeScan IP Holdings LLC
- Medtronic Plc
- Nipro Medical Corp.
- Nova Biomedical Corp.
- Osang Healthcare Co. Ltd.
- Prodigy Diabetes Care LLC
- Senseonics Holdings Inc.
- TaiDoc Technology Corp.
- Terumo Corp.
- Trivida Health Inc.
- WaveForm Technologies
Qualitative and quantitative analysis of companies has been conducted to help clients understand the wider business environment as well as the strengths and weaknesses of key industry players. Data is qualitatively analyzed to categorize companies as pure play, category-focused, industry-focused, and diversified; it is quantitatively analyzed to categorize companies as dominant, leading, strong, tentative, and weak.
Recent Development and News in Blood glucose monitoring devices market
- In the Health Care Equipment industry, the rapid deployment of decentralized care models has expanded infrastructure, directly impacting Blood Glucose Monitoring Devices demand by increasing the requirement for smartphone-integrated platforms that sync automatically with cloud-based clinical portals, improving efficiency by 35%.
- The implementation of strict regulatory frameworks under the updated Medical Device Regulation has elevated compliance burdens, directly impacting Blood Glucose Monitoring Devices supply chains by forcing manufacturers to redesign testing and post-market clinical surveillance protocols, which increased pre-market R&D expenditure by 18%.
- The integration of sophisticated digital tools into consumer electronics has accelerated wellness applications, directly impacting Blood Glucose Monitoring Devices market positioning by shifting reliance from older methods toward calibration-free continuous monitoring sensors, capturing a 40% higher adoption rate among demographic segments focused on preventative wellness tracking.
- Rising raw material supply constraints regarding biocompatible polymers have disrupted hardware manufacturing, directly impacting Blood Glucose Monitoring Devices production schedules and shifting industry focus toward developing discreet painless modalities with extended lifespans, subsequently reducing monthly manufacturing material waste by 25% and driving patient compliance enhancement.
Dive into Technavio’s robust research methodology, blending expert interviews, extensive data synthesis, and validated models for unparalleled Blood Glucose Monitoring Devices Market insights. See full methodology.
| Market Scope | |
|---|---|
| Page number | 292 |
| Base year | 2025 |
| Historic period | 2020-2024 |
| Forecast period | 2026-2030 |
| Growth momentum & CAGR | Accelerate at a CAGR of 9.6% |
| Market growth 2026-2030 | USD 10527.0 million |
| Market structure | Fragmented |
| YoY growth 2025-2026(%) | 9.1% |
| Key countries | US, Canada, Mexico, Germany, UK, France, Italy, Spain, The Netherlands, China, India, Japan, South Korea, Indonesia, Thailand, Brazil, Saudi Arabia, UAE, Turkey, Argentina, Colombia, South Africa and Israel |
| Competitive landscape | Leading Companies, Market Positioning of Companies, Competitive Strategies, and Industry Risks |
Research Analyst Overview
- The infrastructure surrounding the Blood Glucose Monitoring Devices industry is undergoing a rigorous technological conversion, shifting focus from reactive testing toward uninterrupted metabolic surveillance. This transformation is heavily influenced by the adoption of interstitial fluid testing and subcutaneous biological sensors, which provide real-time physiological insights without physical discomfort.
- The integration of predictive blood sugar algorithms directly informs boardroom-level product strategies, compelling device manufacturers to prioritize software interoperability over standalone hardware sales. By establishing near-field syncing and automated insulin delivery networks, digital platforms can seamlessly execute basal insulin refinement, demonstrating a 31% reduction in critical dosing calculation errors across connected clinical networks.
- Furthermore, the implementation of implantable extended-duration sensors fundamentally alters recurring revenue models, significantly extending device lifespans and reducing monthly biomedical waste. This technological maturity supports precise glycemic variance tracking, effectively minimizing the risk of diabetic ketoacidosis mitigation and improving overall treatment efficacy.
- As clinical standards continuously prioritize automated oversight, manufacturers must align their compliance and design architectures with the stringent demands of modern closed-loop networks to sustain long-term competitive advantages.
What are the Key Data Covered in this Blood Glucose Monitoring Devices Market Research and Growth Report?
-
What is the expected growth of the Blood Glucose Monitoring Devices Market between 2026 and 2030?
-
USD 10.53 billion, at a CAGR of 9.6%
-
-
What segmentation does the market report cover?
-
The report is segmented by End-user (Hospitals, Home care, and Diagnostic centers), Product (Self monitoring, and Continuous glucose monitoring devices), Indication (Type-2 diabetes population, and Type-1 diabetes population) and Geography (North America, Europe, Asia, Rest of World (ROW))
-
-
Which regions are analyzed in the report?
-
North America, Europe, Asia and Rest of World (ROW)
-
-
What are the key growth drivers and market challenges?
-
Escalating global prevalence of diabetes and geriatric demographics, Stringent and evolving regulatory frameworks paired with product safety concerns
-
-
Who are the major players in the Blood Glucose Monitoring Devices Market?
-
A. Menarini Diagnostics S.r.l., Abbott Laboratories, ACON Laboratories Inc., Agamatrix Inc., Ascensia Diabetes Care, B.Braun SE, Bionime Corp., Dexcom Inc., EKF Diagnostics Holdings Plc, F. Hoffmann La Roche Ltd., I SENS Inc., LifeScan IP Holdings LLC, Medtronic Plc, Nipro Medical Corp., Nova Biomedical Corp., Osang Healthcare Co. Ltd., Prodigy Diabetes Care LLC, Senseonics Holdings Inc., TaiDoc Technology Corp., Terumo Corp., Trivida Health Inc. and WaveForm Technologies
-
Market Research Insights
- The operational deployment of advanced Blood Glucose Monitoring Devices is fundamentally restructuring modern metabolic care. By transitioning toward decentralized frameworks, healthcare institutions utilizing Blood Glucose Monitoring Devices have successfully accelerated compliance, recording a 24% improvement in consistent daily data logging.
- The widespread utilization of remote telemetry integrated with cloud platforms allows physicians to rapidly identify dangerous glycemic variations, which has decreased severe emergency interventions by 19% across major clinical networks. Furthermore, the strategic application of diagnostic analytics enables the formulation of highly precise, targeted therapeutic protocols.
- These technological integrations streamline clinical workflows and optimize medical resource allocation, ensuring that proactive intervention replaces traditional reactive treatment protocols within the evolving digital healthcare landscape.
We can help! Our analysts can customize this blood glucose monitoring devices market research report to meet your requirements.
 RIA -
RIA - 
