Bone Densitometer Market Analysis North America, Europe, Asia, Rest of World (ROW) - US, UK, Germany, China, Japan - Size and Forecast 2024-2028

Bone Densitometer Market Analysis North America, Europe, Asia, Rest of World (ROW) - US, UK, Germany, China, Japan - Size and Forecast 2024-2028

Published: May 2024 163 Pages SKU: IRTNTR77911

Market Overview at a Glance

$80.51 Mn
Market Opportunity
4.67%
CAGR
4.23
YoY growth 2023-2024(%)

Bone Densitometer Market Size 2024-2028 

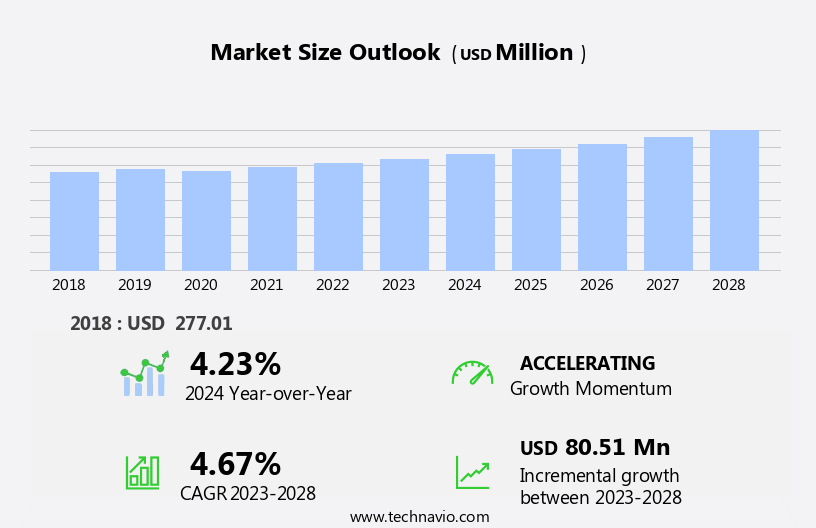
The bone densitometer market size is forecast to increase by USD 80.51 billion at a CAGR of 4.67% between 2023 and 2028.

  • The market is experiencing significant growth due to several key trends. The rising prevalence of osteoporosis, particularly among the geriatric population worldwide, is driving market demand. Additionally, the increasing preference for point-of-care (POC) testing is contributing to market growth. However, the high cost of bone densitometers remains a major challenge for market expansion. Despite this, advancements in technology and increasing awareness about the importance of early diagnosis and treatment of osteoporosis are expected to provide opportunities for market growth. Overall, the market is poised for steady growth In the coming years.

What will be the Size of the Bone Densitometer Market During the Forecast Period?

Bone Densitometer Market Size

 Request Free Sample

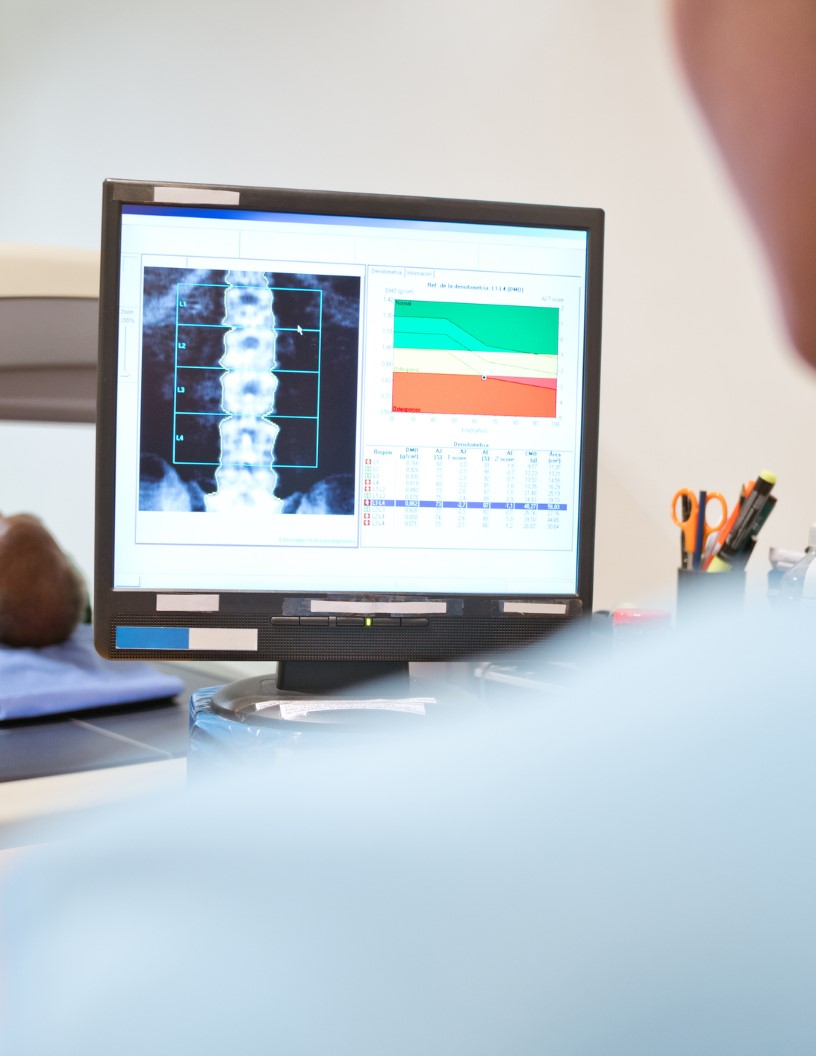
  • The market In the US is witnessing significant growth due to the increasing prevalence of bone disorders such as osteoporosis, osteopenia, osteomalacia, and osteoarthritis among the geriatric population. These conditions, characterized by weakened bones and increased risk of fractures, are a major health concern for older adults. Bone densitometry, also known as osteodensitometry, is a medical imaging technique used to measure bone density and assess bone health. DXA scanners and axial bone densitometers are the most commonly used bone densitometer types in clinical settings. The rising awareness of the importance of preventive measures for bone health, as well as the increasing incidence of osteoporotic fractures, hip fractures, and other age-related bone disorders, are key drivers fueling market expansion.
  • Additionally, the growing prevalence of kidney disease, which can lead to bone loss, is also contributing to market growth.

How is this Bone Densitometer Industry segmented and which is the largest segment?

The  bone densitometer industry research report provides comprehensive data (region-wise segment analysis), with forecasts and estimates in "USD million" for the period 2024-2028, as well as historical data from 2018-2022 for the following segments.
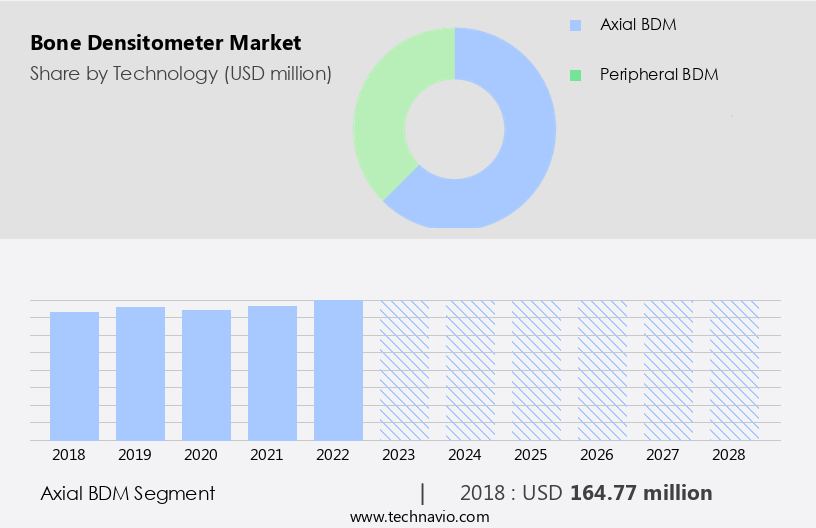
  • Technology
    • Axial BDM
    • Peripheral BDM
  • End-user
    • Hospitals
    • Specialty clinics
    • Diagnostic and imaging centers
  • Geography
    • North America
      • US
    • Europe
      • Germany
      • UK
    • Asia
      • China
      • Japan
    • Rest of World (ROW)

    By Technology Insights

    • The axial bdm segment is estimated to witness significant growth during the forecast period.

    Axial bone densitometry (BDM) technology plays a significant role In the global market for bone densitometers. Utilizing DEXA as its primary method, axial BDM provides precise assessments of bone mineral density (BMD) in critical areas, such as the spine and hip, which are most susceptible to osteoporosis-related fractures. DEXA is widely accepted as the diagnostic standard for osteoporosis and assessing fracture risks. The demand for axial BDM technology is fueled by the rising incidence of osteoporosis and related bone disorders, particularly among older adults. Early detection and effective management of bone health are crucial for preventing fractures and associated complications.

    The precision of axial BDM technology enables healthcare professionals to develop preventive measures and treatment strategies tailored to individual patients.

    Bone Densitometer Market Size

    Get a glance at the  Bone Densitometer Industry report of share of various segments Request Free Sample

    The Axial BDM segment was valued at USD 164.77 billion in 2018 and showed a gradual increase during the forecast period.

    Regional Analysis

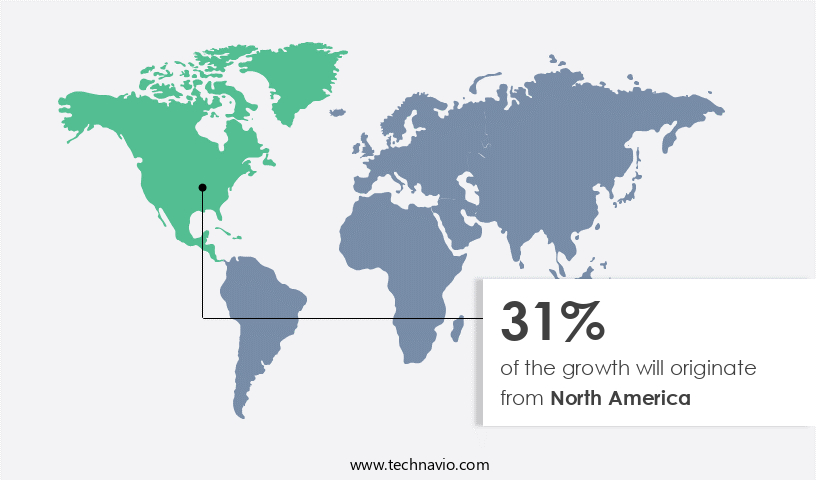
    • North America is estimated to contribute 31% to the growth of the global market during the forecast period.

    Technavio’s analysts have elaborately explained the regional trends and drivers that shape the market during the forecast period.

    Bone Densitometer Market Share by Geography

    For more insights on the market share of various regions, Request Free Sample

    The North American the market is experiencing significant growth due to the rising incidence of osteoporosis, osteomalacia, and osteoarthritis, as well as the increasing prevalence of aging and kidney disease. According to the National Osteoporosis Foundation, approximately 10 million Americans have osteoporosis, and an additional 44 million are at risk due to low bone density. This demographic trend highlights the importance of early bone health detection and monitoring, leading to increased demand for bone densitometry technology in healthcare facilities across North America. Advancements in medical imaging technology further contribute to market growth. The growing number of cases of osteoporotic fractures, including hip fractures, is another significant factor driving market expansion.

    This trend is expected to continue as the population ages and the prevalence of related conditions increases.

    Market Dynamics

    Our bone densitometer market researchers analyzed the data with 2023 as the base year, along with the key drivers, trends, and challenges. A holistic analysis of drivers will help companies refine their marketing strategies to gain a competitive advantage.

    What are the key market drivers leading to the rise in adoption of Bone Densitometer Industry?

    Rising prevalence of osteoporosis due to growing geriatric population worldwide is the key driver of the market.

    • The market is experiencing significant growth due to the increasing incidence of osteoporosis and the expanding geriatric population. Osteoporosis, a condition characterized by low bone density and strength, affects an estimated 200 million people worldwide, with postmenopausal women and older adults being the most susceptible. One in three women over the age of 50 and one in five men over the age of 50 are at risk of osteoporosis-related fractures. The geriatric population is also on the rise, with the world's demographic landscape skewing toward older age groups. Bone densitometers are essential medical devices used to measure bone density and assess bone health.
    • These devices play a crucial role in diagnosing and monitoring bone disorders, including osteoporosis, osteopenia, osteomalacia, and osteoarthritis. They are also used In the diagnosis of conditions such as cystic fibrosis and rheumatoid arthritis. Bone densitometers come in various forms, including dual-energy X-ray absorptiometry (DXA) scanners, ultrasonic densitometers, digital detectors, and quantitative ultrasound (QUS). DXA scanners are the most common type of bone densitometer and are used to measure bone density In the hip, spine, and forearm. Portable bone densitometers are also available, making bone health assessment more accessible. The market for bone densitometers is driven by the need for preventive measures and treatment strategies for bone disorders.
    • The high risk of fractures associated with osteoporosis and the increasing cancer incidence, particularly in older adults, are significant factors driving market growth. Additionally, the rising prevalence of kidney disease and the importance of preventive healthcare have led to an increase in routine bone density checks. Bone densitometers are used in various healthcare settings, including hospitals, clinics, and specialty centers. The market for bone densitometers is expected to continue growing due to the increasing awareness of bone health and the availability of refurbished devices, making these essential medical devices more affordable. In conclusion, The market is experiencing significant growth due to the increasing incidence of osteoporosis, the expanding geriatric population, and the importance of preventive healthcare.

    What are the market trends shaping the Bone Densitometer Industry?

    Rising demand for point-of-care (POC) testing is the upcoming market trend.

    • The market In the US is experiencing significant growth due to the increasing preference for point-of-care (POC) testing solutions. Traditionally, bone densitometry tests were conducted in specialized clinics or hospitals, necessitating patients to travel long distances for assessments. However, the importance of convenience and accessibility in healthcare delivery is gaining recognition, leading to a shift towards POC testing. Portable and handheld bone densitometry devices offer several advantages over traditional clinic-based testing. These devices enable bone density assessments to be performed at the patient's bedside, in primary care offices, pharmacies, or even in community health centers. The geriatric population, who are at a higher risk of bone disorders such as osteoporosis and fractures, can benefit significantly from these devices' accessibility.
    • Bone densitometry is essential for diagnosing and monitoring bone health conditions such as osteoporosis, osteopenia, osteomalacia, and osteoarthritis. These conditions are prevalent in older adults, and their incidence increases with age, making preventive measures and treatment strategies crucial. Vitamin D deficiency, a common risk factor for bone disorders, can also be identified through bone densitometry tests. Bone densitometry devices are used in various medical facilities, including hospitals, clinics, and specialty centers. They are also used for diagnosing conditions such as cystic fibrosis and rheumatoid arthritis. In addition, these devices are used for cancer cells diagnosis, body composition measurement, and monitoring the effectiveness of treatment plans.
    • The market for bone densitometry devices includes various types of medical devices, such as ultrasonic densitometers, digital detectors, computer-assisted densitometers, and radiographic absorptiometry (RA) scanners. Some of the popular brands include AccuDexa bone densitometer, Axial bone densitometers, and portable bone densitometers. The market for bone densitometry devices is expected to grow due to the rising incidence of osteoporosis and fractures, especially In the geriatric population. The increasing awareness of preventive healthcare and the availability of refurbished devices at affordable prices are also contributing to the market's growth. Quantitative ultrasound (QUS) and radiographic absorptiometry (RA) are the two primary techniques used in bone densitometry.
    • QUS measures bone density by analyzing the speed of sound waves passing through the bone, while RA measures bone density by analyzing the amount of X-rays absorbed by the bone. Both techniques have their advantages and are used depending on the specific application and patient needs. In conclusion, the market In the US is experiencing significant growth due to the increasing demand for point-of-care testing solutions, the rising incidence of bone disorders, and the availability of various types of bone densitometry devices. These devices offer several advantages over traditional clinic-based testing, including convenience, accessibility, and affordability. The market is expected to continue growing due to the increasing awareness of preventive healthcare and the availability of refurbished devices at affordable prices.

    What challenges does Bone Densitometer Industry face during the growth?

    High cost of bone densitometers is a key challenge affecting the industry growth.

    • The market faces a notable challenge due to the high cost of these medical devices. Bone densitometers are essential tools for diagnosing bone disorders, including osteoporosis, which affects older adults and increases the risk of fractures. These conditions are prevalent among the geriatric population, with an estimated incidence of osteoporosis being over 53 million In the US alone. Bone densitometers use various technologies, such as Dual-energy X-ray absorptiometry (DXA), ultrasonic densitometers, and quantitative ultrasound (QUS), to measure bone density and strength. DXA scanners are the most commonly used bone densitometers, with prices ranging from USD16,000 to USD45,000 for new models.
    • Refurbished units offer a more affordable alternative, costing between USD5,000 and USD25,500. However, even refurbished devices require a significant investment. The high cost of bone densitometers is a significant barrier to widespread adoption, particularly in developing regions and specialty centers. The initial investment for these devices, along with ongoing maintenance and replacement costs for components like X-ray tubes, can add up to a substantial financial burden. Despite these challenges, bone densitometers remain crucial for preventive healthcare, treatment planning, and monitoring bone health in older adults and those at risk of bone disorders, including osteoporosis, osteopenia, osteomalacia, osteoarthritis, and osteoporotic fractures.
    • Bone densitometers are also used for diagnosing other conditions, such as cystic fibrosis and rheumatoid arthritis, and for measuring body composition. These devices are used in hospitals, clinics, and other medical facilities, including diagnostic and imaging centers. In the US, Medicare covers bone densitometry services for certain individuals, making these tests more accessible to some populations. However, the high cost of bone densitometers remains a significant barrier to widespread adoption, particularly in developing regions and specialty centers.

    Exclusive Customer Landscape

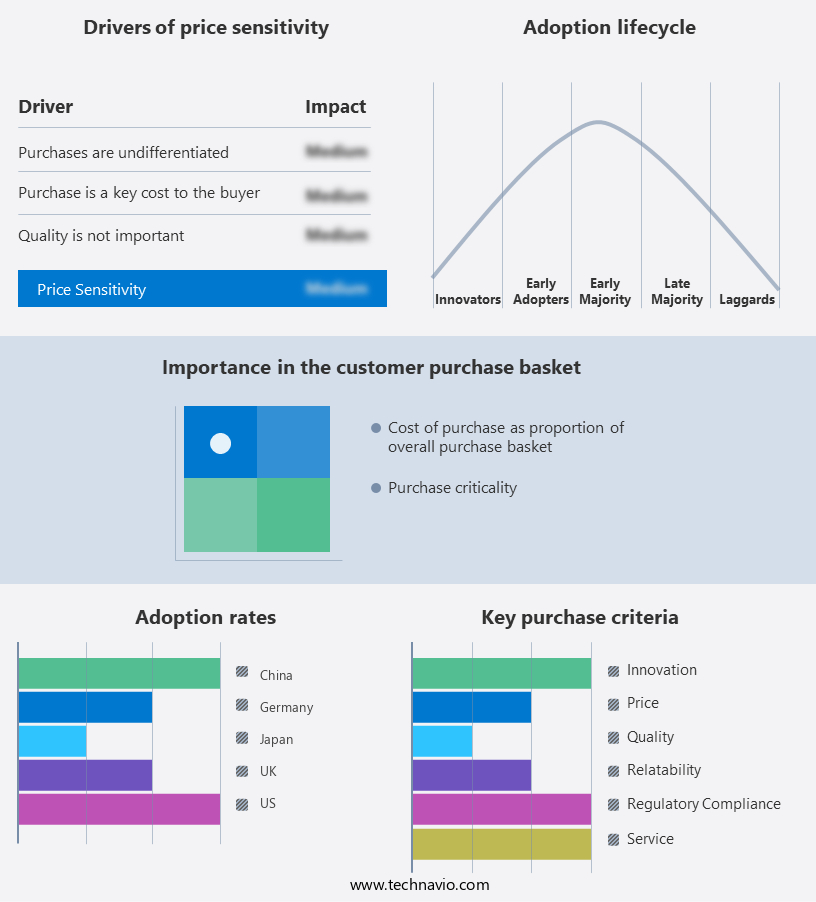
    The bone densitometer market forecasting report includes the adoption lifecycle of the market, covering from the innovator’s stage to the laggard’s stage. It focuses on adoption rates in different regions based on penetration. Furthermore, the bone densitometer market report also includes key purchase criteria and drivers of price sensitivity to help companies evaluate and develop their market growth analysis strategies.

    Bone Densitometer Market Share by Geography

     Customer Landscape

    Key Companies & Market Insights

    Companies are implementing various strategies, such as strategic alliances, bone densitometer market forecast, partnerships, mergers and acquisitions, geographical expansion, and product/service launches, to enhance their presence In the industry.

    Aarna Systems And Wellness Pvt. Ltd. - Our company provides a range of advanced bone densitometry solutions for medical professionals In the US market. These include DEXA (Dual-energy X-ray Absorptiometry) Bone Densitometers, Ultrasound Bone Densitometers, BMD (Bone Mineral Density) Machines, and Portable Bone Densitometers. These technologies enable accurate assessment of bone health and density, aiding In the early detection and diagnosis of conditions such as osteoporosis. Our commitment to innovation and quality ensures that our bone densitometers meet the highest industry standards.

    The industry research and growth report includes detailed analyses of the competitive landscape of the market and information about key companies, including:

    • Aarna Systems And Wellness Pvt. Ltd.
    • BeamMed Ltd.
    • BMTech Co. Ltd.
    • CompuMed Inc.
    • CyberLogic inc.
    • Demetech AB
    • Dentsply Sirona Inc.
    • Echolight SpA
    • Eurotec Medical Systems s.r.l.
    • Furuno Electric Co. Ltd.
    • GE Healthcare Technologies Inc.
    • Hologic Inc.
    • Koninklijke DSM NV
    • Medonica Co. Ltd.
    • Osteosys Corp.
    • Scanflex Healthcare AB
    • Shenzhen Aikerui Electric Co. Ltd.
    • Swissray International Inc.
    • Trivitron Healthcare
    • Anjue Medical Equipment Co. Ltd.

    Qualitative and quantitative analysis of companies has been conducted to help clients understand the wider business environment as well as the strengths and weaknesses of key industry players. Data is qualitatively analyzed to categorize companies as pure play, category-focused, industry-focused, and diversified; it is quantitatively analyzed to categorize companies as dominant, leading, strong, tentative, and weak.

    Research Analyst Overview

    Understanding the Dynamics of the market the market represents a significant segment of the medical device industry, catering to the growing demand for tools that assess bone density and strength. This market is driven by the increasing prevalence of bone disorders, particularly osteoporosis, and the need for effective preventive measures and treatment strategies. Bone densitometry is a crucial diagnostic tool for evaluating bone health, particularly in older adults. The geriatric population is at a higher risk of developing bone disorders due to age-related bone loss and other factors. Osteoporosis, a condition characterized by low bone density and increased risk of fractures, affects millions of people worldwide.

    Bone densitometry plays a vital role In the diagnosis and monitoring of osteoporosis. The technology uses various methods, such as dual energy X-ray absorptiometry (DXA) and quantitative ultrasound (QUS), to measure bone density and assess bone health. DXA scanners are the most commonly used bone densitometry devices, providing accurate measurements of bone density In the hip and spine. Preventive healthcare is a growing trend In the market, with routine checks becoming increasingly important for early detection and intervention. Medicaid and Medicare, among other healthcare programs, cover bone densitometry tests for eligible individuals, making it an accessible and essential diagnostic tool.

    The market for bone densitometers is diverse, with various types of devices catering to different needs. Portable bone densitometers offer convenience and mobility, making them suitable for use in specialty centers and diagnostic & imaging centers. Axial bone densitometers, such as the AccuDexa bone densitometer, measure bone density In the axial skeleton, while peripheral bone densitometers assess bone density In the arms and legs. The use of bone densitometry extends beyond the diagnosis and monitoring of osteoporosis. These devices are also used In the diagnosis of other bone disorders, such as osteopenia, cystic fibrosis, rheumatoid arthritis, and certain types of cancer.

    Additionally, bone densitometry is used for body composition measurement and the assessment of bone loss in individuals with kidney disease or those undergoing orthopaedic procedures. The market is expected to grow significantly due to the increasing incidence of osteoporosis and other bone disorders. Factors contributing to this growth include an aging population, the rising prevalence of vitamin D deficiency, and the need for effective treatment planning and monitoring. In conclusion, the market is a dynamic and growing segment of the medical device industry. These devices play a crucial role In the diagnosis, monitoring, and treatment of various bone disorders, making them an essential tool for healthcare providers and patients alike.

    The market is diverse, with various types of bone densitometers catering to different needs and applications. The growing trend towards preventive healthcare and the increasing incidence of bone disorders are expected to drive the growth of the market In the coming years.

    Bone Densitometer Market Scope

    Report Coverage

    Details

    Page number

    163

    Base year

    2023

    Historic period

    2018-2022

    Forecast period

    2024-2028

    Growth momentum & CAGR

    Accelerate at a CAGR of 4.67%

    Market growth 2024-2028

    USD 80.51 million

    Market structure

    Fragmented

    YoY growth 2023-2024(%)

    4.23

    Key countries

    US, UK, Germany, China, and Japan

    Competitive landscape

    Leading Companies, Market Positioning of Companies, Competitive Strategies, and Industry Risks

    Request Free Sample

    What are the Key Data Covered in this Bone Densitometer Market Research and Growth Report?

    • CAGR of the Bone Densitometer industry during the forecast period
    • Detailed information on factors that will drive the Bone Densitometer growth and forecasting between 2024 and 2028
    • Precise estimation of the size of the market and its contribution of the industry in focus to the parent market
    • Accurate predictions about upcoming growth and trends and changes in consumer behaviour
    • Growth of the market across North America, Europe, Asia, and Rest of World (ROW)
    • Thorough analysis of the market’s competitive landscape and detailed information about companies
    • Comprehensive analysis of factors that will challenge the bone densitometer market growth of industry companies

    We can help! Our analysts can customize this bone densitometer market research report to meet your requirements.

    Get in touch


    1 Executive Summary

    • 1.1 Market overview
      • Exhibit 01: Executive Summary – Chart on Market Overview
      • Exhibit 02: Executive Summary – Data Table on Market Overview
      • Exhibit 03: Executive Summary – Chart on Global Market Characteristics
      • Exhibit 04: Executive Summary – Chart on Market by Geography
      • Exhibit 05: Executive Summary – Chart on Market Segmentation by Technology
      • Exhibit 06: Executive Summary – Chart on Market Segmentation by End-user
      • Exhibit 07: Executive Summary – Chart on Incremental Growth
      • Exhibit 08: Executive Summary – Data Table on Incremental Growth
      • Exhibit 09: Executive Summary – Chart on Vendor Market Positioning

    2 Market Landscape

    • 2.1 Market ecosystem
      • Exhibit 10: Parent market
      • Exhibit 11: Market Characteristics

    3 Market Sizing

    • 3.1 Market definition
      • Exhibit 12: Offerings of vendors included in the market definition
    • 3.2 Market segment analysis
      • Exhibit 13: Market segments
    • 3.3 Market size 2023
      • 3.4 Market outlook: Forecast for 2023-2028
        • Exhibit 14: Chart on Global - Market size and forecast 2023-2028 ($ million)
        • Exhibit 15: Data Table on Global - Market size and forecast 2023-2028 ($ million)
        • Exhibit 16: Chart on Global Market: Year-over-year growth 2023-2028 (%)
        • Exhibit 17: Data Table on Global Market: Year-over-year growth 2023-2028 (%)

      4 Historic Market Size

      • 4.1 Global bone densitometer market 2018 - 2022
        • Exhibit 18: Historic Market Size – Data Table on global bone densitometer market 2018 - 2022 ($ million)
      • 4.2 Technology Segment Analysis 2018 - 2022
        • Exhibit 19: Historic Market Size – Technology Segment 2018 - 2022 ($ million)
      • 4.3 End-user Segment Analysis 2018 - 2022
        • Exhibit 20: Historic Market Size – End-user Segment 2018 - 2022 ($ million)
      • 4.4 Geography Segment Analysis 2018 - 2022
        • Exhibit 21: Historic Market Size – Geography Segment 2018 - 2022 ($ million)
      • 4.5 Country Segment Analysis 2018 - 2022
        • Exhibit 22: Historic Market Size – Country Segment 2018 - 2022 ($ million)

      5 Five Forces Analysis

      • 5.1 Five forces summary
        • Exhibit 23: Five forces analysis - Comparison between 2023 and 2028
      • 5.2 Bargaining power of buyers
        • Exhibit 24: Chart on Bargaining power of buyers – Impact of key factors 2023 and 2028
      • 5.3 Bargaining power of suppliers
        • Exhibit 25: Bargaining power of suppliers – Impact of key factors in 2023 and 2028
      • 5.4 Threat of new entrants
        • Exhibit 26: Threat of new entrants – Impact of key factors in 2023 and 2028
      • 5.5 Threat of substitutes
        • Exhibit 27: Threat of substitutes – Impact of key factors in 2023 and 2028
      • 5.6 Threat of rivalry
        • Exhibit 28: Threat of rivalry – Impact of key factors in 2023 and 2028
      • 5.7 Market condition
        • Exhibit 29: Chart on Market condition - Five forces 2023 and 2028

      6 Market Segmentation by Technology

      • 6.1 Market segments
        • Exhibit 30: Chart on Technology - Market share 2023-2028 (%)
        • Exhibit 31: Data Table on Technology - Market share 2023-2028 (%)
      • 6.2 Comparison by Technology
        • Exhibit 32: Chart on Comparison by Technology
        • Exhibit 33: Data Table on Comparison by Technology
      • 6.3 Axial BDM - Market size and forecast 2023-2028
        • Exhibit 34: Chart on Axial BDM - Market size and forecast 2023-2028 ($ million)
        • Exhibit 35: Data Table on Axial BDM - Market size and forecast 2023-2028 ($ million)
        • Exhibit 36: Chart on Axial BDM - Year-over-year growth 2023-2028 (%)
        • Exhibit 37: Data Table on Axial BDM - Year-over-year growth 2023-2028 (%)
      • 6.4 Peripheral BDM - Market size and forecast 2023-2028
        • Exhibit 38: Chart on Peripheral BDM - Market size and forecast 2023-2028 ($ million)
        • Exhibit 39: Data Table on Peripheral BDM - Market size and forecast 2023-2028 ($ million)
        • Exhibit 40: Chart on Peripheral BDM - Year-over-year growth 2023-2028 (%)
        • Exhibit 41: Data Table on Peripheral BDM - Year-over-year growth 2023-2028 (%)
      • 6.5 Market opportunity by Technology
        • Exhibit 42: Market opportunity by Technology ($ million)
        • Exhibit 43: Data Table on Market opportunity by Technology ($ million)

      7 Market Segmentation by End-user

      • 7.1 Market segments
        • Exhibit 44: Chart on End-user - Market share 2023-2028 (%)
        • Exhibit 45: Data Table on End-user - Market share 2023-2028 (%)
      • 7.2 Comparison by End-user
        • Exhibit 46: Chart on Comparison by End-user
        • Exhibit 47: Data Table on Comparison by End-user
      • 7.3 Hospitals - Market size and forecast 2023-2028
        • Exhibit 48: Chart on Hospitals - Market size and forecast 2023-2028 ($ million)
        • Exhibit 49: Data Table on Hospitals - Market size and forecast 2023-2028 ($ million)
        • Exhibit 50: Chart on Hospitals - Year-over-year growth 2023-2028 (%)
        • Exhibit 51: Data Table on Hospitals - Year-over-year growth 2023-2028 (%)
      • 7.4 Specialty clinics - Market size and forecast 2023-2028
        • Exhibit 52: Chart on Specialty clinics - Market size and forecast 2023-2028 ($ million)
        • Exhibit 53: Data Table on Specialty clinics - Market size and forecast 2023-2028 ($ million)
        • Exhibit 54: Chart on Specialty clinics - Year-over-year growth 2023-2028 (%)
        • Exhibit 55: Data Table on Specialty clinics - Year-over-year growth 2023-2028 (%)
      • 7.5 Diagnostic and imaging centers - Market size and forecast 2023-2028
        • Exhibit 56: Chart on Diagnostic and imaging centers - Market size and forecast 2023-2028 ($ million)
        • Exhibit 57: Data Table on Diagnostic and imaging centers - Market size and forecast 2023-2028 ($ million)
        • Exhibit 58: Chart on Diagnostic and imaging centers - Year-over-year growth 2023-2028 (%)
        • Exhibit 59: Data Table on Diagnostic and imaging centers - Year-over-year growth 2023-2028 (%)
      • 7.6 Market opportunity by End-user
        • Exhibit 60: Market opportunity by End-user ($ million)
        • Exhibit 61: Data Table on Market opportunity by End-user ($ million)

      8 Customer Landscape

      • 8.1 Customer landscape overview
        • Exhibit 62: Analysis of price sensitivity, lifecycle, customer purchase basket, adoption rates, and purchase criteria

      9 Geographic Landscape

      • 9.1 Geographic segmentation
        • Exhibit 63: Chart on Market share by geography 2023-2028 (%)
        • Exhibit 64: Data Table on Market share by geography 2023-2028 (%)
      • 9.2 Geographic comparison
        • Exhibit 65: Chart on Geographic comparison
        • Exhibit 66: Data Table on Geographic comparison
      • 9.3 North America - Market size and forecast 2023-2028
        • Exhibit 67: Chart on North America - Market size and forecast 2023-2028 ($ million)
        • Exhibit 68: Data Table on North America - Market size and forecast 2023-2028 ($ million)
        • Exhibit 69: Chart on North America - Year-over-year growth 2023-2028 (%)
        • Exhibit 70: Data Table on North America - Year-over-year growth 2023-2028 (%)
      • 9.4 Europe - Market size and forecast 2023-2028
        • Exhibit 71: Chart on Europe - Market size and forecast 2023-2028 ($ million)
        • Exhibit 72: Data Table on Europe - Market size and forecast 2023-2028 ($ million)
        • Exhibit 73: Chart on Europe - Year-over-year growth 2023-2028 (%)
        • Exhibit 74: Data Table on Europe - Year-over-year growth 2023-2028 (%)
      • 9.5 Asia - Market size and forecast 2023-2028
        • Exhibit 75: Chart on Asia - Market size and forecast 2023-2028 ($ million)
        • Exhibit 76: Data Table on Asia - Market size and forecast 2023-2028 ($ million)
        • Exhibit 77: Chart on Asia - Year-over-year growth 2023-2028 (%)
        • Exhibit 78: Data Table on Asia - Year-over-year growth 2023-2028 (%)
      • 9.6 Rest of World (ROW) - Market size and forecast 2023-2028
        • Exhibit 79: Chart on Rest of World (ROW) - Market size and forecast 2023-2028 ($ million)
        • Exhibit 80: Data Table on Rest of World (ROW) - Market size and forecast 2023-2028 ($ million)
        • Exhibit 81: Chart on Rest of World (ROW) - Year-over-year growth 2023-2028 (%)
        • Exhibit 82: Data Table on Rest of World (ROW) - Year-over-year growth 2023-2028 (%)
      • 9.7 US - Market size and forecast 2023-2028
        • Exhibit 83: Chart on US - Market size and forecast 2023-2028 ($ million)
        • Exhibit 84: Data Table on US - Market size and forecast 2023-2028 ($ million)
        • Exhibit 85: Chart on US - Year-over-year growth 2023-2028 (%)
        • Exhibit 86: Data Table on US - Year-over-year growth 2023-2028 (%)
      • 9.8 China - Market size and forecast 2023-2028
        • Exhibit 87: Chart on China - Market size and forecast 2023-2028 ($ million)
        • Exhibit 88: Data Table on China - Market size and forecast 2023-2028 ($ million)
        • Exhibit 89: Chart on China - Year-over-year growth 2023-2028 (%)
        • Exhibit 90: Data Table on China - Year-over-year growth 2023-2028 (%)
      • 9.9 UK - Market size and forecast 2023-2028
        • Exhibit 91: Chart on UK - Market size and forecast 2023-2028 ($ million)
        • Exhibit 92: Data Table on UK - Market size and forecast 2023-2028 ($ million)
        • Exhibit 93: Chart on UK - Year-over-year growth 2023-2028 (%)
        • Exhibit 94: Data Table on UK - Year-over-year growth 2023-2028 (%)
      • 9.10 Germany - Market size and forecast 2023-2028
        • Exhibit 95: Chart on Germany - Market size and forecast 2023-2028 ($ million)
        • Exhibit 96: Data Table on Germany - Market size and forecast 2023-2028 ($ million)
        • Exhibit 97: Chart on Germany - Year-over-year growth 2023-2028 (%)
        • Exhibit 98: Data Table on Germany - Year-over-year growth 2023-2028 (%)
      • 9.11 Japan - Market size and forecast 2023-2028
        • Exhibit 99: Chart on Japan - Market size and forecast 2023-2028 ($ million)
        • Exhibit 100: Data Table on Japan - Market size and forecast 2023-2028 ($ million)
        • Exhibit 101: Chart on Japan - Year-over-year growth 2023-2028 (%)
        • Exhibit 102: Data Table on Japan - Year-over-year growth 2023-2028 (%)
      • 9.12 Market opportunity by geography
        • Exhibit 103: Market opportunity by geography ($ million)
        • Exhibit 104: Data Tables on Market opportunity by geography ($ million)

      10 Drivers, Challenges, and Trends

      • 10.1 Market drivers
        • 10.2 Market challenges
          • 10.3 Impact of drivers and challenges
            • Exhibit 105: Impact of drivers and challenges in 2023 and 2028
          • 10.4 Market trends

            11 Vendor Landscape

            • 11.1 Overview
              • 11.2 Vendor landscape
                • Exhibit 106: Overview on Criticality of inputs and Factors of differentiation
              • 11.3 Landscape disruption
                • Exhibit 107: Overview on factors of disruption
              • 11.4 Industry risks
                • Exhibit 108: Impact of key risks on business

              12 Vendor Analysis

              • 12.1 Vendors covered
                • Exhibit 109: Vendors covered
              • 12.2 Market positioning of vendors
                • Exhibit 110: Matrix on vendor position and classification
              • 12.3 Aarna Systems And Wellness Pvt. Ltd.
                • Exhibit 111: Aarna Systems And Wellness Pvt. Ltd. - Overview
                • Exhibit 112: Aarna Systems And Wellness Pvt. Ltd. - Product / Service
                • Exhibit 113: Aarna Systems And Wellness Pvt. Ltd. - Key offerings
              • 12.4 BeamMed Ltd.
                • Exhibit 114: BeamMed Ltd. - Overview
                • Exhibit 115: BeamMed Ltd. - Product / Service
                • Exhibit 116: BeamMed Ltd. - Key offerings
              • 12.5 CompuMed Inc.
                • Exhibit 117: CompuMed Inc. - Overview
                • Exhibit 118: CompuMed Inc. - Product / Service
                • Exhibit 119: CompuMed Inc. - Key offerings
              • 12.6 Demetech AB
                • Exhibit 120: Demetech AB - Overview
                • Exhibit 121: Demetech AB - Product / Service
                • Exhibit 122: Demetech AB - Key offerings
              • 12.7 Dentsply Sirona Inc.
                • Exhibit 123: Dentsply Sirona Inc. - Overview
                • Exhibit 124: Dentsply Sirona Inc. - Business segments
                • Exhibit 125: Dentsply Sirona Inc. - Key news
                • Exhibit 126: Dentsply Sirona Inc. - Key offerings
                • Exhibit 127: Dentsply Sirona Inc. - Segment focus
              • 12.8 Echolight SpA
                • Exhibit 128: Echolight SpA - Overview
                • Exhibit 129: Echolight SpA - Product / Service
                • Exhibit 130: Echolight SpA - Key offerings
              • 12.9 Eurotec Medical Systems s.r.l.
                • Exhibit 131: Eurotec Medical Systems s.r.l. - Overview
                • Exhibit 132: Eurotec Medical Systems s.r.l. - Product / Service
                • Exhibit 133: Eurotec Medical Systems s.r.l. - Key offerings
              • 12.10 Furuno Electric Co. Ltd.
                • Exhibit 134: Furuno Electric Co. Ltd. - Overview
                • Exhibit 135: Furuno Electric Co. Ltd. - Business segments
                • Exhibit 136: Furuno Electric Co. Ltd. - Key offerings
                • Exhibit 137: Furuno Electric Co. Ltd. - Segment focus
              • 12.11 GE Healthcare Technologies Inc.
                • Exhibit 138: GE Healthcare Technologies Inc. - Overview
                • Exhibit 139: GE Healthcare Technologies Inc. - Business segments
                • Exhibit 140: GE Healthcare Technologies Inc. - Key news
                • Exhibit 141: GE Healthcare Technologies Inc. - Key offerings
                • Exhibit 142: GE Healthcare Technologies Inc. - Segment focus
              • 12.12 Hologic Inc.
                • Exhibit 143: Hologic Inc. - Overview
                • Exhibit 144: Hologic Inc. - Business segments
                • Exhibit 145: Hologic Inc. - Key offerings
                • Exhibit 146: Hologic Inc. - Segment focus
              • 12.13 Koninklijke DSM NV
                • Exhibit 147: Koninklijke DSM NV - Overview
                • Exhibit 148: Koninklijke DSM NV - Business segments
                • Exhibit 149: Koninklijke DSM NV - Key news
                • Exhibit 150: Koninklijke DSM NV - Key offerings
                • Exhibit 151: Koninklijke DSM NV - Segment focus
              • 12.14 Medonica Co. Ltd.
                • Exhibit 152: Medonica Co. Ltd. - Overview
                • Exhibit 153: Medonica Co. Ltd. - Product / Service
                • Exhibit 154: Medonica Co. Ltd. - Key offerings
              • 12.15 Osteosys Corp.
                • Exhibit 155: Osteosys Corp. - Overview
                • Exhibit 156: Osteosys Corp. - Product / Service
                • Exhibit 157: Osteosys Corp. - Key offerings
              • 12.16 Swissray International Inc.
                • Exhibit 158: Swissray International Inc. - Overview
                • Exhibit 159: Swissray International Inc. - Product / Service
                • Exhibit 160: Swissray International Inc. - Key offerings
              • 12.17 Trivitron Healthcare
                • Exhibit 161: Trivitron Healthcare - Overview
                • Exhibit 162: Trivitron Healthcare - Product / Service
                • Exhibit 163: Trivitron Healthcare - Key offerings

              13 Appendix

              • 13.1 Scope of the report
                • 13.2 Inclusions and exclusions checklist
                  • Exhibit 164: Inclusions checklist
                  • Exhibit 165: Exclusions checklist
                • 13.3 Currency conversion rates for US$
                  • Exhibit 166: Currency conversion rates for US$
                • 13.4 Research methodology
                  • Exhibit 167: Research methodology
                  • Exhibit 168: Validation techniques employed for market sizing
                  • Exhibit 169: Information sources
                • 13.5 List of abbreviations
                  • Exhibit 170: List of abbreviations

                Research Methodology

                Technavio presents a detailed picture of the market by way of study, synthesis, and summation of data from multiple sources. The analysts have presented the various facets of the market with a particular focus on identifying the key industry influencers. The data thus presented is comprehensive, reliable, and the result of extensive research, both primary and secondary.

                INFORMATION SOURCES

                Primary sources

                • Manufacturers and suppliers
                • Channel partners
                • Industry experts
                • Strategic decision makers

                Secondary sources

                • Industry journals and periodicals
                • Government data
                • Financial reports of key industry players
                • Historical data
                • Press releases

                DATA ANALYSIS

                Data Synthesis

                • Collation of data
                • Estimation of key figures
                • Analysis of derived insights

                Data Validation

                • Triangulation with data models
                • Reference against proprietary databases
                • Corroboration with industry experts

                REPORT WRITING

                Qualitative

                • Market drivers
                • Market challenges
                • Market trends
                • Five forces analysis

                Quantitative

                • Market size and forecast
                • Market segmentation
                • Geographical insights
                • Competitive landscape

                Interested in this report?

                Get your sample now to see our research methodology and insights!

                Download Now

                Frequently Asked Questions

                Bone Densitometer market growth will increase by $ 80.51 mn during 2024-2028 .

                The Bone Densitometer market is expected to grow at a CAGR of 4.67% during 2024-2028 .

                Bone Densitometer market is segmented by Technology( Axial BDM, Peripheral BDM) End-user( Hospitals, Specialty clinics, Diagnostic and imaging centers)

                Aarna Systems And Wellness Pvt. Ltd., BeamMed Ltd., BMTech Co. Ltd., CompuMed Inc., CyberLogic inc., Demetech AB, Dentsply Sirona Inc., Echolight SpA, Eurotec Medical Systems s.r.l., Furuno Electric Co. Ltd., GE Healthcare Technologies Inc., Hologic Inc., Koninklijke DSM NV, Medonica Co. Ltd., Osteosys Corp., Scanflex Healthcare AB, Shenzhen Aikerui Electric Co. Ltd., Swissray International Inc., Trivitron Healthcare, Anjue Medical Equipment Co. Ltd. are a few of the key vendors in the Bone Densitometer market.

                North America will register the highest growth rate of 31% among the other regions. Therefore, the Bone Densitometer market in North America is expected to garner significant business opportunities for the vendors during the forecast period.

                US, UK, Germany, China, Japan

                • Rising prevalence of osteoporosis due to growing geriatric population worldwideThe prevalence of osteoporosis and the growing geriatric population worldwide are driving the growth of the global bone densitometer market at an unprecedented rate. Osteoporosis affects approximately 200 million people worldwide is the driving factor this market.
                • with this number expected to rise sharply in the coming decades. Postmenopausal women are particularly susceptible to osteoporosis is the driving factor this market.
                • with estimates suggesting that one in three women over the age of 50 years will experience osteoporosis-related fractures. Additionally is the driving factor this market.
                • about one in five men over the age of 50 years will also suffer from osteoporosis-related fractures. The rising geriatric population further compounds the issue is the driving factor this market.
                • as the worlds demographic scenario continues to skew toward older age groups. It is projected that the global population aged 60 years and over will nearly double from 962 million in 2017 to 2.1 billion by 2050. This demographic shift increases the demand for bone densitometry equipment significantly to assess bone health and detect osteoporosis early. In developed regions such as North America and Europe is the driving factor this market.
                • where the proportion of the geriatric population as a percentage of the overall population is higher is the driving factor this market.
                • the burden of osteoporosis is particularly acute. However is the driving factor this market.
                • emerging economies in Asia and Latin America are also witnessing a surge in the prevalence of osteoporosis due to changing lifestyles is the driving factor this market.
                • urbanization is the driving factor this market.
                • and dietary shifts. This underscores the universal need for effective screening for the disease as well as diagnostic tools like bone densitometers to identify individuals at risk and implement preventive measures. Therefore is the driving factor this market.
                • the rising prevalence of osteoporosis and the growing geriatric population worldwide will drive the growth of the global bone densitometer market during the forecast period. is the driving factor this market.

                The Bone Densitometer market vendors should focus on grabbing business opportunities from the Axial BDM segment as it accounted for the largest market share in the base year.