Bone Staple Systems Market Size 2025-2029
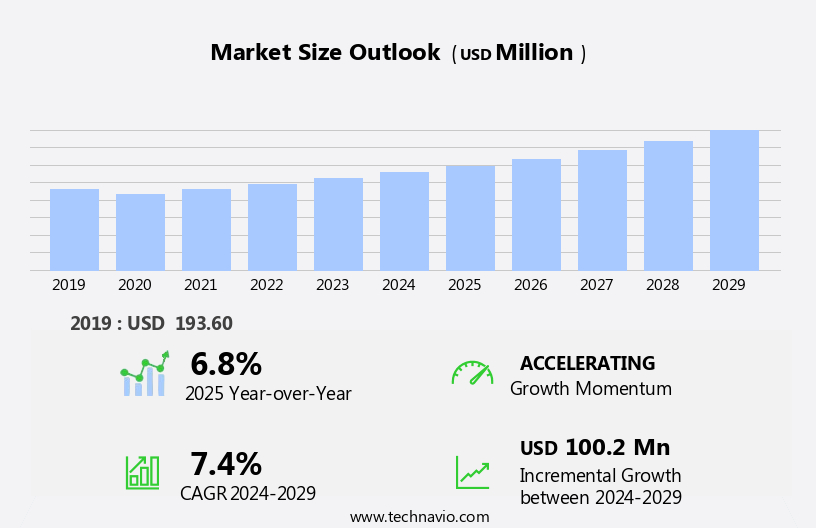
The bone staple systems market size is forecast to increase by USD 100.2 million at a CAGR of 7.4% between 2024 and 2029.
- The market is witnessing significant growth, driven by the high prevalence of osteoporosis and an increase in product launches. The increasing incidence of osteoporosis, a condition characterized by weakened bones, necessitates the use of bone staples for fracture fixation. These systems offer advantages such as reduced operative time, minimal soft tissue damage, and improved patient comfort compared to traditional methods. Patient education, medical insurance, and healthcare policy are also influencing market trends, with a focus on personalized healthcare, cost-benefit analysis, and precision medicine. However, the market faces challenges related to the risks associated with placement and removal of bone staples. These risks include complications such as infection, nerve damage, and improper healing, which can lead to re-interventions and increased healthcare costs. To mitigate these risks, companies must focus on developing advanced bone staple systems with improved biocompatibility and ease of use.
- Additionally, rigorous clinical trials and regulatory approvals are essential to ensure patient safety and market acceptance. Companies that successfully address these challenges and offer innovative solutions will gain a competitive edge in the market. Computer-aided design and digital health are transforming the medical device industry, enabling the development of more precise and effective bone staple systems.
What will be the Size of the Bone Staple Systems Market during the forecast period?
Explore in-depth regional segment analysis with market size data - historical 2019-2023 and forecasts 2025-2029 - in the full report.
Request Free Sample
- The market is experiencing significant advancements, driven by the intersection of healthcare innovation and medical technology. Predictive modeling is revolutionizing clinical effectiveness, while healthcare data management and electronic health records facilitate data analytics and machine learning in bone density and bone remodeling research.
- Finite element analysis and biomechanical testing are essential for ensuring bone strength and optimizing surgical navigation. Artificial intelligence and reimbursement models are further shaping the market, with a growing emphasis on healthcare information systems and bone growth factors to improve health outcomes.
How is this Bone Staple Systems Industry segmented?
The bone staple systems industry research report provides comprehensive data (region-wise segment analysis), with forecasts and estimates in "USD million" for the period 2025-2029, as well as historical data from 2019-2023 for the following segments.
- End-user
- Hospitals
- Orthopedic centers
- Ambulatory surgical centers
- Clinics
- Material
- Shape memory bone staple systems
- Mechanical bone staple systems
- Product Type
- Titanium
- Stainless steel
- Bioabsorbable or bioresorbable
- Hybrid materials
- Geography
- North America
- US
- Canada
- Europe
- France
- Germany
- Italy
- Spain
- UK
- APAC
- China
- India
- Japan
- Rest of World (ROW)
- North America
By End-user Insights
The hospitals segment is estimated to witness significant growth during the forecast period. Hospitals serve as significant end-users in the market, given their role in orthopedic care. Trauma and orthopedic doctors rely on these systems for various procedures, such as fracture fixation, joint fusion, open reduction, and bone realignment. The demand for bone staple systems in hospitals arises from their need for accurate, dependable, and user-friendly solutions to ensure optimal patient outcomes. These systems provide stability and support during complex bone procedures, facilitating proper bone healing and functional recovery. Hospitals seek advanced and versatile bone staple systems to cater to a wide range of surgical requirements, from routine orthopedic procedures to more intricate ones.
Value-based healthcare and cost-effectiveness analysis are crucial considerations in the selection process. Infection control, implant stability, pain management, and patient positioning are essential factors influencing the choice of bone staple systems. Regulatory approvals, surgical planning, and surgical supplies are integral components of the hospital equipment ecosystem that support the implementation of bone staple systems. Minimally invasive operation, bone regeneration, and tissue engineering are emerging trends in orthopedic care, driving the adoption of bioabsorbable implants and stem cell therapy. Medical devices, including bone healing and fracture repair, employ biocompatible materials and imaging techniques to enhance patient care. Physical therapy, occupational therapy, and functional recovery are integral to post-operative care, further emphasizing the importance of bone staple systems in the healthcare continuum.
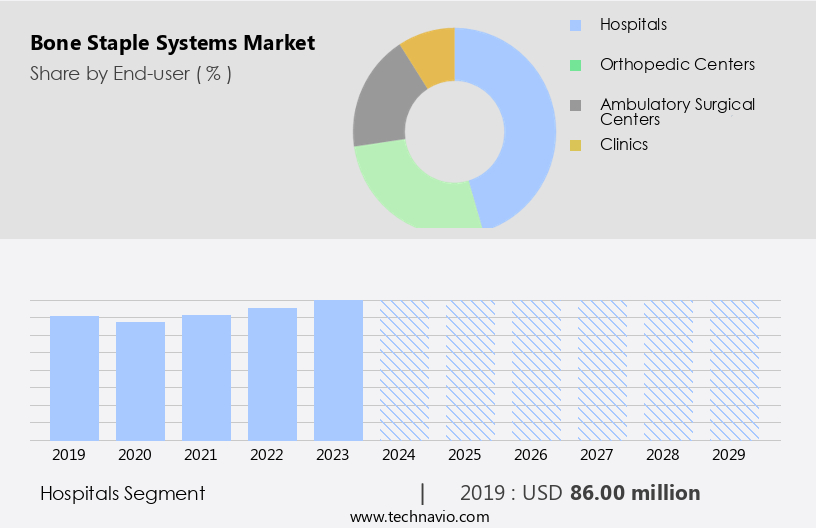
The Hospitals segment was valued at USD 86.00 million in 2019 and showed a gradual increase during the forecast period.
Regional Analysis
North America is estimated to contribute 36% to the growth of the global market during the forecast period. Technavio's analysts have elaborately explained the regional trends and drivers that shape the market during the forecast period.
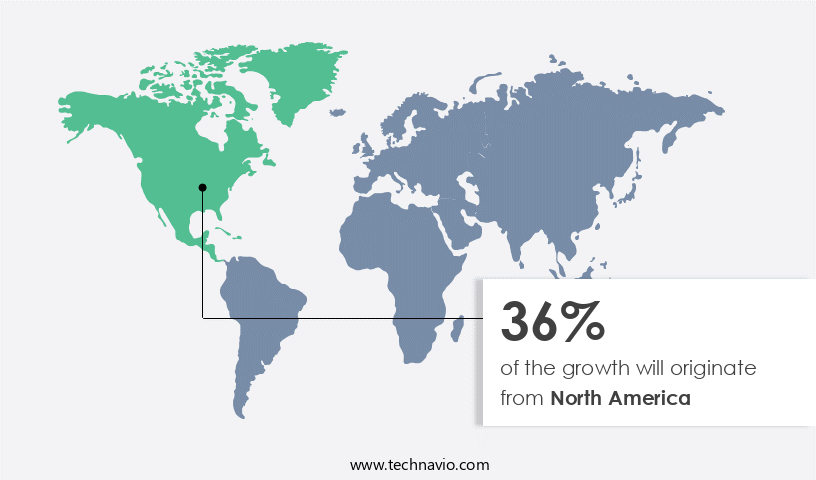
The North American market for bone staple systems holds significant potential for growth, outpacing the global market expansion during the forecast period. This region is anticipated to account for the largest revenue share due to the prevalence of orthopedic conditions, particularly osteoporosis, fractures, and knee injuries. In the US, meniscal injuries are common, with obesity and aging being major contributing factors to these conditions. As people age, their bones become weaker, increasing the likelihood of fractures and falls. Bone staple systems are essential for bone fixation in various surgical procedures, including open reduction and internal fixation, external fixation, and minimally invasive operation.
These systems offer advantages such as quicker healing times, reduced complications, and improved patient outcomes. Surgical planning, patient positioning, and infection control are crucial aspects of bone staple system usage. Value-based healthcare and cost-effectiveness analysis are increasingly important considerations in the healthcare sector, making bone staple systems an attractive option due to their cost-effectiveness compared to other bone fixation methods. Hospital equipment, surgical instruments, and implant design play significant roles in the success of surgical procedures. Regulatory approvals and clinical trials are essential for ensuring the safety and efficacy of bone staple systems. Bioactive coatings, biocompatible materials, and pain management are essential aspects of bone staple systems, enhancing implant stability, bone healing, and patient comfort.
Tissue engineering, bone regeneration, and stem cell therapy are emerging areas of research, offering potential advancements in bone staple systems and their applications. Orthopedic operations and trauma doctors are key users of bone staple systems, while healthcare providers and sports medicine specialists also play important roles in their implementation. Pain management, physical therapy, and occupational therapy are integral components of post-operative care. Complications management and antibacterial properties are essential features of bone staple systems, ensuring patient safety and reducing the risk of infections. Implant stability, imaging techniques, and patient outcomes are critical factors in the success of bone staple systems.
Market Dynamics
Our researchers analyzed the data with 2024 as the base year, along with the key drivers, trends, and challenges. A holistic analysis of drivers will help companies refine their marketing strategies to gain a competitive advantage.
What are the Bone Staple Systems market drivers leading to the rise in the adoption of Industry?
- The high prevalence of osteoporosis serves as the primary market driver, given its significant impact on the global health care landscape and the subsequent demand for effective diagnostic tools and treatment options. Osteoporosis, a disease characterized by the gradual loss of bone density, affects millions of adults in the US each year, leading to an increased risk of fractures, particularly in the spine, hip, and wrist. During surgical procedures to treat osteoporosis, such as trauma or orthopedic doctors, bone staple systems are utilized to stabilize the affected area and facilitate bone healing. These systems consist of sterilized surgical instruments and supplies, often featuring bioactive coatings for improved infection control and patient comfort. Surgical planning and patient positioning are crucial aspects of the procedure, ensuring the accuracy and effectiveness of the bone stapling process.
- Value-based healthcare initiatives prioritize the importance of quality post-operative care, making the use of these systems essential for optimal patient outcomes. The sterilization and maintenance of these devices are critical to prevent infection and ensure the safety and efficacy of the surgical instruments. Bone staple systems play a vital role in restoring bone integrity and improving the quality of life for patients suffering from osteoporosis-related fractures. The integration of these systems into surgical procedures not only enhances the surgical experience but also contributes to the overall success of the treatment. Bone staple systems represent a significant investment in the healthcare industry, offering a reliable and effective solution for treating osteoporosis-related fractures and promoting the healing process.
What are the Bone Staple Systems market trends shaping the Industry?
- The trend in the market is marked by an upward trajectory in product launches. This dynamic business environment underscores the importance of staying informed and prepared for frequent new product introductions. Bone staple systems offer a simplified solution for bone fixation, particularly in open reduction procedures. These systems consist of staples that are inserted into the bone to securely hold fractured or osteotomized bones in place, thereby promoting quicker healing. Bone staples can be utilized as single or multiple units or in conjunction with other forms of fixation at a single site. The advancement of bone staple technology has led to innovative applications, including use in minimally invasive operations such as endoscopic procedures. New designs and engineered systems have expanded the potential of bone staples, making them more versatile and easier to implant.
- These advancements also allow for a greater degree of compression, enhancing bone regeneration. Bone staples are not limited to traditional bone fixation methods. They can also be employed in conjunction with stem cell therapy and bioresorbable implants. Regulatory approvals for these advanced applications continue to drive market growth. The focus on minimally invasive operations and external fixation methods further increases the demand for bone staple systems in the healthcare sector.
How does Bone Staple Systems market face challenges during its growth?
- The placement and removal of bone staples pose significant risks, which represent a major challenge to the expansion and progression of the industry. Bone staple systems are essential medical devices used in functional recovery after bone fractures or osteotomies. These systems facilitate bone healing through compression across the fracture surface, provided by the bridge of the staple. However, if the bridge shortens or the staple extrudes, the compression may be compromised. The legs of bone staples, featuring barbs or spikes, ensure proper contact between the staple and bone. Inadvertent removal of bone staples during operation can lead to damage to the bone channels. Advancements in medical devices include the use of biocompatible materials, titanium implants, and imaging techniques such as CT scans for assessing implant stability.
- Physical therapy and occupational therapy play a crucial role in the recovery process. Tissue engineering research is ongoing to develop alternative methods for bone healing. Clinical trials are essential to evaluate the safety and efficacy of bone staple systems. Ensuring proper implant positioning and stability is essential for successful bone healing and functional recovery. The future of bone staple systems lies in the continuous development of innovative materials and technologies to improve patient outcomes.
Exclusive Customer Landscape
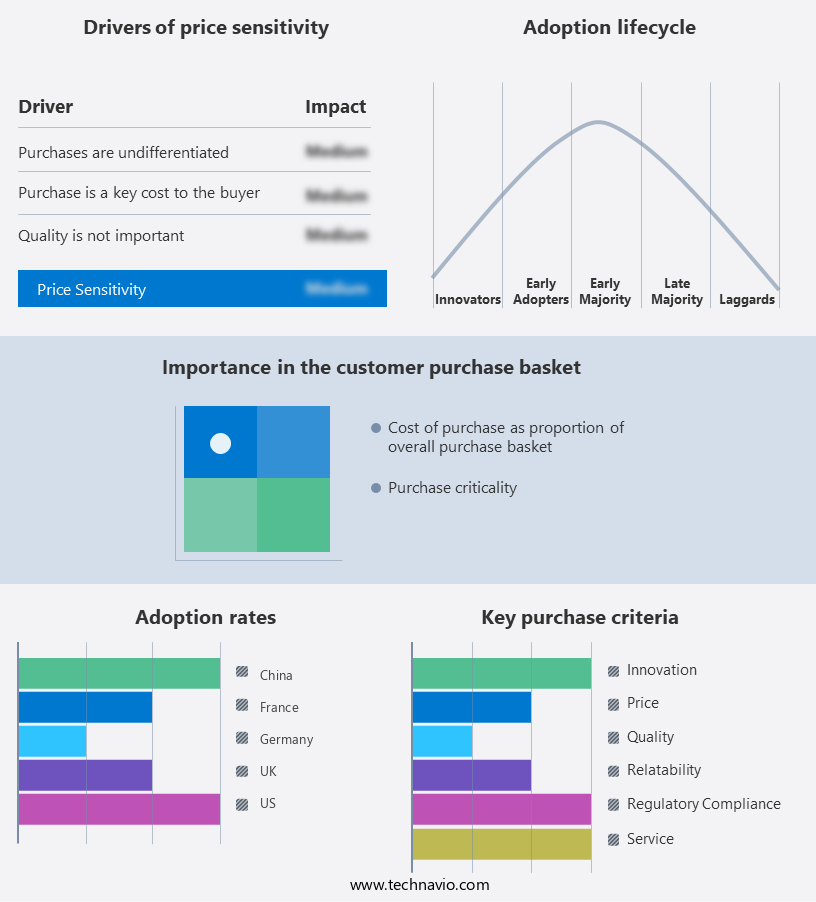
The bone staple systems market forecasting report includes the adoption lifecycle of the market, covering from the innovator's stage to the laggard's stage. It focuses on adoption rates in different regions based on penetration. Furthermore, the bone staple systems market report also includes key purchase criteria and drivers of price sensitivity to help companies evaluate and develop their market growth analysis strategies.
Customer Landscape
Key Companies & Market Insights
Companies are implementing various strategies, such as strategic alliances, bone staple systems market forecast, partnerships, mergers and acquisitions, geographical expansion, and product/service launches, to enhance their presence in the industry.
Arthrex Inc. - The company specializes in providing advanced bone fixation solutions, including Nitinol bone staple systems.
The industry research and growth report includes detailed analyses of the competitive landscape of the market and information about key companies, including:
- Arthrex Inc.
- Auxein Medical Inc.
- BioPro Inc.
- Conmed Corp.
- DJO Global Inc.
- Globus Medical Inc.
- GPC Medical Ltd.
- Integra LifeSciences Holdings Corp.
- Johnson and Johnson Services Inc.
- Medicalex Francemed
- Neosteo SA
- Ortho Solutions UK Ltd.
- OrthoPediatrics Corp.
- Reign Medical
- Smith and Nephew plc
- Stryker Corp.
- Vast Ortho
- Zimmer Biomet Holdings Inc.
Qualitative and quantitative analysis of companies has been conducted to help clients understand the wider business environment as well as the strengths and weaknesses of key industry players. Data is qualitatively analyzed to categorize companies as pure play, category-focused, industry-focused, and diversified; it is quantitatively analyzed to categorize companies as dominant, leading, strong, tentative, and weak.
Recent Development and News in Bone Staple Systems Market
- In February 2023, Stryker Corporation, a leading medical technology company, announced the launch of its new bone staple system, the OptiFuse⢠S-Anchored Plating System. This innovative product combines the benefits of bone staples and plates, offering doctors a more versatile and efficient solution for fracture fixation (Stryker Corporation, 2023).
- In October 2024, Smith & Nephew, a global medical device manufacturer, entered into a strategic partnership with OrthoSonic Technologies, a pioneer in ultrasonic bone preparation and bone stapling systems. This collaboration aims to integrate OrthoSonic's ultrasonic technology into Smith & Nephew's bone staple systems, enhancing the efficiency and precision of surgical procedures (Smith & Nephew, 2024).
- In March 2025, Medtronic plc, a prominent player in the medical technology industry, completed the acquisition of NuVasive, Inc.'s bone healing business, which includes its bone staple systems. This acquisition strengthens Medtronic's presence in the orthopedic trauma market and expands its product portfolio (Medtronic plc, 2025).
- In May 2025, the U.S. Food and Drug Administration (FDA) granted 510(k) clearance to Zimmer Biomet Holdings for its new bone staple system, the NexGen⢠Bone Staple System. This clearance marks the first FDA approval for a bone staple system with a fully reusable design, reducing the overall cost and environmental impact of the surgical procedure (Zimmer Biomet Holdings, 2025).
Research Analyst Overview
The market continues to evolve, driven by advancements in open reduction techniques, implant design, and hospital equipment. These innovations are transforming various sectors of healthcare, including endoscopic operations and minimally invasive procedures. Healthcare providers are increasingly adopting these technologies to improve functional recovery and enhance patient quality of life. Regulatory approvals for bone fixation devices, such as bioresorbable implants and bone grafting materials, are accelerating market growth. Bioactive coatings and sterilization methods are essential components of bone staple systems, ensuring infection control and implant stability. Surgical planning and value-based healthcare are also influencing market dynamics, with a focus on cost-effectiveness analysis and patient outcomes.
Orthopedic and trauma doctors are integrating these systems into their practices to facilitate bone regeneration and fracture repair. External fixation and internal fixation systems are gaining popularity due to their minimal invasiveness and biocompatible materials. Tissue engineering and stem cell therapy are also contributing to the market's growth, offering potential solutions for complex bone injuries. Clinical trials and imaging techniques are crucial in evaluating the safety and efficacy of these systems. Bioabsorbable materials and titanium implants are key players in the market, with ongoing research and development efforts aimed at improving implant stability, pain management, and complications management.
The market's continuous dynamism reflects the ongoing unfolding of market activities and evolving patterns in the healthcare industry.
Dive into Technavio's robust research methodology, blending expert interviews, extensive data synthesis, and validated models for unparalleled Bone Staple Systems Market insights. See full methodology.
|
Market Scope |
|
|
Report Coverage |
Details |
|
Page number |
223 |
|
Base year |
2024 |
|
Historic period |
2019-2023 |
|
Forecast period |
2025-2029 |
|
Growth momentum & CAGR |
Accelerate at a CAGR of 7.4% |
|
Market growth 2025-2029 |
USD 100.2 million |
|
Market structure |
Fragmented |
|
YoY growth 2024-2025(%) |
6.8 |
|
Key countries |
US, Germany, China, UK, France, Canada, Japan, Italy, India, and Spain |
|
Competitive landscape |
Leading Companies, Market Positioning of Companies, Competitive Strategies, and Industry Risks |
What are the Key Data Covered in this Bone Staple Systems Market Research and Growth Report?
- CAGR of the Bone Staple Systems industry during the forecast period
- Detailed information on factors that will drive the growth and forecasting between 2025 and 2029
- Precise estimation of the size of the market and its contribution of the industry in focus to the parent market
- Accurate predictions about upcoming growth and trends and changes in consumer behaviour
- Growth of the market across North America, Europe, Asia, and Rest of World (ROW)
- Thorough analysis of the market's competitive landscape and detailed information about companies
- Comprehensive analysis of factors that will challenge the bone staple systems market growth of industry companies
We can help! Our analysts can customize this bone staple systems market research report to meet your requirements.
 RIA -
RIA - 
