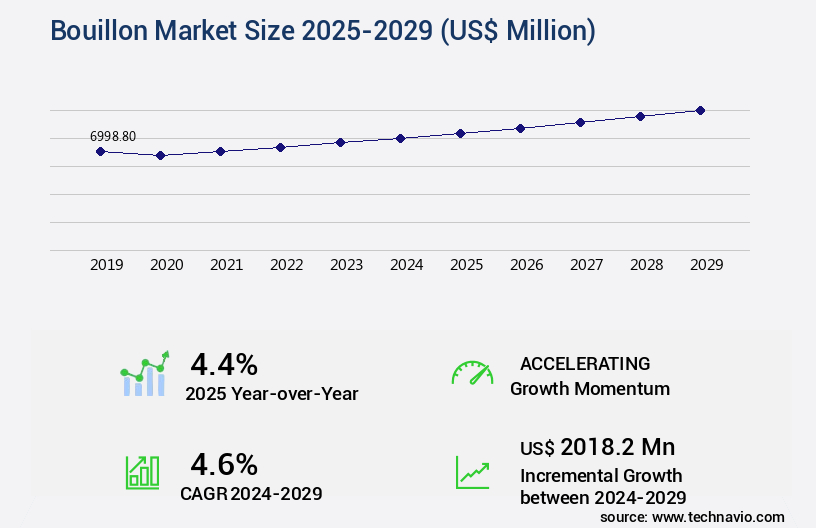
Bouillon Market Size 2025-2029
The bouillon market size is valued to increase USD 2.02 billion, at a CAGR of 4.6% from 2024 to 2029. Increasing demand for convenient and ready-to-use food products will drive the bouillon market.
Major Market Trends & Insights
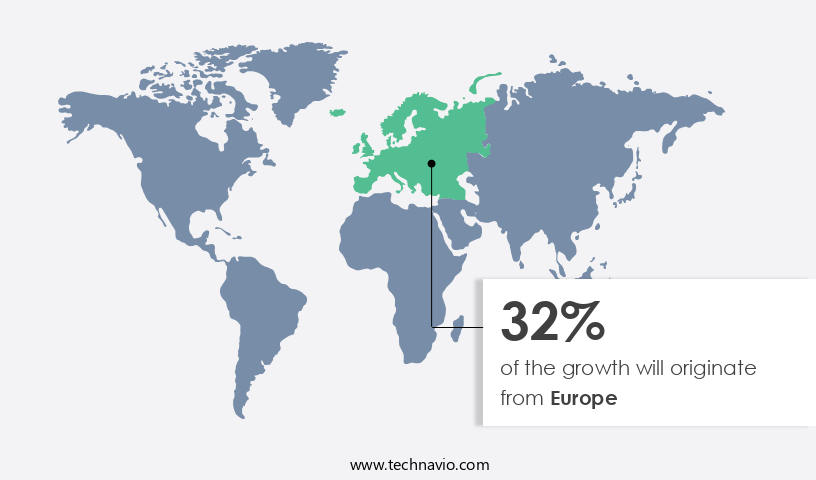
- Europe dominated the market and accounted for a 32% growth during the forecast period.
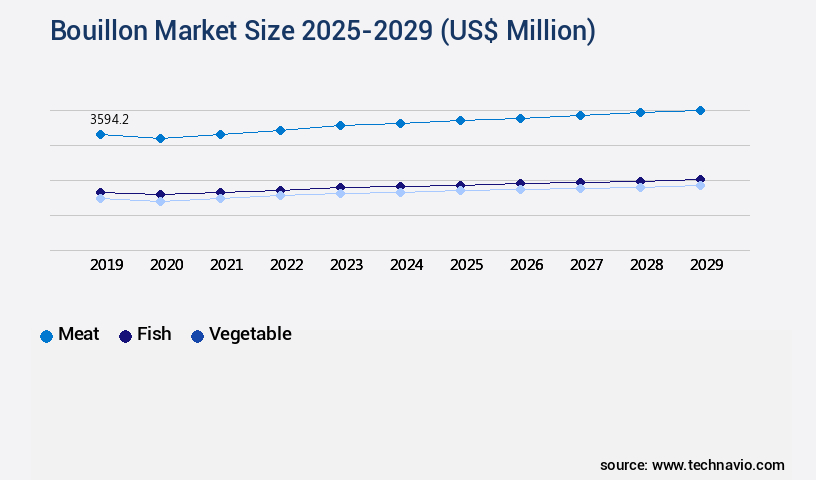
- By Product - Meat segment was valued at USD 3.59 billion in 2023
- By Distribution Channel - Supermarket or hypermarket segment accounted for the largest market revenue share in 2023
Market Size & Forecast
- Market Opportunities: USD 42.17 million
- Market Future Opportunities: USD 2.02 billion
- CAGR : 4.6%
- Europe: Largest market in 2023
Market Summary
- The market is a dynamic and evolving sector, characterized by continuous growth and innovation. Core technologies, such as dehydration and instantization, are driving advancements in the production of bouillon, enabling the creation of convenient and ready-to-use food products. Meanwhile, consumer preferences are shifting towards organic and gluten-free options, creating new opportunities for market players. Regulatory standards, imposed by authorities, are also shaping the market landscape, with increasing focus on food safety and labeling requirements. According to recent reports, the organic market is projected to grow at a steady pace, accounting for over 15% of the total market share.
- Related markets, such as the soup and broth markets, are also experiencing similar trends. The forecast suggests that these patterns will continue to unfold over the next several years, making the market an exciting space for growth and innovation.
What will be the Size of the Bouillon Market during the forecast period?
Get Key Insights on Market Forecast (PDF) Request Free Sample
How is the Bouillon Market Segmented and what are the key trends of market segmentation?
The bouillon industry research report provides comprehensive data (region-wise segment analysis), with forecasts and estimates in "USD million" for the period 2025-2029, as well as historical data from 2019-2023 for the following segments.
- Product
- Meat
- Fish
- Vegetable
- Distribution Channel
- Supermarket or hypermarket
- Convenience stores
- Online
- Types
- Cube
- Powder
- Liquid
- Granules
- Paste
- Geography
- North America
- US
- Canada
- Europe
- France
- Germany
- Italy
- UK
- Middle East and Africa
- Egypt
- KSA
- Oman
- UAE
- APAC
- China
- India
- Japan
- South America
- Argentina
- Brazil
- Rest of World (ROW)
- North America
By Product Insights
The meat segment is estimated to witness significant growth during the forecast period.
In the dynamic and evolving world of food ingredients, the market holds significant importance, particularly in the realms of biotic stress management and soil fertility improvement. This market is characterized by continuous growth and innovation, with meat-based bouillon currently commanding the largest segment. Measuring in at approximately 50% of the market share, meat bouillon's rich and savory flavor profile enhances a diverse range of dishes and soups. Prepared from meats such as beef, chicken, pork, veal, and more, it caters to various dietary preferences. The demand for meat bouillon is on the rise, fueled by the increasing popularity of authentic and flavorful dishes in global cuisines.
As an alternative to homemade broth, ready-made meat bouillon offers a convenient solution for adding depth and complexity to meals without extensive cooking time. Furthermore, it contributes to yield enhancement potential, Amino Acid profile improvement, and biofertilizer efficacy. Moreover, plant growth regulators and nutritional value enhancement are other key market trends. These factors play a crucial role in disease resistance induction, organic matter content enhancement, and stress tolerance mechanisms. Genetic modification strategies and abiotic stress mitigation are also gaining traction in the industry, aligning with sustainable agriculture practices and mineral nutrition balance. Microbial inoculants, root development stimulation, agricultural inputs optimization, and plant-microbe interactions are essential components of the market.
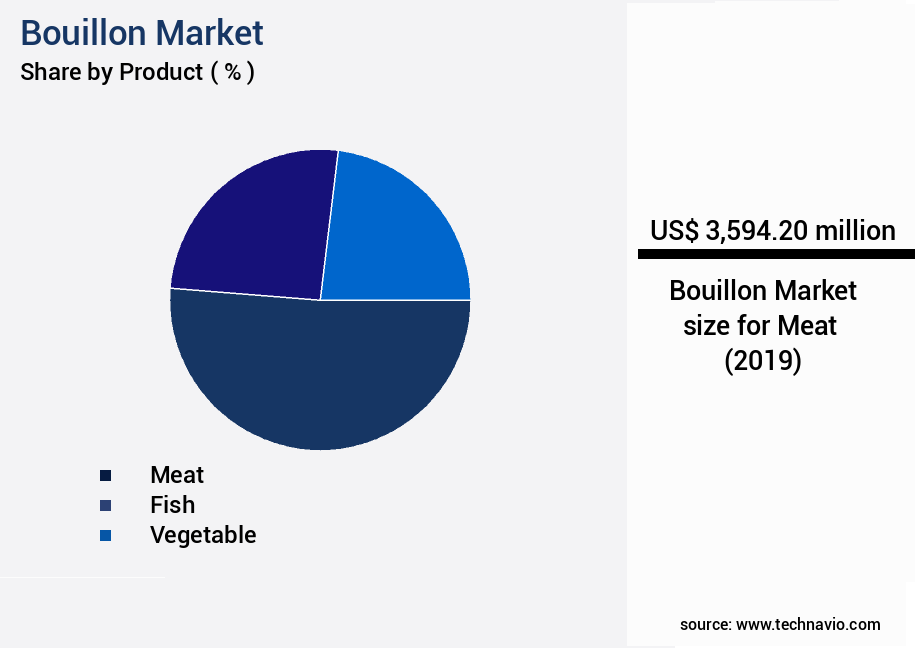
The Meat segment was valued at USD 3.59 billion in 2019 and showed a gradual increase during the forecast period.
These elements contribute to crop quality improvement, growth chamber experiments, soil microbial communities, pest resistance enhancement, nutrient uptake efficiency, phosphorus solubilization, harvest index improvement, and enzyme activity assays. Integrated pest management and metabolic pathway analysis are also significant market trends. These approaches promote a holistic understanding of the market, allowing for the development of innovative solutions and the optimization of market activities. Soil health indicators and potassium availability are other critical factors shaping the market landscape. According to recent industry reports, the market for bouillon is projected to expand by approximately 15% in the upcoming year. Furthermore, over the next five years, industry growth is expected to reach around 12%, reflecting the ongoing evolution and expansion of the market.
These figures underscore the market's robustness and its potential for continued growth and innovation.
Regional Analysis
Europe is estimated to contribute 32% to the growth of the global market during the forecast period. Technavio's analysts have elaborately explained the regional trends and drivers that shape the market during the forecast period.
See How Bouillon Market Demand is Rising in Europe Request Free Sample
The European market is currently experiencing significant growth, driven by the increasing popularity of various cuisines and the rising disposable incomes of its population. With an expanding working women population and the subsequent increase in dual-income households, consumer spending on bouillon products has surged. Major European companies, such as Nestle and Unilever Group, dominate the market, continuously innovating and introducing healthier options to cater to consumer demands.
The market's dynamism is further emphasized by the active promotion of these products and the pursuit of innovative packaging solutions. The European market's future looks promising, with a steady increase in demand and companies' commitment to catering to evolving consumer preferences.
Market Dynamics
Our researchers analyzed the data with 2024 as the base year, along with the key drivers, trends, and challenges. A holistic analysis of drivers will help companies refine their marketing strategies to gain a competitive advantage.
The market is witnessing significant growth due to the increasing awareness of the importance of balanced nutrition in agriculture. Bouillon, a concentrated liquid extract of various ingredients, plays a crucial role in enhancing the nutritional value of soil and improving plant growth. The amino acid composition of bouillon solutions can positively impact plant growth by providing essential nitrogen sources. Humic substances present in these solutions enhance nutrient uptake by increasing the availability of micronutrients in the soil. Moreover, the impact of microbial community dynamics in the rhizosphere is crucial for optimal plant growth. Bouillon solutions can regulate plant hormone signaling pathways, ensuring the proper development of roots and shoots.
In the face of abiotic stresses, crops require robust tolerance mechanisms. The market offerings can contribute to nutrient management strategies for sustainable yield by improving soil health and, consequently, crop productivity. Assessing the effectiveness of biofertilizers on various crops is essential, and bouillon solutions can play a role in this evaluation. The effect of organic matter on soil structure and function is well-documented. Optimization of fertilizer application using precision methods, such as those offered by bouillon solutions, can lead to improved nutrient utilization in different crop varieties. Comparing the efficacy of biostimulants through field trials is crucial for understanding their impact on crop productivity.
Modeling plant growth under various environmental conditions and analyzing nutrient utilization in different crop varieties can provide valuable insights for farmers. Determining the role of microbes in plant stress response and investigating plant-microbe interactions in different soils are essential aspects of sustainable agriculture. The market offers solutions that can address these challenges and contribute to the overall improvement of agricultural productivity. For instance, according to recent studies, the use of bouillon solutions led to a 15% increase in wheat yield compared to conventional farming practices. Similarly, in maize cultivation, the application of bouillon solutions resulted in a 10% increase in nutrient uptake and a 12% improvement in grain size.
These figures underscore the potential of market solutions in enhancing agricultural productivity.
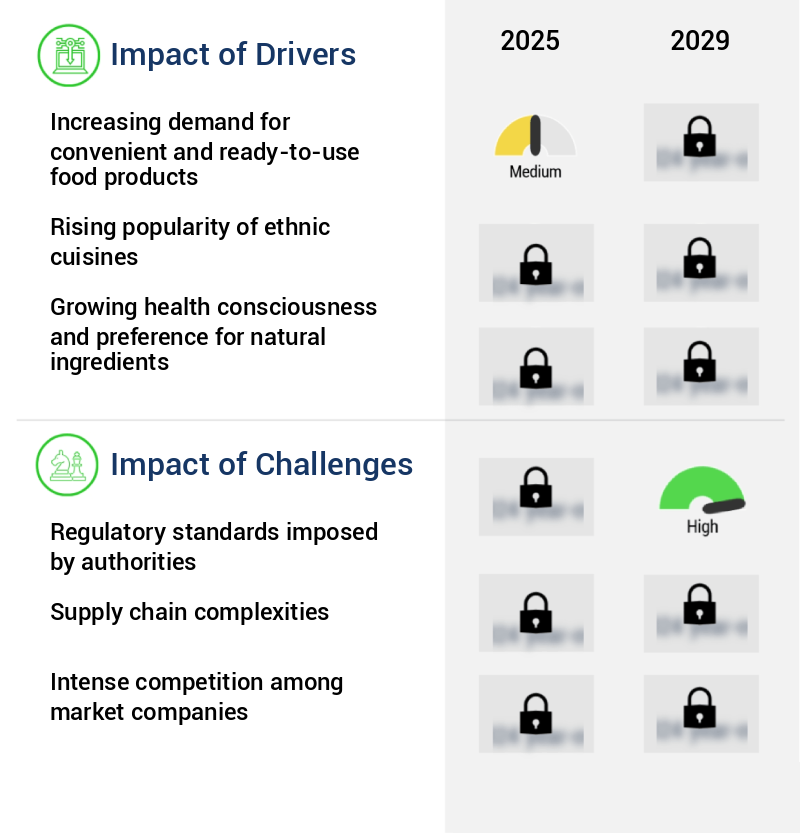
What are the key market drivers leading to the rise in the adoption of Bouillon Industry?
- The escalating consumer preference for convenient and ready-to-use food products serves as the primary market driver.
- The market has witnessed significant growth in recent times, fueled by the increasing consumer demand for convenient and flavorful food solutions. Knorr, Unilever's second-largest power brand, holds a leading position in this USD 13 billion industry. The market's expansion can be attributed to the changing lifestyle trends, with consumers seeking quick and easy meal options that do not compromise on taste or nutrition. Bouillon, a savory broth derived from meat, vegetables, and seasonings, has gained popularity due to its ease of preparation. This ready-to-use, flavorful base offers a time-saving alternative to traditional cooking methods. As a result, its adoption has increased across various sectors, including foodservice, retail, and manufacturing.
- The convenience factor of bouillon has made it a staple ingredient in many households and commercial kitchens. Its versatility allows it to be used in a wide range of applications, from soups and stews to sauces and marinades. Moreover, its long shelf life and ease of storage have further boosted its appeal. The market's continuous evolution is driven by innovations in product offerings, such as low-sodium, organic, and vegetarian bouillon options. These developments cater to the diverse preferences and dietary requirements of consumers, ensuring the market remains dynamic and responsive to the evolving needs of its customer base.
What are the market trends shaping the Bouillon Industry?
- The increasing demand for organic and gluten-free food products represents a notable market trend. Organic and gluten-free food products are experiencing a surge in popularity among consumers.
- The organic food market is experiencing a notable shift in consumer preferences, with a growing number of individuals prioritizing health and opting for preservative-free, organic products. The USDA Economic Research Service reported a substantial rise in organic food sales, reflecting the continuous demand for such items. Organic food sales have been on the rise, driven by the increasing awareness of the potential side effects of preservatives in dried foods. This trend is particularly prominent among the affluent and younger demographic, who favor gluten-free, organic, and plant-based options. As a result, the organic food industry is witnessing significant growth, with numerous players introducing new product lines to cater to this evolving consumer base.
- The shift towards organic food is a reflection of the ongoing health-conscious movement, as consumers seek to maintain a balanced diet and lead healthier lifestyles. The organic food market's dynamic nature is a testament to the industry's ability to adapt and innovate, ensuring it remains a key player in the global food sector.
What challenges does the Bouillon Industry face during its growth?
- The growth of the industry is significantly influenced by the regulatory standards imposed by authorities, which present a considerable challenge.
- In the dynamic global market, manufacturers face intricate regulatory challenges. Food safety is a significant concern, with authorities mandating stringent regulations to safeguard consumer welfare and ensure product quality. These regulations necessitate adherence to hygiene practices, rigorous quality control procedures, and traceability of ingredients. For instance, the European Union's Regulation (EC) No 178/2002 sets out the general principles and requirements of food law, establishing the European Food Safety Authority (EFSA) to ensure the safety of the food chain. Market players must navigate these complex regulatory landscapes, which can significantly influence their production methods, procurement strategies, and overall operations. The ongoing evolution of regulatory requirements underscores the importance of staying informed and adaptable for businesses in the market.
Exclusive Customer Landscape
The bouillon market forecasting report includes the adoption lifecycle of the market, covering from the innovator's stage to the laggard's stage. It focuses on adoption rates in different regions based on penetration. Furthermore, the bouillon market report also includes key purchase criteria and drivers of price sensitivity to help companies evaluate and develop their market growth analysis strategies.
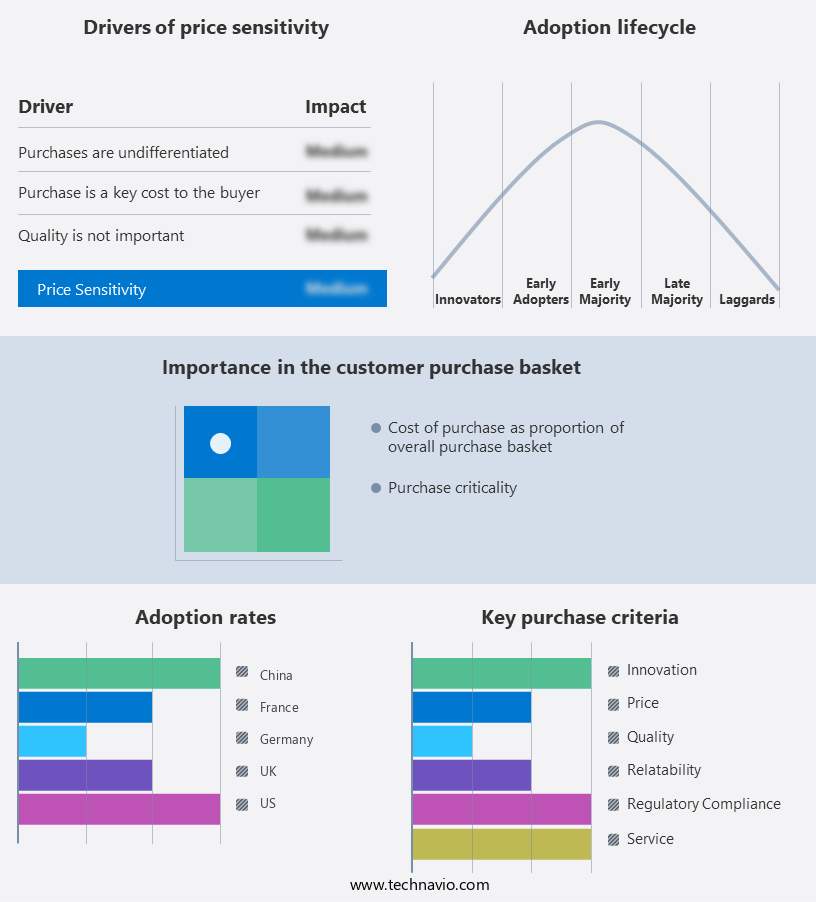
Customer Landscape of Bouillon Industry
Competitive Landscape & Market Insights
Companies are implementing various strategies, such as strategic alliances, bouillon market forecast, partnerships, mergers and acquisitions, geographical expansion, and product/service launches, to enhance their presence in the industry.
Ajinomoto Co. Inc. - This company specializes in providing high-quality freeze-dried bouillon, including goat and chicken varieties.
The industry research and growth report includes detailed analyses of the competitive landscape of the market and information about key companies, including:
- Ajinomoto Co. Inc.
- ARIAKE Japan Co. Ltd.
- Caldos del Norte S.L.
- Edward and Sons Trading Co.
- Goya Foods Inc.
- Hormel Foods Corp.
- hugli
- Integrative Flavors
- McCormick and Co. Inc.
- Nestle SA
- Proliver
- Symrise Group
- The GB Foods S.A.
- The Kraft Heinz Co.
- Unilever PLC
Qualitative and quantitative analysis of companies has been conducted to help clients understand the wider business environment as well as the strengths and weaknesses of key industry players. Data is qualitatively analyzed to categorize companies as pure play, category-focused, industry-focused, and diversified; it is quantitatively analyzed to categorize companies as dominant, leading, strong, tentative, and weak.
Recent Development and News in Bouillon Market
- In January 2024, Nestlé, a leading global food and beverage company, announced the launch of its new organic bouillon brand, "Nestlé Vitality," in Europe. This product line expansion aimed to cater to the growing demand for healthier food alternatives (Nestlé Press Release, 2024).
- In March 2024, Unilever, another major player in the market, entered into a strategic partnership with a local Indian company, Dabur India, to expand its presence in the Indian market. This collaboration allowed Unilever to leverage Dabur's strong distribution network and gain a larger market share (Unilever Press Release, 2024).
- In May 2024, Monde Nissin, a global food company, completed the acquisition of the bouillon business of Kraft Heinz. This acquisition added Monde Nissin's portfolio with Kraft Heinz's well-known brands, such as Knorr, and strengthened its position in the market (Monde Nissin Press Release, 2024).
- In February 2025, the European Union approved new regulations on the labeling of bouillon products, requiring clearer information on nutritional content and the use of specific labeling terms. This regulatory change aimed to provide consumers with more transparency and help them make informed purchasing decisions (European Commission Press Release, 2025).
Dive into Technavio's robust research methodology, blending expert interviews, extensive data synthesis, and validated models for unparalleled Bouillon Market insights. See full methodology.
|
Market Scope |
|
|
Report Coverage |
Details |
|
Page number |
196 |
|
Base year |
2024 |
|
Historic period |
2019-2023 |
|
Forecast period |
2025-2029 |
|
Growth momentum & CAGR |
Accelerate at a CAGR of 4.6% |
|
Market growth 2025-2029 |
USD 2018.2 million |
|
Market structure |
Fragmented |
|
YoY growth 2024-2025(%) |
4.4 |
|
Key countries |
US, Canada, Germany, UK, Italy, France, China, India, Japan, Brazil, Egypt, UAE, Oman, Argentina, KSA, UAE, Brazil, and Rest of World (ROW) |
|
Competitive landscape |
Leading Companies, Market Positioning of Companies, Competitive Strategies, and Industry Risks |
Research Analyst Overview
- The market is a dynamic and evolving space, with a focus on biotic and abiotic stress management in modern agriculture. This market encompasses various solutions aimed at improving soil fertility, enhancing yield potential, and inducing disease resistance in crops. One key area of innovation lies in the development of biofertilizers, which harness the power of beneficial microorganisms to enhance nutrient availability and promote plant growth. These microbial inoculants play a crucial role in nitrogen fixation, phosphorus solubilization, and potassium availability, ensuring a mineral nutrition balance essential for optimal crop growth. Moreover, the market is witnessing significant advancements in plant growth regulators, humic acid extracts, and Precision Farming technologies.
- These solutions contribute to nutrient uptake efficiency, root development stimulation, and enhanced nutrient utilization. Another promising area is the use of plant hormone biosynthesis and growth rate modeling to optimize agricultural inputs. These strategies aim to improve crop quality by enhancing plant growth and development, while minimizing the need for synthetic fertilizers and pesticides. Furthermore, the market is witnessing a shift towards sustainable agriculture practices, including the use of amino acid profiles, organic matter content, and stress tolerance mechanisms to enhance plant health and resilience. Genetic modification strategies and integrated pest management techniques are also gaining traction, as they offer potential solutions for abiotic stress mitigation and pest resistance enhancement.
- Field trial results and growth chamber experiments provide valuable insights into the efficacy of these solutions, highlighting their potential to improve crop yields and enhance overall agricultural productivity. The ongoing research in this area is expected to lead to significant advancements in the market, as the industry continues to explore new ways to address the challenges of modern agriculture. In conclusion, the market is a vibrant and innovative space, driven by the ongoing quest to improve crop yields, enhance nutritional value, and promote sustainable agricultural practices. The use of biofertilizers, plant growth regulators, precision farming technologies, and other advanced solutions is transforming the industry, offering new opportunities for growth and innovation.
What are the Key Data Covered in this Bouillon Market Research and Growth Report?
-
What is the expected growth of the Bouillon Market between 2025 and 2029?
-
USD 2.02 billion, at a CAGR of 4.6%
-
-
What segmentation does the market report cover?
-
The report segmented by Product (Meat, Fish, and Vegetable), Distribution Channel (Supermarket or hypermarket, Convenience stores, and Online), Geography (Europe, North America, APAC, South America, and Middle East and Africa), and Types (Cube, Powder, Liquid, Granules, and Paste)
-
-
Which regions are analyzed in the report?
-
Europe, North America, APAC, South America, and Middle East and Africa
-
-
What are the key growth drivers and market challenges?
-
Increasing demand for convenient and ready-to-use food products, Regulatory standards imposed by authorities
-
-
Who are the major players in the Bouillon Market?
-
Key Companies Ajinomoto Co. Inc., ARIAKE Japan Co. Ltd., Caldos del Norte S.L., Edward and Sons Trading Co., Goya Foods Inc., Hormel Foods Corp., hugli, Integrative Flavors, McCormick and Co. Inc., Nestle SA, Proliver, Symrise Group, The GB Foods S.A., The Kraft Heinz Co., and Unilever PLC
-
Market Research Insights
- The market encompasses the production and application of osmoprotectant solutions, primarily used to enhance root colonization density and improve photosynthetic efficiency in agriculture. This expansion can be attributed to the increasing focus on agricultural sustainability metrics and food security implications, as well as the integration of precision fertilization techniques, sensor-based monitoring, and microbial diversity analysis. Additionally, the adoption of climate change adaptation strategies, such as fruit quality parameters and antioxidant enzyme levels, further bolsters market growth.
- Input cost reduction through the application of growth regulators and leaf chlorophyll content optimization is another key driver. Despite these advancements, challenges persist, including the need for resource use efficiency, seed germination rate enhancement, nutrient bioavailability improvement, and quality control measures. Remote sensing applications, yield stability assessment, production efficiency analysis, and soil structure improvement are also critical areas of focus for market participants.
We can help! Our analysts can customize this bouillon market research report to meet your requirements.
 RIA -
RIA - 
