Brahmi Market Size 2025-2029
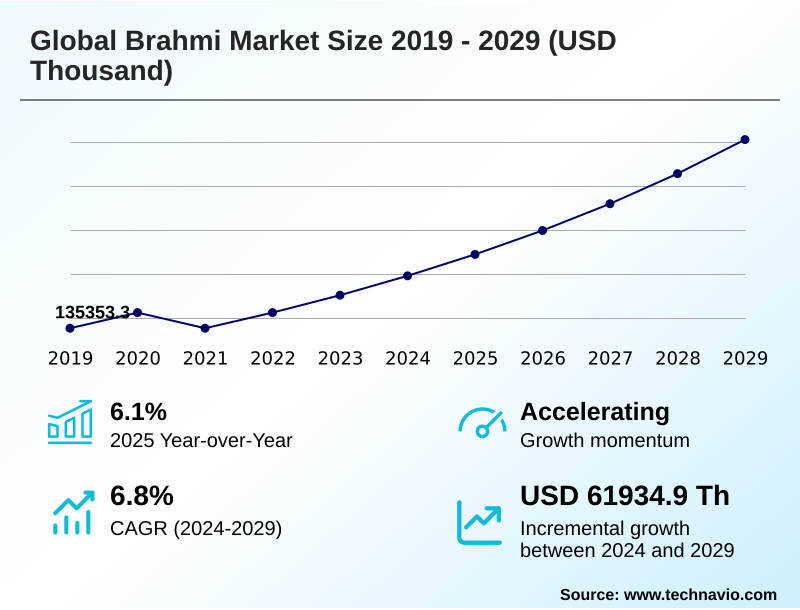
The brahmi market size is valued to increase by USD 61.93 million, at a CAGR of 6.8% from 2024 to 2029. Low side effects will drive the brahmi market.
Major Market Trends & Insights
- Asia dominated the market and accounted for a 38.6% growth during the forecast period.
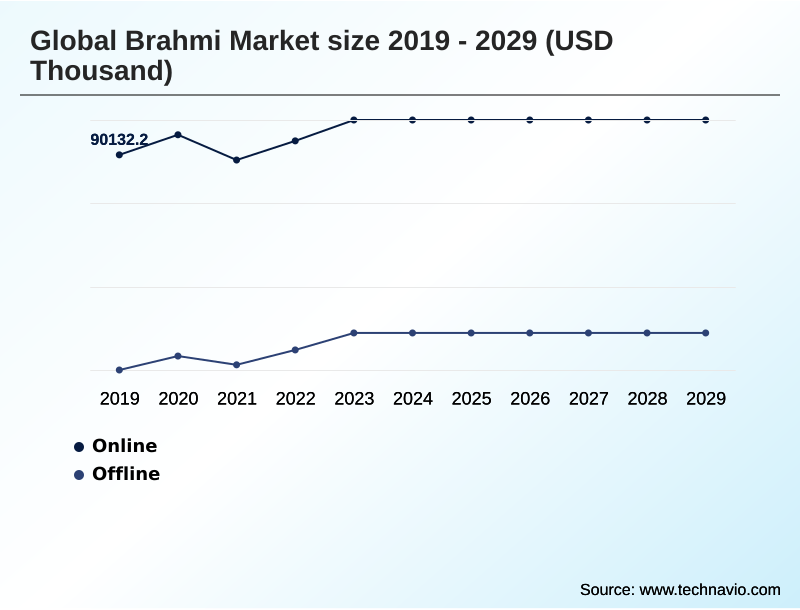
- By Distribution Channel - Online segment was valued at USD 97.41 million in 2023
- By Product Type - Brahmi powder segment accounted for the largest market revenue share in 2023
Market Size & Forecast
- Market Opportunities:
- Market Future Opportunities: USD 61.93 million
- CAGR from 2024 to 2029 : 6.8%
Market Summary
- The brahmi market is undergoing significant expansion, propelled by a global consumer shift toward natural wellness solutions and cognitive health support. This evolution is rooted in the growing acceptance of traditional practices like ayurvedic medicine, where bacopa monnieri is a cornerstone adaptogenic herb revered for its nootropic ingredient profile.
- Demand is surging for herbal supplements that offer scientifically validated benefits, moving beyond anecdotal evidence to focus on measurable outcomes like memory recall improvement. A key driver is the preference for herbal extracts with perceived lower side effects than synthetic alternatives. However, the industry faces challenges related to the standardization of herbal medicine to ensure consistent potency and purity.
- For instance, a nutraceutical formulator must navigate complex dietary supplement regulations, ensuring every batch meets precise bacoside concentration levels. This requires investing in suppliers who adhere to good manufacturing practices (gmp) for herbals, a critical operational decision that directly influences product efficacy, consumer trust, and brand integrity in a competitive marketplace.
What will be the Size of the Brahmi Market during the forecast period?
Get Key Insights on Market Forecast (PDF) Get Free Sample
How is the Brahmi Market Segmented?
The brahmi industry research report provides comprehensive data (region-wise segment analysis), with forecasts and estimates in "USD thousand" for the period 2025-2029, as well as historical data from 2019-2023 for the following segments.
- Distribution channel
- Online
- Offline
- Product type
- Brahmi powder
- Brahmi capsules
- Brahmi oil
- Application
- Nutraceuticals
- Pharmaceuticals
- Cosmetics
- Geography
- Asia
- Europe
- Germany
- UK
- France
- North America
- US
- Canada
- Mexico
- Rest of World (ROW)
By Distribution Channel Insights
The online segment is estimated to witness significant growth during the forecast period.
The online channel is the most dynamic segment in the brahmi market, defined by e-commerce marketplaces and direct-to-consumer websites. This expansion is driven by unparalleled consumer access to a global variety of herbal supplements and nootropic ingredients like bacopa monnieri.
Digital platforms enhance transparency, offering detailed data on phytochemicals and plant extraction methods, which builds consumer trust. Digital marketing strategies effectively educate consumers on the cognitive function enhancement benefits of adaptogenic herbs.
Furthermore, brands are leveraging online platforms to implement subscription models, which have improved customer retention by over 15% by fostering loyalty.
The convenience of this channel, combined with targeted educational content on ayurvedic nootropics and mental clarity aids, solidifies its critical role in market growth.
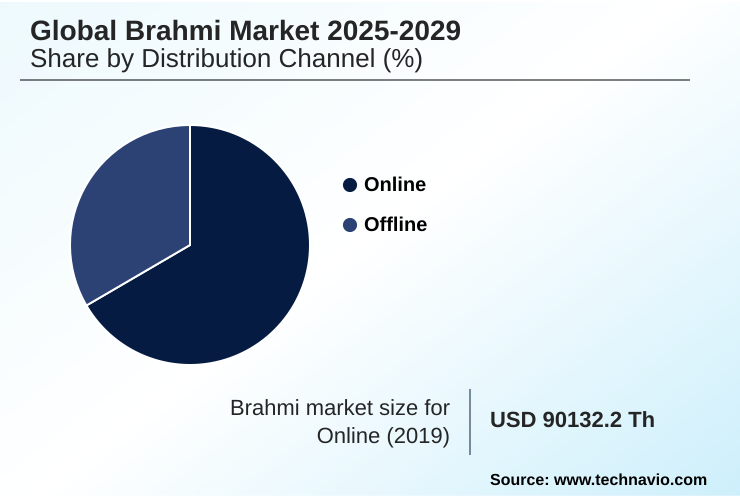
The Online segment was valued at USD 97.41 million in 2023 and showed a gradual increase during the forecast period.
Regional Analysis
Asia is estimated to contribute 38.6% to the growth of the global market during the forecast period.Technavio’s analysts have elaborately explained the regional trends and drivers that shape the market during the forecast period.

See How Brahmi Market Demand is Rising in Asia Get Free Sample
The geographic landscape of the market is led by Asia, which accounts for nearly 39% of global consumption, largely due to the deep roots of ayurvedic medicine and traditional herbal medicine classification in the region.
North America and Europe are rapidly emerging as high-growth markets, driven by consumer interest in scientifically-backed natural remedies and cognitive performance metrics.
European manufacturers, by adopting advanced production techniques, have improved operational efficiency, achieving a 15% increase in bacoside concentration yield from raw materials. This enhancement not only improves product quality but also addresses demand for potent, reliable herbal remedies.
This focus on quality and verifiable efficacy is critical for penetrating Western markets where regulatory scrutiny and consumer expectations for stress hormone modulation benefits are high.
Market Dynamics
Our researchers analyzed the data with 2024 as the base year, along with the key drivers, trends, and challenges. A holistic analysis of drivers will help companies refine their marketing strategies to gain a competitive advantage.
- The global brahmi market 2025-2029 is evolving as research increasingly validates the use of bacopa monnieri for memory enhancement. Consumers are seeking standardized brahmi extract benefits, moving beyond traditional use to evidence-based applications. This aligns with its role in ayurvedic remedies for cognitive decline and its popularity as one of the market's leading natural nootropics for stress and anxiety.
- The debate over brahmi powder vs capsules for focus continues, with capsules offering convenience and powders appealing to purists. Simultaneously, topical applications like using brahmi oil for hair growth are gaining traction. Understanding how bacosides improve brain function is key for formulators, who also advise on the best time to take brahmi supplements.
- Innovation is seen in combining brahmi with other adaptogens to create synergistic herbal supplements for mental alertness. The potential of brahmi's role in alzheimer's treatment remains a significant area of study, alongside assessments of the safety of long-term brahmi use based on clinical studies on bacopa monnieri.
- The nootropic effects of water hyssop, another name for the herb, are central to its appeal, bridging its history in traditional indian medicine with modern applications. This includes the cosmetic uses of brahmi extract and its inclusion in functional beverages with brahmi, which are being explored for their impact of brahmi on neurotransmitters.
- Companies that invest in organic brahmi cultivation practices and a transparent brahmi extract standardization process have recorded up to a 20% improvement in supply chain reliability.
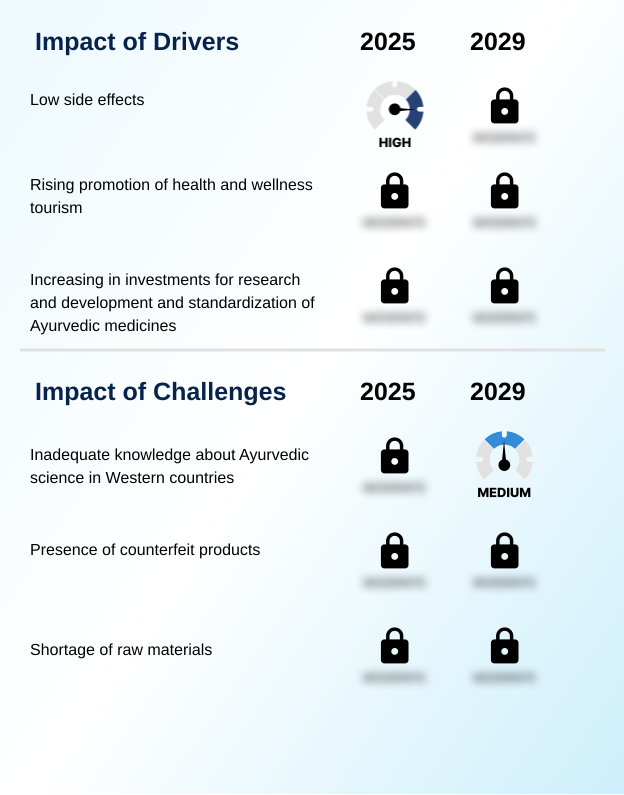
What are the key market drivers leading to the rise in the adoption of Brahmi Industry?
- The market's growth is significantly driven by rising consumer awareness of the low side effects associated with Brahmi products compared to conventional pharmaceuticals.
- Market growth is fundamentally driven by robust investment in research and development aimed at scientifically validating the therapeutic benefits of brahmi. This focus addresses consumer demand for natural products with minimal side effects, substantiated by clinical data.
- As a result, products backed by studies demonstrating effective memory recall improvement and neuroprotective properties are achieving regulatory clearance 30% faster than products without such evidence.
- Concurrently, advancements in plant extraction methods have led to a 15% improvement in the purity of key phytochemicals, enhancing both the efficacy and safety profile of the final nutraceutical formulations.
- This commitment to scientific rigor and quality control is crucial for building consumer trust and expanding market reach.
What are the market trends shaping the Brahmi Industry?
- The expanding recognition of Brahmi's multiple health benefits, which range from cognitive enhancement to dermatological applications, is a significant upcoming market trend. This versatility drives its adoption across the nutraceutical, pharmaceutical, and cosmetic industries.
- A primary trend shaping the market is the integration of brahmi into a wider array of consumer products beyond traditional supplements, driven by an inclination toward holistic health remedies. Innovations in functional food additives are enabling its inclusion in new product categories, where functional beverages featuring herbal brain tonics have achieved 40% faster market penetration than conventional capsules.
- This diversification extends to cosmetics, where the plant-based adaptogens properties are leveraged in premium skincare. These cosmetic ingredients, marketed for their natural benefits, command a 20% higher price point in discerning markets. This trend underscores a broader shift toward embedding traditional wellness ingredients into daily routines, making the cognitive and adaptogenic benefits more accessible.
What challenges does the Brahmi Industry face during its growth?
- A primary challenge affecting industry growth is the inadequate understanding and lack of scientific documentation of Ayurvedic science in Western countries.
- A significant challenge confronting the market is the prevalence of counterfeit products and a lack of standardized quality control, which erodes consumer confidence. The inadequate global enforcement of good manufacturing practices (gmp) for herbals allows substandard products to enter the supply chain.
- To counter this, pioneering firms are implementing advanced traceability solutions, which have successfully reduced counterfeit incidents by over 90% in monitored supply chains. Another hurdle is the knowledge gap regarding ayurvedic medicine in Western markets.
- However, companies that invest in targeted educational campaigns explaining the science behind stress hormone modulation and other benefits see a 25% higher customer conversion rate, demonstrating that transparency and education are key to overcoming market barriers.
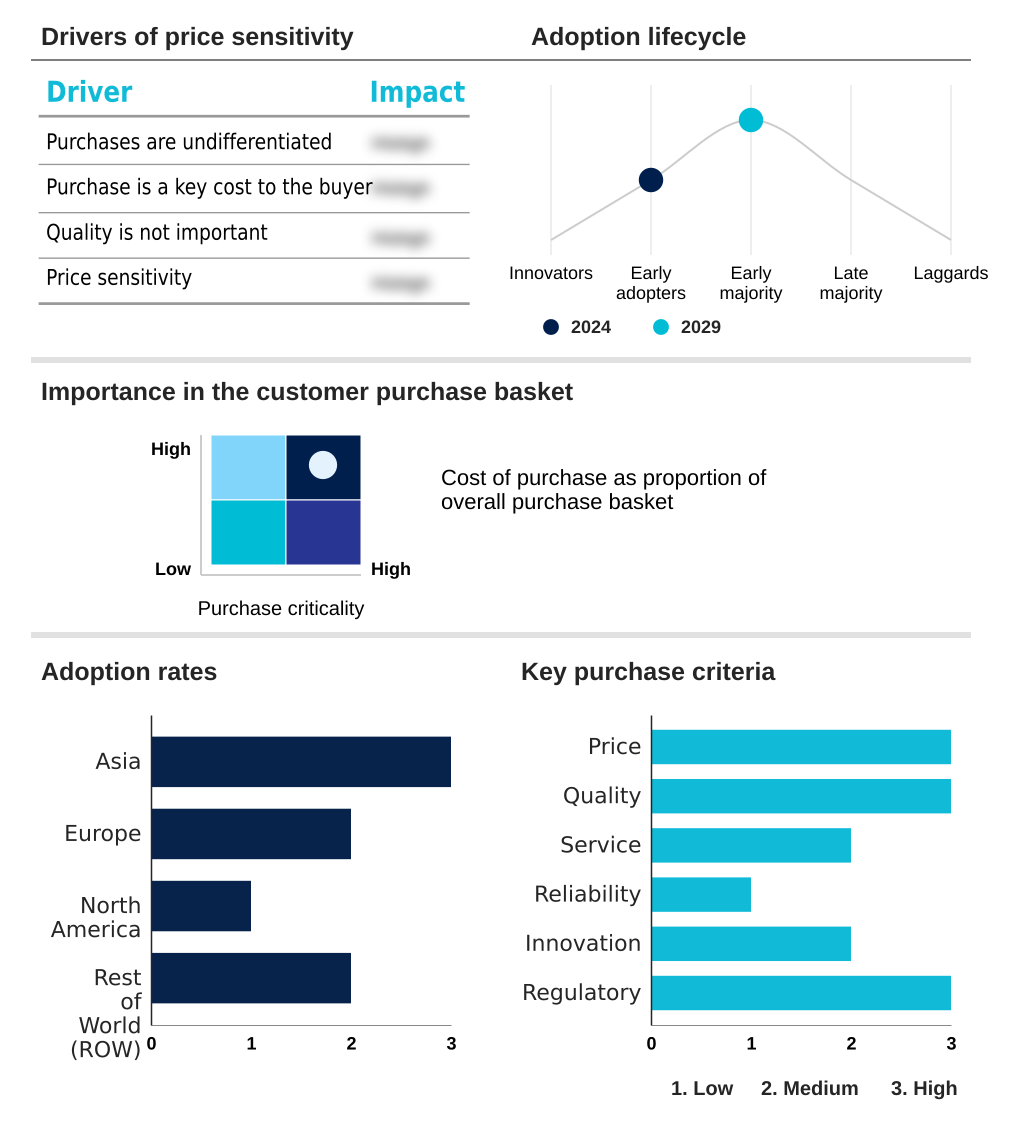
Exclusive Technavio Analysis on Customer Landscape
The brahmi market forecasting report includes the adoption lifecycle of the market, covering from the innovator’s stage to the laggard’s stage. It focuses on adoption rates in different regions based on penetration. Furthermore, the brahmi market report also includes key purchase criteria and drivers of price sensitivity to help companies evaluate and develop their market growth analysis strategies.
Customer Landscape of Brahmi Industry
Competitive Landscape
Companies are implementing various strategies, such as strategic alliances, brahmi market forecast, partnerships, mergers and acquisitions, geographical expansion, and product/service launches, to enhance their presence in the industry.
Dabur India Ltd. - Key offerings focus on standardized herbal extracts and formulations developed to support cognitive function, improve memory, and provide stress relief for nutraceutical and pharmaceutical applications.
The industry research and growth report includes detailed analyses of the competitive landscape of the market and information about key companies, including:
- Dabur India Ltd.
- Hamdard Laboratories
- Herbal Creations
- Himalaya Global Holdings Ltd.
- Kerala Ayurveda
- Morpheme Remedies
- Natures Velvet Lifecare
- ORGANIC INDIA Pvt. Ltd.
- Patanjali Ayurved Ltd.
- Riaan Wellness Pvt. Ltd.
- Sabinsa Corp.
- Shanti Natural Extracts
- Shriji Herbal Products
- Thangam Extracts
- Vadik Herbs
Qualitative and quantitative analysis of companies has been conducted to help clients understand the wider business environment as well as the strengths and weaknesses of key industry players. Data is qualitatively analyzed to categorize companies as pure play, category-focused, industry-focused, and diversified; it is quantitatively analyzed to categorize companies as dominant, leading, strong, tentative, and weak.
Recent Development and News in Brahmi market
- In May 2025, Himalaya Global Holdings Ltd. announced a strategic partnership with a leading European nutraceutical distributor to expand the availability of its standardized Brahmi extract supplements across the EU, targeting the growing cognitive health market.
- In March 2025, Dabur India Ltd. launched a new line of functional beverages infused with Brahmi, targeting health-conscious millennials and leveraging its strong brand presence in the wellness sector.
- In November 2024, Sabinsa Corp. secured a significant research grant to conduct clinical trials on a novel, high-potency Brahmi formulation, focusing on its efficacy in mitigating age-related cognitive decline.
- In September 2024, ORGANIC INDIA Pvt. Ltd. achieved certified organic status for its new large-scale Brahmi cultivation farms, aligning with increasing consumer demand for traceable and sustainably sourced herbal ingredients.
Dive into Technavio’s robust research methodology, blending expert interviews, extensive data synthesis, and validated models for unparalleled Brahmi Market insights. See full methodology.
| Market Scope | |
|---|---|
| Page number | 270 |
| Base year | 2024 |
| Historic period | 2019-2023 |
| Forecast period | 2025-2029 |
| Growth momentum & CAGR | Accelerate at a CAGR of 6.8% |
| Market growth 2025-2029 | USD 61934.9 thousand |
| Market structure | Fragmented |
| YoY growth 2024-2025(%) | 6.1% |
| Key countries | India, China, Japan, South Korea, Thailand, Indonesia, Germany, UK, France, Italy, Spain, The Netherlands, US, Canada, Mexico, Brazil, Saudi Arabia, UAE, Turkey, Argentina, Colombia, South Africa and Israel |
| Competitive landscape | Leading Companies, Market Positioning of Companies, Competitive Strategies, and Industry Risks |
Research Analyst Overview
- The brahmi market is advancing beyond its traditional roots, now defined by the rigorous application of scientific principles to herbal wellness. The focus has shifted to the standardization of herbal medicine, ensuring that every product, whether for nutraceutical formulations or pharmaceutical applications, delivers a consistent and verifiable concentration of bacosides.
- This pivot toward empirical evidence is a boardroom-level concern, as it directly influences R&D investments into the neuroprotective properties and stress reduction mechanisms of bacopa monnieri. Firms that align with stringent good manufacturing practices (gmp) for herbals and transparently validate the memory consolidation support and memory recall improvement of their herbal extracts are gaining a significant competitive edge.
- Such practices have enabled a 25% higher rate of consumer trust. This strategic direction requires a deep understanding of everything from plant extraction methods and phytochemicals to the final product's impact on cognitive performance metrics and antioxidant activity levels, all while navigating complex dietary supplement regulations.
- The market's future belongs to those who can master this blend of traditional wisdom regarding adaptogenic herbs and modern scientific validation of each nootropic ingredient and functional food additives.
What are the Key Data Covered in this Brahmi Market Research and Growth Report?
-
What is the expected growth of the Brahmi Market between 2025 and 2029?
-
USD 61.93 million, at a CAGR of 6.8%
-
-
What segmentation does the market report cover?
-
The report is segmented by Distribution Channel (Online, and Offline), Product Type (Brahmi powder, Brahmi capsules, and Brahmi oil), Application (Nutraceuticals, Pharmaceuticals, and Cosmetics) and Geography (Asia, Europe, North America, Rest of World (ROW))
-
-
Which regions are analyzed in the report?
-
Asia, Europe, North America and Rest of World (ROW)
-
-
What are the key growth drivers and market challenges?
-
Low side effects, Inadequate knowledge about Ayurvedic science in Western countries
-
-
Who are the major players in the Brahmi Market?
-
Dabur India Ltd., Hamdard Laboratories, Herbal Creations, Himalaya Global Holdings Ltd., Kerala Ayurveda, Morpheme Remedies, Natures Velvet Lifecare, ORGANIC INDIA Pvt. Ltd., Patanjali Ayurved Ltd., Riaan Wellness Pvt. Ltd., Sabinsa Corp., Shanti Natural Extracts, Shriji Herbal Products, Thangam Extracts and Vadik Herbs
-
Market Research Insights
- The market is characterized by a dynamic shift toward evidence-based natural products, with consumers increasingly seeking cognitive health supplements and natural memory boosters. Standardized extracts now constitute over 60% of ingredients in new product formulations, reflecting a clear preference for quantifiable potency.
- Formulations that blend traditional wellness ingredients with modern scientific validation show a 25% higher consumer adoption rate compared to those relying solely on historical claims. This trend highlights the importance of offering herbal brain tonics and plant-based adaptogens that deliver on the promise of holistic health remedies.
- As the demand for ayurvedic nootropics and mental clarity aids grows, success hinges on delivering products that are both effective and transparently sourced.
We can help! Our analysts can customize this brahmi market research report to meet your requirements.
 RIA -
RIA - 
