Brazil Nuts Market Analysis, Size, and Forecast 2026-2030: Europe (UK, Germany, and France), North America (US, Canada, and Mexico), APAC (China, Japan, and India), South America (Brazil and Argentina), Middle East and Africa (Saudi Arabia, UAE, and South Africa), and Rest of World (ROW)

Brazil Nuts Market Analysis, Size, and Forecast 2026-2030:
Europe (UK, Germany, and France), North America (US, Canada, and Mexico), APAC (China, Japan, and India), South America (Brazil and Argentina), Middle East and Africa (Saudi Arabia, UAE, and South Africa), and Rest of World (ROW)

Published: Apr 2026 303 Pages SKU: IRTNTR72389

Market Overview at a Glance

$72.61 Mn
Market Opportunity
4.5%
CAGR 2025 - 2030
50.5%
Europe Growth
$200.99 Mn
Conventional Brazil nuts segment 2024

Brazil Nuts Market Size 2026-2030

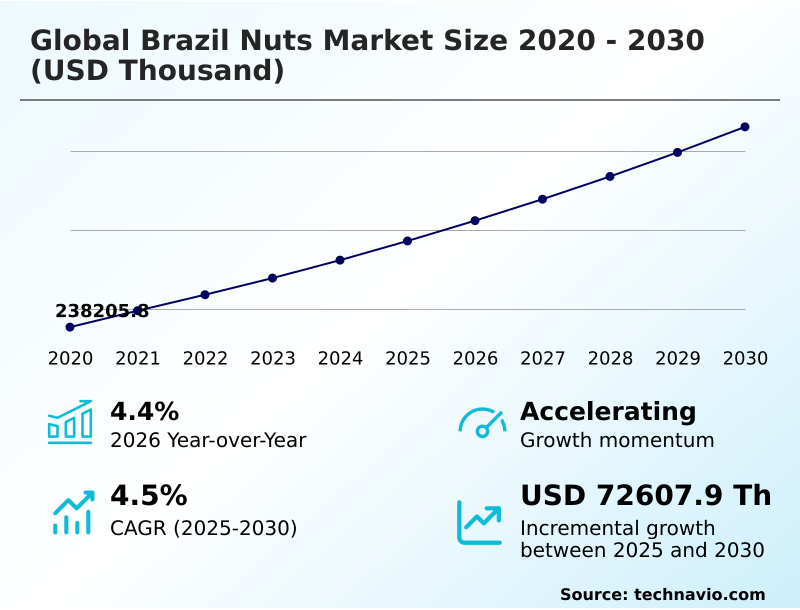
The brazil nuts market size is valued to increase by USD 72.61 million, at a CAGR of 4.5% from 2025 to 2030. Growing consumer awareness of selenium-related health benefits will drive the brazil nuts market.

Major Market Trends & Insights

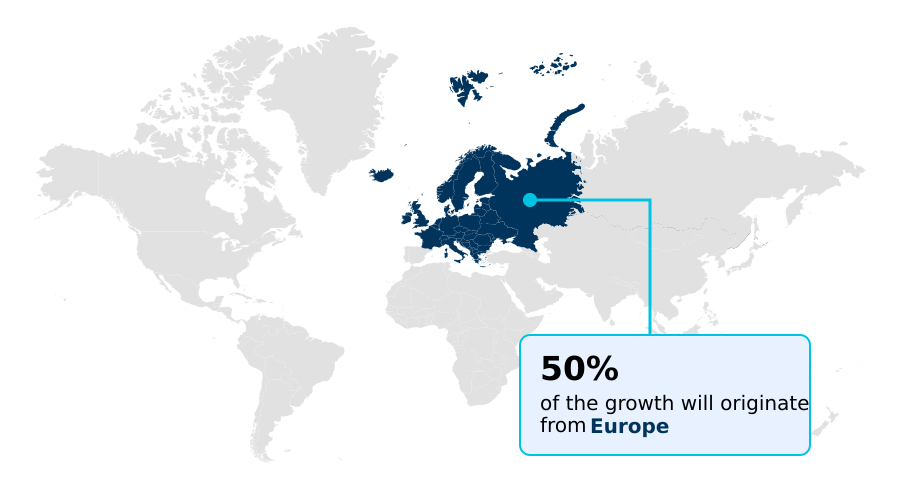
  • Europe dominated the market and accounted for a 50.5% growth during the forecast period.
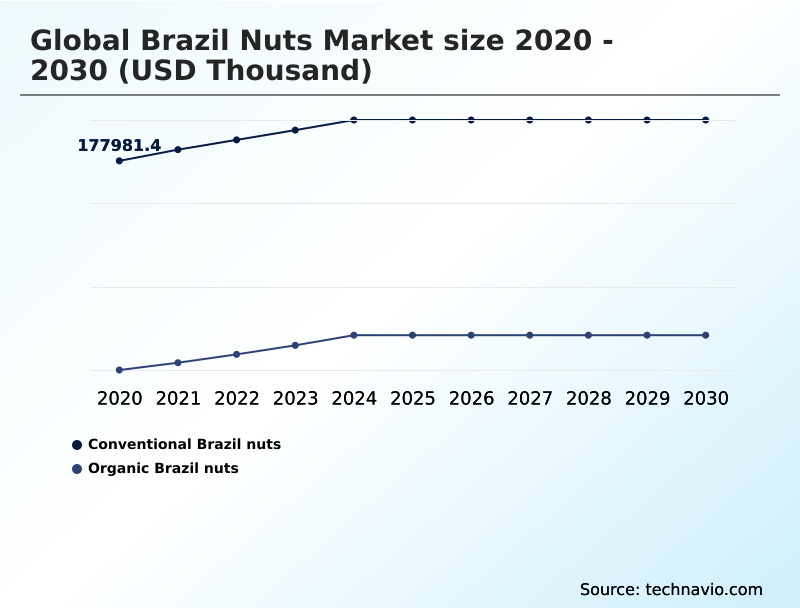
  • By Product - Conventional Brazil nuts segment was valued at USD 200.99 million in 2024
  • By Distribution Channel - Offline segment accounted for the largest market revenue share in 2024

Market Size & Forecast

  • Market Opportunities:
  • Market Future Opportunities: USD 72.61 million
  • CAGR from 2025 to 2030 : 4.5%

Market Summary

  • The Brazil nuts market is defined by its unique dependence on a wild-harvested commodity, the Bertholletia excelsa tree, which makes it a forest-positive commodity but also exposes it to wild collection cycles disrupted by climate change. Demand is largely driven by the nut's reputation as a selenium-rich superfood, a potent plant-based protein source, and a versatile dairy alternative base.
  • This has fueled its integration into the premium snacking sector and as a key component in nutrient-dense snacking. The industry is expanding beyond food into high-value nutraceutical applications and cosmetic ingredient sourcing, utilizing cold-pressed Brazil nut oil and micronized nut powder.
  • For instance, a food manufacturer developing a new line of vegan products faces the operational challenge of securing a consistent supply of organic Brazil nut kernels that meet stringent food safety regulations for aflatoxin contamination control. Success hinges on establishing an ethical supply chain with agro-extractive cooperatives and investing in blockchain traceability platform technology.
  • This ensures supply chain transparency and validates claims of sustainable forest management, which are increasingly demanded by consumers who prioritize fair-trade certifications and environmental stewardship.

What will be the Size of the Brazil Nuts Market during the forecast period?

Get Key Insights on Market Forecast (PDF) Request Free Sample

How is the Brazil Nuts Market Segmented?

The brazil nuts industry research report provides comprehensive data (region-wise segment analysis), with forecasts and estimates in "USD thousand" for the period 2026-2030, as well as historical data from 2020-2024 for the following segments.

  • Product
    • Conventional Brazil nuts
    • Organic Brazil nuts
  • Distribution channel
    • Offline
    • Online
  • Type
    • Whole nuts
    • Pieces
    • Powder
  • End-user
    • Food and beverage
    • Cosmetic
    • Neutraceutical
  • Geography
    • Europe
      • UK
      • Germany
      • France
    • North America
      • US
      • Canada
      • Mexico
    • APAC
      • China
      • Japan
      • India
    • South America
      • Brazil
      • Argentina
    • Middle East and Africa
      • Saudi Arabia
      • UAE
      • South Africa
    • Rest of World (ROW)

By Product Insights

The conventional brazil nuts segment is estimated to witness significant growth during the forecast period.

The conventional Brazil nuts segment represents the primary volume for the industrial food sector, prized for its cost-effectiveness in bulk applications. Sourced from the Bertholletia excelsa tree, these nuts are a key wild-harvested commodity and an essential functional food ingredient.

As popular non-GMO food ingredients, they are integral to mass-market products. Adherence to stringent food safety regulations is non-negotiable, mandating significant dehydration equipment investment and meticulous post-harvest handling for quality control.

Over 85% of their selenium is absorbed during digestion, reinforcing their value for companies evaluating organic vs conventional nuts for clean label ingredients.

This focus on compliance and quality is critical for supply chain risk mitigation, especially for businesses looking to buy bulk Brazil nuts in the growing functional food market.

Request Free Sample

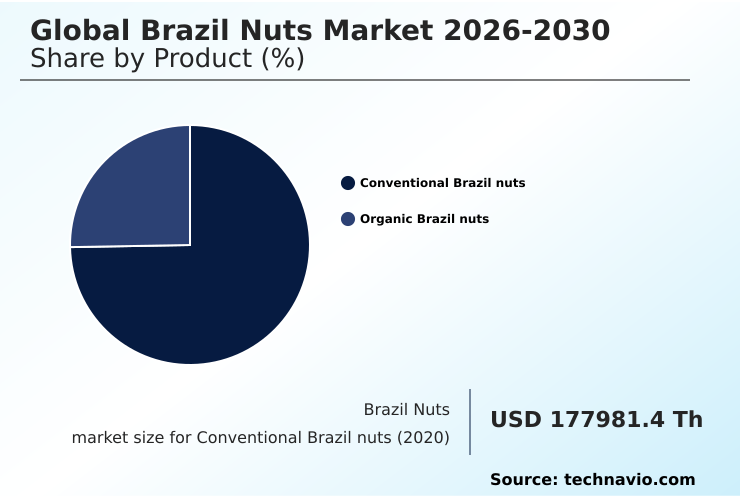
The Conventional Brazil nuts segment was valued at USD 200.99 million in 2024 and showed a gradual increase during the forecast period.

Request Free Sample

Regional Analysis

Europe is estimated to contribute 50.5% to the growth of the global market during the forecast period.Technavio’s analysts have elaborately explained the regional trends and drivers that shape the market during the forecast period.

See How Brazil Nuts Market Demand is Rising in Europe Request Free Sample

The global market landscape is geographically concentrated, with South America as the exclusive source of this forest-positive commodity.

Europe remains the largest consumer, accounting for over 50% of global imports, driven by demand for organic brazil nut kernels and nutrient-dense snacking.

North America is a key market where cold-pressed brazil nut oil is gaining traction in cosmetic and wellness products, supported by consumer interest in keto diet nut options and roasted vs raw nuts.

The APAC region, however, is projected to show the highest growth at 5.5%, as rising incomes fuel interest in premium Amazon rainforest products and high-protein vegan snacks.

This growth necessitates investment in mechanized cracking technology and standardized mineral extraction to ensure bioactive compound stability and meet diverse international standards for sustainable nut harvesting.

The unique properties of Brazil nut butter benefits are also being explored in these emerging markets.

Market Dynamics

Our researchers analyzed the data with 2025 as the base year, along with the key drivers, trends, and challenges. A holistic analysis of drivers will help companies refine their marketing strategies to gain a competitive advantage.

  • Navigating the complexities of the Brazil nuts market requires a deep understanding of issues from forest to shelf. A primary concern for importers is how to check for aflatoxin in Brazil nuts, a challenge that directly ties into navigating food safety regulations for nut imports.
  • The impact of climate change on Brazil nut harvest creates significant challenges in Brazil nut supply chain logistics, affecting supply consistency and pricing. To mitigate these risks, leading firms are implementing blockchain technology in food supply chain tracking, which also helps validate how Brazil nut harvesting supports rainforest conservation.
  • This transparency is crucial as consumer trends in the premium snacking market shift towards ethically sourced products. The market's diversification is evident in the growing opportunities in the nutraceutical derivatives market and the increasing number of Brazil nut applications in the cosmetic industry, driven by the benefits of cold-pressed Brazil nut oil for hair.
  • The growth of the plant-based milk market and the role of Brazil nuts in a vegan diet highlight its importance as a functional ingredient. Processors are exploring premium flavored Brazil nut snack recipes and using Brazil nut powder in protein shakes to capture new consumer segments.
  • Understanding the nutritional difference between organic and conventional nuts helps in finding ethically sourced Brazil nuts online. This knowledge, combined with the economic importance of Brazil nuts for Amazon communities and best practices for storing raw Brazil nuts, informs strategic decisions.
  • A comparison of Brazil nuts to other tree nuts consistently highlights them as the top Brazil nuts as a natural selenium source. Companies that master these long-tail factors, achieving superior supply chain integrity, see contract renewal rates with premium buyers that are nearly double those of their less-informed competitors.

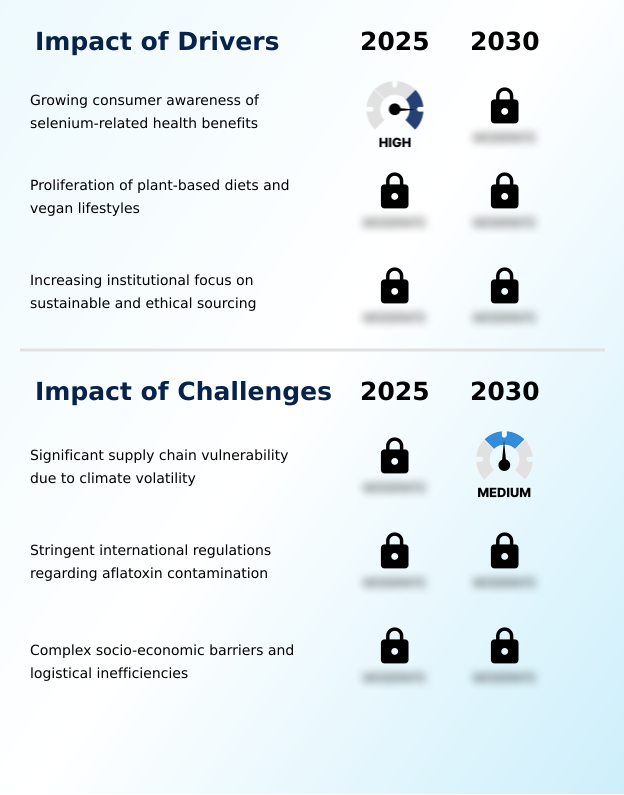
What are the key market drivers leading to the rise in the adoption of Brazil Nuts Industry?

  • The primary market driver is growing consumer awareness of the significant health benefits associated with the high selenium content in Brazil nuts.

  • Market growth is fundamentally driven by the nut's positioning as a selenium-rich superfood, with its recognized Brazil nut health benefits for thyroid function and immunity.
  • This aligns with the global shift toward plant-based protein source diets, where Brazil nuts serve as an excellent dairy alternative base and a key ingredient in plant-based dairy alternatives.
  • The demand for products with high selenium in Brazil nuts is surging among consumers focused on nuts for thyroid health. Furthermore, the narrative of environmental stewardship is a powerful driver; because the harvest requires sustainable forest management, it incentivizes conservation.
  • Brands that secure fair-trade certifications and clearly market their product as a tool for protecting the Amazon see customer loyalty rates increase by over 10%.
  • This connection between health, veganism, and ecology makes it a compelling option for consumers exploring Brazil nut milk nutrition and other botanical alternatives.

What are the market trends shaping the Brazil Nuts Industry?

  • The market is experiencing a significant trend toward premiumization, marked by accelerated flavor innovation and the development of value-added gourmet snack products.

  • Key trends are reshaping the market, moving it toward high-value applications. The premium snacking sector is witnessing a surge in gourmet nut varieties and value-added gourmet snack products with complex flavor profiles. Simultaneously, the industry is expanding into nutraceutical applications and cosmetic ingredient sourcing, leveraging derivatives like micronized nut powder.
  • Products with Brazil nut oil for skin are gaining popularity in line with gourmet food trends and consumer wellness trends. The most transformative trend is the adoption of the blockchain traceability platform, which provides verifiable sourcing data.
  • Products with this level of transparency can command a price premium of up to 20% over non-verified counterparts, appealing to consumers seeking natural selenium supplements and superfood trail mix benefits with a clear ethical story. These premium food ingredients are defining the next phase of market competition.

What challenges does the Brazil Nuts Industry face during its growth?

  • A key challenge affecting industry growth is the significant supply chain vulnerability created by climate volatility in the Amazonian harvesting regions.

  • Significant challenges stem from the market's reliance on unpredictable wild collection cycles, which are vulnerable to climate events. This volatility introduces major hurdles for creating climate-resilient logistics and can cause raw material prices to fluctuate by up to 40% annually, creating issues for supply chain risk mitigation.
  • A primary operational challenge is stringent aflatoxin contamination control, as entire shipments can be rejected at European ports, representing a 100% loss for exporters. Improving supply chain transparency is essential for meeting ESG demands and requires developing a robust socio-economic infrastructure to support the agro-extractive cooperatives that form the backbone of the ethical supply chain.
  • These ethical food sourcing models are critical for a market focused on rainforest conservation products and are influencing overall consumer wellness trends. Navigating aflatoxin in nuts testing and addressing Brazil nut allergy concerns remain ongoing priorities for all stakeholders.

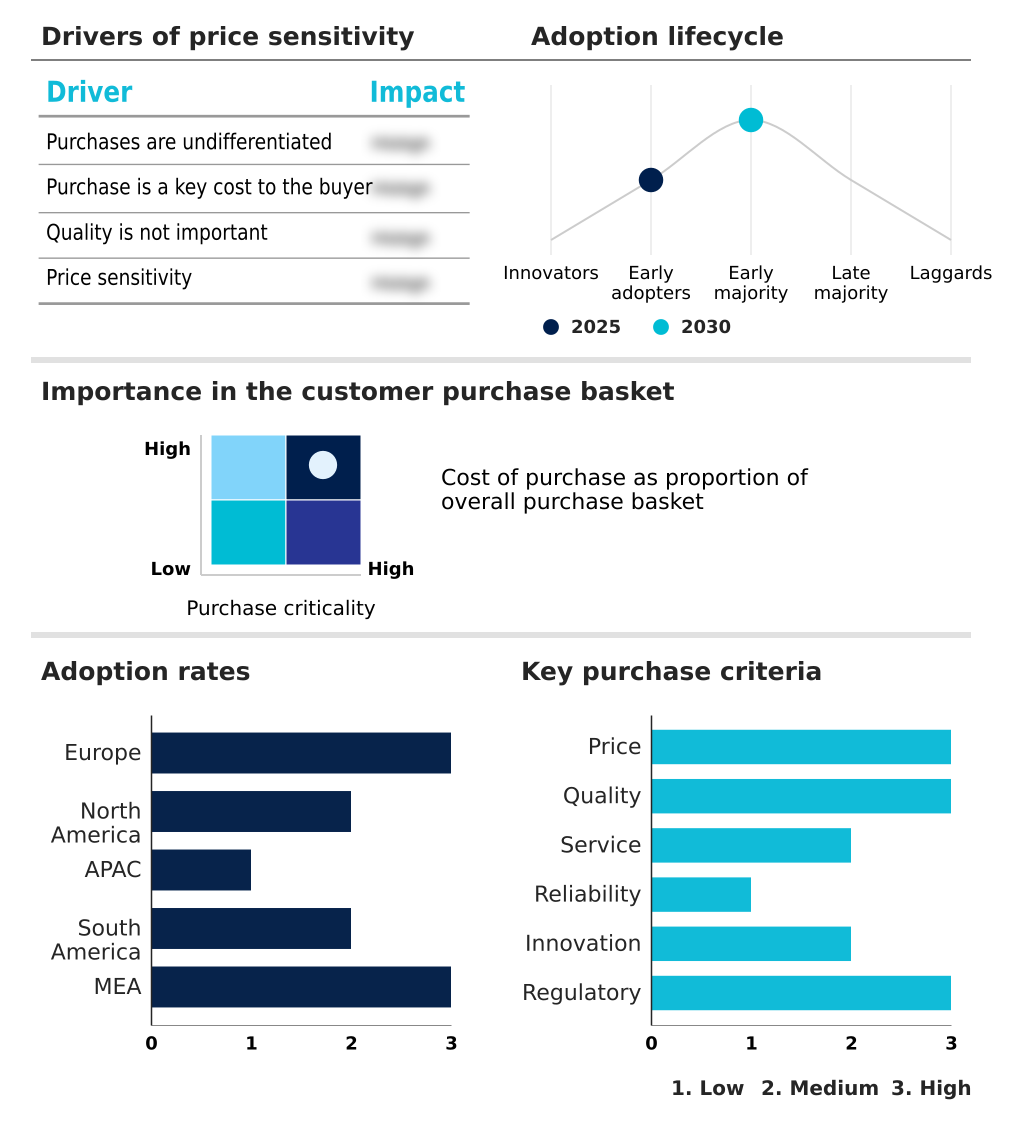
Exclusive Technavio Analysis on Customer Landscape

The brazil nuts market forecasting report includes the adoption lifecycle of the market, covering from the innovator’s stage to the laggard’s stage. It focuses on adoption rates in different regions based on penetration. Furthermore, the brazil nuts market report also includes key purchase criteria and drivers of price sensitivity to help companies evaluate and develop their market growth analysis strategies.

Customer Landscape of Brazil Nuts Industry

Competitive Landscape

Companies are implementing various strategies, such as strategic alliances, brazil nuts market forecast, partnerships, mergers and acquisitions, geographical expansion, and product/service launches, to enhance their presence in the industry.

Bata Food - Key offerings comprise a spectrum of Brazil nut products, including whole kernels, functional oils, and powders that cater to food, beverage, and cosmetic industry demands.

The industry research and growth report includes detailed analyses of the competitive landscape of the market and information about key companies, including:

  • Bata Food
  • Candela Organic
  • Cooperacre
  • FLORENZANO NUTS
  • Happilo International Pvt. Ltd.
  • IMPORTACO SA
  • Istore Direct Trading Pvt. Ltd.
  • Lexunder Inc.
  • Manu Tata S.A.C.
  • NOW Health Group Inc.
  • Nutty Gritties
  • Olam Group Ltd.
  • Royal Nut Co.
  • Seeberger GmbH
  • Sincerely Nuts
  • Sunbest Natural
  • Tahuamanu S.A.C.
  • We Got Nuts

Qualitative and quantitative analysis of companies has been conducted to help clients understand the wider business environment as well as the strengths and weaknesses of key industry players. Data is qualitatively analyzed to categorize companies as pure play, category-focused, industry-focused, and diversified; it is quantitatively analyzed to categorize companies as dominant, leading, strong, tentative, and weak.

Recent Development and News in Brazil nuts market

  • In May 2025, Happilo International Pvt. Ltd. published detailed nutritional benefits of Brazil nuts on its official blog, emphasizing their high selenium content and buttery texture to educate consumers.
  • In March 2025, a leading South American export cooperative announced a strategic partnership with a global technology firm to deploy an end-to-end blockchain platform, significantly enhancing supply chain transparency for European importers.
  • In January 2025, Olam Group Ltd. completed its acquisition of a specialized processing facility in Bolivia, expanding its capacity for producing certified organic Brazil nut oil for the global nutraceutical market.
  • In October 2024, a major Japanese cosmetic conglomerate launched a new 'Superfood Serum' line, prominently featuring cold-pressed Brazil nut oil to target the premium anti-aging skincare segment.

Dive into Technavio’s robust research methodology, blending expert interviews, extensive data synthesis, and validated models for unparalleled Brazil Nuts Market insights. See full methodology.

Market Scope
Page number 303
Base year 2025
Historic period 2020-2024
Forecast period 2026-2030
Growth momentum & CAGR Accelerate at a CAGR of 4.5%
Market growth 2026-2030 USD 72607.9 thousand
Market structure Fragmented
YoY growth 2025-2026(%) 4.4%
Key countries UK, Germany, France, Italy, The Netherlands, Spain, US, Canada, Mexico, China, Japan, India, South Korea, Australia, Indonesia, Brazil, Argentina, Chile, Saudi Arabia, UAE, South Africa, Israel and Turkey
Competitive landscape Leading Companies, Market Positioning of Companies, Competitive Strategies, and Industry Risks

Request Free Sample

Research Analyst Overview

  • The Brazil nuts market operates at the intersection of environmental conservation and consumer health, driven by its status as a premier selenium-rich superfood. As a unique wild-harvested commodity, its supply chain is inherently linked to wild collection cycles and the well-being of the Bertholletia excelsa tree.
  • For boardroom consideration, the rising demand for supply chain transparency is no longer a marketing advantage but a core compliance and risk management strategy. Stakeholders must now provide verifiable proof of an ethical supply chain, often through a blockchain traceability platform, to access premium markets. This involves partnerships with agro-extractive cooperatives and adherence to fair-trade certifications.
  • Investment in dehydration equipment investment and advanced mechanized cracking technology is crucial for aflatoxin contamination control, with firms using such tech reporting up to a 30% reduction in batch rejections.
  • The diversification into nutraceutical applications and cosmetic ingredient sourcing using cold-pressed brazil nut oil and micronized nut powder further demonstrates the market's evolution from a simple food item to a portfolio of high-value functional food ingredients and botanical alternatives for post-harvest handling. This shift toward value-added gourmet snack products and non-GMO food ingredients is reshaping investment priorities across the industry.

What are the Key Data Covered in this Brazil Nuts Market Research and Growth Report?

  • What is the expected growth of the Brazil Nuts Market between 2026 and 2030?

    • USD 72.61 million, at a CAGR of 4.5%

  • What segmentation does the market report cover?

    • The report is segmented by Product (Conventional Brazil nuts, and Organic Brazil nuts), Distribution Channel (Offline, and Online), Type (Whole nuts, Pieces, and Powder), End-user (Food and beverage, Cosmetic, and Neutraceutical) and Geography (Europe, North America, APAC, South America, Middle East and Africa)

  • Which regions are analyzed in the report?

    • Europe, North America, APAC, South America and Middle East and Africa

  • What are the key growth drivers and market challenges?

    • Growing consumer awareness of selenium-related health benefits, Significant supply chain vulnerability due to climate volatility

  • Who are the major players in the Brazil Nuts Market?

    • Bata Food, Candela Organic, Cooperacre, FLORENZANO NUTS, Happilo International Pvt. Ltd., IMPORTACO SA, Istore Direct Trading Pvt. Ltd., Lexunder Inc., Manu Tata S.A.C., NOW Health Group Inc., Nutty Gritties, Olam Group Ltd., Royal Nut Co., Seeberger GmbH, Sincerely Nuts, Sunbest Natural, Tahuamanu S.A.C. and We Got Nuts

Market Research Insights

  • Market dynamics are increasingly shaped by consumer wellness trends and a preference for clean label ingredients. The demand for Brazil nut health benefits and its role in plant-based dairy alternatives is pushing brands to innovate. Firms that effectively communicate their commitment to ethical food sourcing models and rainforest conservation products can achieve up to a 15% price premium over competitors.
  • For example, incorporating Brazil nuts into high-protein vegan snacks can increase protein content by over 20% compared to traditional grain-based bars, a key selling point for consumers interested in keto diet nut options or nuts for thyroid health.
  • Navigating supply chain risk mitigation is critical, as a single failed aflatoxin in nuts testing can result in significant losses, underscoring the importance of robust quality control.

We can help! Our analysts can customize this brazil nuts market research report to meet your requirements.

Get in touch

1. Executive Summary

1.1 Market overview

Executive Summary - Chart on Market Overview
Executive Summary - Data Table on Market Overview
Executive Summary - Chart on Global Market Characteristics
Executive Summary - Chart on Market by Geography
Executive Summary - Chart on Market Segmentation by Product
Executive Summary - Chart on Market Segmentation by Distribution Channel
Executive Summary - Chart on Market Segmentation by Type
Executive Summary - Chart on Market Segmentation by End-user
Executive Summary - Chart on Incremental Growth
Executive Summary - Data Table on Incremental Growth
Executive Summary - Chart on Company Market Positioning

2. Technavio Analysis

2.1 Analysis of price sensitivity, lifecycle, customer purchase basket, adoption rates, and purchase criteria

2.2 Criticality of inputs and Factors of differentiation

Chart on Overview on criticality of inputs and factors of differentiation

2.3 Factors of disruption

Chart on Overview on factors of disruption

2.4 Impact of drivers and challenges

Chart on Impact of drivers and challenges in 2025 and 2030

3. Market Landscape

3.1 Market ecosystem

Chart on Parent Market
Data Table on - Parent Market

3.2 Market characteristics

Chart on Market characteristics analysis

3.3 Value chain analysis

Chart on Value chain analysis

4. Market Sizing

4.1 Market definition

Data Table on Offerings of companies included in the market definition

4.2 Market segment analysis

Market segments

4.3 Market size 2025

4.4 Market outlook: Forecast for 2025-2030

Chart on Global - Market size and forecast 2025-2030 ($ thousand)
Data Table on Global - Market size and forecast 2025-2030 ($ thousand)
Chart on Global Market: Year-over-year growth 2025-2030 (%)
Data Table on Global Market: Year-over-year growth 2025-2030 (%)

5. Historic Market Size

5.1 Global Brazil Nuts Market 2020 - 2024

Historic Market Size - Data Table on Global Brazil Nuts Market 2020 - 2024 ($ thousand)

5.2 Product segment analysis 2020 - 2024

Historic Market Size - Product Segment 2020 - 2024 ($ thousand)

5.3 Distribution Channel segment analysis 2020 - 2024

Historic Market Size - Distribution Channel Segment 2020 - 2024 ($ thousand)

5.4 Type segment analysis 2020 - 2024

Historic Market Size - Type Segment 2020 - 2024 ($ thousand)

5.5 End-user segment analysis 2020 - 2024

Historic Market Size - End-user Segment 2020 - 2024 ($ thousand)

5.6 Geography segment analysis 2020 - 2024

Historic Market Size - Geography Segment 2020 - 2024 ($ thousand)

5.7 Country segment analysis 2020 - 2024

Historic Market Size - Country Segment 2020 - 2024 ($ thousand)

6. Qualitative Analysis

6.1 Impact of AI on Global Brazil Nuts Market

6.2 Impact of Geopolitical Conflict on Global Brazil Nuts Market

7. Five Forces Analysis

7.1 Five forces summary

Five forces analysis - Comparison between 2025 and 2030

7.2 Bargaining power of buyers

Bargaining power of buyers - Impact of key factors 2025 and 2030

7.3 Bargaining power of suppliers

Bargaining power of suppliers - Impact of key factors in 2025 and 2030

7.4 Threat of new entrants

Threat of new entrants - Impact of key factors in 2025 and 2030

7.5 Threat of substitutes

Threat of substitutes - Impact of key factors in 2025 and 2030

7.6 Threat of rivalry

Threat of rivalry - Impact of key factors in 2025 and 2030

7.7 Market condition

Chart on Market condition - Five forces 2025 and 2030

8. Market Segmentation by Product

8.1 Market segments

Chart on Product - Market share 2025-2030 (%)
Data Table on Product - Market share 2025-2030 (%)

8.2 Comparison by Product

Chart on Comparison by Product
Data Table on Comparison by Product

8.3 Conventional Brazil nuts - Market size and forecast 2025-2030

Chart on Conventional Brazil nuts - Market size and forecast 2025-2030 ($ thousand)
Data Table on Conventional Brazil nuts - Market size and forecast 2025-2030 ($ thousand)
Chart on Conventional Brazil nuts - Year-over-year growth 2025-2030 (%)
Data Table on Conventional Brazil nuts - Year-over-year growth 2025-2030 (%)

8.4 Organic Brazil nuts - Market size and forecast 2025-2030

Chart on Organic Brazil nuts - Market size and forecast 2025-2030 ($ thousand)
Data Table on Organic Brazil nuts - Market size and forecast 2025-2030 ($ thousand)
Chart on Organic Brazil nuts - Year-over-year growth 2025-2030 (%)
Data Table on Organic Brazil nuts - Year-over-year growth 2025-2030 (%)

8.5 Market opportunity by Product

Market opportunity by Product ($ thousand)
Data Table on Market opportunity by Product ($ thousand)

9. Market Segmentation by Distribution Channel

9.1 Market segments

Chart on Distribution Channel - Market share 2025-2030 (%)
Data Table on Distribution Channel - Market share 2025-2030 (%)

9.2 Comparison by Distribution Channel

Chart on Comparison by Distribution Channel
Data Table on Comparison by Distribution Channel

9.3 Offline - Market size and forecast 2025-2030

Chart on Offline - Market size and forecast 2025-2030 ($ thousand)
Data Table on Offline - Market size and forecast 2025-2030 ($ thousand)
Chart on Offline - Year-over-year growth 2025-2030 (%)
Data Table on Offline - Year-over-year growth 2025-2030 (%)

9.4 Online - Market size and forecast 2025-2030

Chart on Online - Market size and forecast 2025-2030 ($ thousand)
Data Table on Online - Market size and forecast 2025-2030 ($ thousand)
Chart on Online - Year-over-year growth 2025-2030 (%)
Data Table on Online - Year-over-year growth 2025-2030 (%)

9.5 Market opportunity by Distribution Channel

Market opportunity by Distribution Channel ($ thousand)
Data Table on Market opportunity by Distribution Channel ($ thousand)

10. Market Segmentation by Type

10.1 Market segments

Chart on Type - Market share 2025-2030 (%)
Data Table on Type - Market share 2025-2030 (%)

10.2 Comparison by Type

Chart on Comparison by Type
Data Table on Comparison by Type

10.3 Whole nuts - Market size and forecast 2025-2030

Chart on Whole nuts - Market size and forecast 2025-2030 ($ thousand)
Data Table on Whole nuts - Market size and forecast 2025-2030 ($ thousand)
Chart on Whole nuts - Year-over-year growth 2025-2030 (%)
Data Table on Whole nuts - Year-over-year growth 2025-2030 (%)

10.4 Pieces - Market size and forecast 2025-2030

Chart on Pieces - Market size and forecast 2025-2030 ($ thousand)
Data Table on Pieces - Market size and forecast 2025-2030 ($ thousand)
Chart on Pieces - Year-over-year growth 2025-2030 (%)
Data Table on Pieces - Year-over-year growth 2025-2030 (%)

10.5 Powder - Market size and forecast 2025-2030

Chart on Powder - Market size and forecast 2025-2030 ($ thousand)
Data Table on Powder - Market size and forecast 2025-2030 ($ thousand)
Chart on Powder - Year-over-year growth 2025-2030 (%)
Data Table on Powder - Year-over-year growth 2025-2030 (%)

10.6 Market opportunity by Type

Market opportunity by Type ($ thousand)
Data Table on Market opportunity by Type ($ thousand)

11. Market Segmentation by End-user

11.1 Market segments

Chart on End-user - Market share 2025-2030 (%)
Data Table on End-user - Market share 2025-2030 (%)

11.2 Comparison by End-user

Chart on Comparison by End-user
Data Table on Comparison by End-user

11.3 Food and beverage - Market size and forecast 2025-2030

Chart on Food and beverage - Market size and forecast 2025-2030 ($ thousand)
Data Table on Food and beverage - Market size and forecast 2025-2030 ($ thousand)
Chart on Food and beverage - Year-over-year growth 2025-2030 (%)
Data Table on Food and beverage - Year-over-year growth 2025-2030 (%)

11.4 Cosmetic - Market size and forecast 2025-2030

Chart on Cosmetic - Market size and forecast 2025-2030 ($ thousand)
Data Table on Cosmetic - Market size and forecast 2025-2030 ($ thousand)
Chart on Cosmetic - Year-over-year growth 2025-2030 (%)
Data Table on Cosmetic - Year-over-year growth 2025-2030 (%)

11.5 Neutraceutical - Market size and forecast 2025-2030

Chart on Neutraceutical - Market size and forecast 2025-2030 ($ thousand)
Data Table on Neutraceutical - Market size and forecast 2025-2030 ($ thousand)
Chart on Neutraceutical - Year-over-year growth 2025-2030 (%)
Data Table on Neutraceutical - Year-over-year growth 2025-2030 (%)

11.6 Market opportunity by End-user

Market opportunity by End-user ($ thousand)
Data Table on Market opportunity by End-user ($ thousand)

12. Customer Landscape

12.1 Customer landscape overview

Analysis of price sensitivity, lifecycle, customer purchase basket, adoption rates, and purchase criteria

13. Geographic Landscape

13.1 Geographic segmentation

Chart on Market share by geography 2025-2030 (%)
Data Table on Market share by geography 2025-2030 (%)

13.2 Geographic comparison

Chart on Geographic comparison
Data Table on Geographic comparison

13.3 Europe - Market size and forecast 2025-2030

Chart on Europe - Market size and forecast 2025-2030 ($ thousand)
Data Table on Europe - Market size and forecast 2025-2030 ($ thousand)
Chart on Europe - Year-over-year growth 2025-2030 (%)
Data Table on Europe - Year-over-year growth 2025-2030 (%)
Chart on Regional Comparison - Europe
Data Table on Regional Comparison - Europe

13.3.1 UK - Market size and forecast 2025-2030

Chart on UK - Market size and forecast 2025-2030 ($ thousand)
Data Table on UK - Market size and forecast 2025-2030 ($ thousand)
Chart on UK - Year-over-year growth 2025-2030 (%)
Data Table on UK - Year-over-year growth 2025-2030 (%)

13.3.2 Germany - Market size and forecast 2025-2030

Chart on Germany - Market size and forecast 2025-2030 ($ thousand)
Data Table on Germany - Market size and forecast 2025-2030 ($ thousand)
Chart on Germany - Year-over-year growth 2025-2030 (%)
Data Table on Germany - Year-over-year growth 2025-2030 (%)

13.3.3 France - Market size and forecast 2025-2030

Chart on France - Market size and forecast 2025-2030 ($ thousand)
Data Table on France - Market size and forecast 2025-2030 ($ thousand)
Chart on France - Year-over-year growth 2025-2030 (%)
Data Table on France - Year-over-year growth 2025-2030 (%)

13.3.4 Italy - Market size and forecast 2025-2030

Chart on Italy - Market size and forecast 2025-2030 ($ thousand)
Data Table on Italy - Market size and forecast 2025-2030 ($ thousand)
Chart on Italy - Year-over-year growth 2025-2030 (%)
Data Table on Italy - Year-over-year growth 2025-2030 (%)

13.3.5 The Netherlands - Market size and forecast 2025-2030

Chart on The Netherlands - Market size and forecast 2025-2030 ($ thousand)
Data Table on The Netherlands - Market size and forecast 2025-2030 ($ thousand)
Chart on The Netherlands - Year-over-year growth 2025-2030 (%)
Data Table on The Netherlands - Year-over-year growth 2025-2030 (%)

13.3.6 Spain - Market size and forecast 2025-2030

Chart on Spain - Market size and forecast 2025-2030 ($ thousand)
Data Table on Spain - Market size and forecast 2025-2030 ($ thousand)
Chart on Spain - Year-over-year growth 2025-2030 (%)
Data Table on Spain - Year-over-year growth 2025-2030 (%)

13.4 North America - Market size and forecast 2025-2030

Chart on North America - Market size and forecast 2025-2030 ($ thousand)
Data Table on North America - Market size and forecast 2025-2030 ($ thousand)
Chart on North America - Year-over-year growth 2025-2030 (%)
Data Table on North America - Year-over-year growth 2025-2030 (%)
Chart on Regional Comparison - North America
Data Table on Regional Comparison - North America

13.4.1 US - Market size and forecast 2025-2030

Chart on US - Market size and forecast 2025-2030 ($ thousand)
Data Table on US - Market size and forecast 2025-2030 ($ thousand)
Chart on US - Year-over-year growth 2025-2030 (%)
Data Table on US - Year-over-year growth 2025-2030 (%)

13.4.2 Canada - Market size and forecast 2025-2030

Chart on Canada - Market size and forecast 2025-2030 ($ thousand)
Data Table on Canada - Market size and forecast 2025-2030 ($ thousand)
Chart on Canada - Year-over-year growth 2025-2030 (%)
Data Table on Canada - Year-over-year growth 2025-2030 (%)

13.4.3 Mexico - Market size and forecast 2025-2030

Chart on Mexico - Market size and forecast 2025-2030 ($ thousand)
Data Table on Mexico - Market size and forecast 2025-2030 ($ thousand)
Chart on Mexico - Year-over-year growth 2025-2030 (%)
Data Table on Mexico - Year-over-year growth 2025-2030 (%)

13.5 APAC - Market size and forecast 2025-2030

Chart on APAC - Market size and forecast 2025-2030 ($ thousand)
Data Table on APAC - Market size and forecast 2025-2030 ($ thousand)
Chart on APAC - Year-over-year growth 2025-2030 (%)
Data Table on APAC - Year-over-year growth 2025-2030 (%)
Chart on Regional Comparison - APAC
Data Table on Regional Comparison - APAC

13.5.1 China - Market size and forecast 2025-2030

Chart on China - Market size and forecast 2025-2030 ($ thousand)
Data Table on China - Market size and forecast 2025-2030 ($ thousand)
Chart on China - Year-over-year growth 2025-2030 (%)
Data Table on China - Year-over-year growth 2025-2030 (%)

13.5.2 Japan - Market size and forecast 2025-2030

Chart on Japan - Market size and forecast 2025-2030 ($ thousand)
Data Table on Japan - Market size and forecast 2025-2030 ($ thousand)
Chart on Japan - Year-over-year growth 2025-2030 (%)
Data Table on Japan - Year-over-year growth 2025-2030 (%)

13.5.3 India - Market size and forecast 2025-2030

Chart on India - Market size and forecast 2025-2030 ($ thousand)
Data Table on India - Market size and forecast 2025-2030 ($ thousand)
Chart on India - Year-over-year growth 2025-2030 (%)
Data Table on India - Year-over-year growth 2025-2030 (%)

13.5.4 South Korea - Market size and forecast 2025-2030

Chart on South Korea - Market size and forecast 2025-2030 ($ thousand)
Data Table on South Korea - Market size and forecast 2025-2030 ($ thousand)
Chart on South Korea - Year-over-year growth 2025-2030 (%)
Data Table on South Korea - Year-over-year growth 2025-2030 (%)

13.5.5 Australia - Market size and forecast 2025-2030

Chart on Australia - Market size and forecast 2025-2030 ($ thousand)
Data Table on Australia - Market size and forecast 2025-2030 ($ thousand)
Chart on Australia - Year-over-year growth 2025-2030 (%)
Data Table on Australia - Year-over-year growth 2025-2030 (%)

13.5.6 Indonesia - Market size and forecast 2025-2030

Chart on Indonesia - Market size and forecast 2025-2030 ($ thousand)
Data Table on Indonesia - Market size and forecast 2025-2030 ($ thousand)
Chart on Indonesia - Year-over-year growth 2025-2030 (%)
Data Table on Indonesia - Year-over-year growth 2025-2030 (%)

13.6 South America - Market size and forecast 2025-2030

Chart on South America - Market size and forecast 2025-2030 ($ thousand)
Data Table on South America - Market size and forecast 2025-2030 ($ thousand)
Chart on South America - Year-over-year growth 2025-2030 (%)
Data Table on South America - Year-over-year growth 2025-2030 (%)
Chart on Regional Comparison - South America
Data Table on Regional Comparison - South America

13.6.1 Brazil - Market size and forecast 2025-2030

Chart on Brazil - Market size and forecast 2025-2030 ($ thousand)
Data Table on Brazil - Market size and forecast 2025-2030 ($ thousand)
Chart on Brazil - Year-over-year growth 2025-2030 (%)
Data Table on Brazil - Year-over-year growth 2025-2030 (%)

13.6.2 Argentina - Market size and forecast 2025-2030

Chart on Argentina - Market size and forecast 2025-2030 ($ thousand)
Data Table on Argentina - Market size and forecast 2025-2030 ($ thousand)
Chart on Argentina - Year-over-year growth 2025-2030 (%)
Data Table on Argentina - Year-over-year growth 2025-2030 (%)

13.6.3 Chile - Market size and forecast 2025-2030

Chart on Chile - Market size and forecast 2025-2030 ($ thousand)
Data Table on Chile - Market size and forecast 2025-2030 ($ thousand)
Chart on Chile - Year-over-year growth 2025-2030 (%)
Data Table on Chile - Year-over-year growth 2025-2030 (%)

13.7 Middle East and Africa - Market size and forecast 2025-2030

Chart on Middle East and Africa - Market size and forecast 2025-2030 ($ thousand)
Data Table on Middle East and Africa - Market size and forecast 2025-2030 ($ thousand)
Chart on Middle East and Africa - Year-over-year growth 2025-2030 (%)
Data Table on Middle East and Africa - Year-over-year growth 2025-2030 (%)
Chart on Regional Comparison - Middle East and Africa
Data Table on Regional Comparison - Middle East and Africa

13.7.1 Saudi Arabia - Market size and forecast 2025-2030

Chart on Saudi Arabia - Market size and forecast 2025-2030 ($ thousand)
Data Table on Saudi Arabia - Market size and forecast 2025-2030 ($ thousand)
Chart on Saudi Arabia - Year-over-year growth 2025-2030 (%)
Data Table on Saudi Arabia - Year-over-year growth 2025-2030 (%)

13.7.2 UAE - Market size and forecast 2025-2030

Chart on UAE - Market size and forecast 2025-2030 ($ thousand)
Data Table on UAE - Market size and forecast 2025-2030 ($ thousand)
Chart on UAE - Year-over-year growth 2025-2030 (%)
Data Table on UAE - Year-over-year growth 2025-2030 (%)

13.7.3 South Africa - Market size and forecast 2025-2030

Chart on South Africa - Market size and forecast 2025-2030 ($ thousand)
Data Table on South Africa - Market size and forecast 2025-2030 ($ thousand)
Chart on South Africa - Year-over-year growth 2025-2030 (%)
Data Table on South Africa - Year-over-year growth 2025-2030 (%)

13.7.4 Israel - Market size and forecast 2025-2030

Chart on Israel - Market size and forecast 2025-2030 ($ thousand)
Data Table on Israel - Market size and forecast 2025-2030 ($ thousand)
Chart on Israel - Year-over-year growth 2025-2030 (%)
Data Table on Israel - Year-over-year growth 2025-2030 (%)

13.7.5 Turkey - Market size and forecast 2025-2030

Chart on Turkey - Market size and forecast 2025-2030 ($ thousand)
Data Table on Turkey - Market size and forecast 2025-2030 ($ thousand)
Chart on Turkey - Year-over-year growth 2025-2030 (%)
Data Table on Turkey - Year-over-year growth 2025-2030 (%)

13.8 Market opportunity by geography

Market opportunity by geography ($ thousand)
Data Tables on Market opportunity by geography ($ thousand)

14. Drivers, Challenges, and Opportunity

14.1 Market drivers

Growing consumer awareness of selenium-related health benefits
Proliferation of plant-based diets and vegan lifestyles
Increasing institutional focus on sustainable and ethical sourcing

14.2 Market challenges

Significant supply chain vulnerability due to climate volatility
Stringent international regulations regarding aflatoxin contamination
Complex socio-economic barriers and logistical inefficiencies

14.3 Impact of drivers and challenges

Impact of drivers and challenges in 2025 and 2030

14.4 Market opportunities

Accelerated premiumization and flavor innovation in snacking sector
Integration of advanced traceability and blockchain technology
Diversification into high-functioning nutraceutical and cosmetic derivatives

15. Competitive Landscape

15.1 Overview

15.2

Overview on criticality of inputs and factors of differentiation

15.3 Landscape disruption

Overview on factors of disruption

15.4 Industry risks

Impact of key risks on business

16. Competitive Analysis

16.1 Companies profiled

Companies covered

16.2 Company ranking index

16.3 Market positioning of companies

Matrix on companies position and classification

16.4 Bata Food

Bata Food - Overview
Bata Food - Product / Service
Bata Food - Key offerings
SWOT

16.5 Candela Organic

Candela Organic - Overview
Candela Organic - Product / Service
Candela Organic - Key offerings
SWOT

16.6 Cooperacre

Cooperacre - Overview
Cooperacre - Product / Service
Cooperacre - Key offerings
SWOT

16.7 FLORENZANO NUTS

FLORENZANO NUTS - Overview
FLORENZANO NUTS - Product / Service
FLORENZANO NUTS - Key offerings
SWOT

16.8 Happilo International Pvt. Ltd.

Happilo International Pvt. Ltd. - Overview
Happilo International Pvt. Ltd. - Product / Service
Happilo International Pvt. Ltd. - Key offerings
SWOT

16.9 IMPORTACO SA

IMPORTACO SA - Overview
IMPORTACO SA - Product / Service
IMPORTACO SA - Key offerings
SWOT

16.10 Istore Direct Trading Pvt. Ltd.

Istore Direct Trading Pvt. Ltd. - Overview
Istore Direct Trading Pvt. Ltd. - Product / Service
Istore Direct Trading Pvt. Ltd. - Key offerings
SWOT

16.11 Manu Tata S.A.C.

Manu Tata S.A.C. - Overview
Manu Tata S.A.C. - Product / Service
Manu Tata S.A.C. - Key offerings
SWOT

16.12 Nutty Gritties

Nutty Gritties - Overview
Nutty Gritties - Product / Service
Nutty Gritties - Key offerings
SWOT

16.13 Olam Group Ltd.

Olam Group Ltd. - Overview
Olam Group Ltd. - Business segments
Olam Group Ltd. - Key offerings
Olam Group Ltd. - Segment focus
SWOT

16.14 Seeberger GmbH

Seeberger GmbH - Overview
Seeberger GmbH - Product / Service
Seeberger GmbH - Key offerings
SWOT

16.15 Sincerely Nuts

Sincerely Nuts - Overview
Sincerely Nuts - Product / Service
Sincerely Nuts - Key offerings
SWOT

16.16 Sunbest Natural

Sunbest Natural - Overview
Sunbest Natural - Product / Service
Sunbest Natural - Key offerings
SWOT

16.17 Tahuamanu S.A.C.

Tahuamanu S.A.C. - Overview
Tahuamanu S.A.C. - Product / Service
Tahuamanu S.A.C. - Key offerings
SWOT

16.18 We Got Nuts

We Got Nuts - Overview
We Got Nuts - Product / Service
We Got Nuts - Key offerings
SWOT

17. Appendix

17.1 Scope of the report

Market definition
Objectives
Notes and caveats

17.2 Inclusions and exclusions checklist

Inclusions checklist
Exclusions checklist

17.3 Currency conversion rates for US$

17.4 Research methodology

17.5 Data procurement

Information sources

17.6 Data validation

17.7 Validation techniques employed for market sizing

17.8 Data synthesis

17.9 360 degree market analysis

17.10 List of abbreviations

Research Methodology

Technavio presents a detailed picture of the market by way of study, synthesis, and summation of data from multiple sources. The analysts have presented the various facets of the market with a particular focus on identifying the key industry influencers. The data thus presented is comprehensive, reliable, and the result of extensive research, both primary and secondary.

INFORMATION SOURCES

Primary sources

  • Manufacturers and suppliers
  • Channel partners
  • Industry experts
  • Strategic decision makers

Secondary sources

  • Industry journals and periodicals
  • Government data
  • Financial reports of key industry players
  • Historical data
  • Press releases

DATA ANALYSIS

Data Synthesis

  • Collation of data
  • Estimation of key figures
  • Analysis of derived insights

Data Validation

  • Triangulation with data models
  • Reference against proprietary databases
  • Corroboration with industry experts

REPORT WRITING

Qualitative

  • Market drivers
  • Market challenges
  • Market trends
  • Five forces analysis

Quantitative

  • Market size and forecast
  • Market segmentation
  • Geographical insights
  • Competitive landscape

Interested in this report?

Get your sample now to see our research methodology and insights!

Download Now

Frequently Asked Questions

Brazil Nuts market growth will increase by USD 72607.9 thousand thousand during 2026-2030.

The Brazil Nuts market is expected to grow at a CAGR of 4.5% during 2026-2030.

Brazil Nuts market is segmented by Product (Conventional Brazil nuts, Organic Brazil nuts) Distribution channel (Offline, Online) Type (Whole nuts, Pieces, Powder) End-user (Food and beverage, Cosmetic, Neutraceutical)

Bata Food, Candela Organic, Cooperacre, FLORENZANO NUTS, Happilo International Pvt. Ltd., IMPORTACO SA, Istore Direct Trading Pvt. Ltd., Lexunder Inc., Manu Tata S.A.C., NOW Health Group Inc., Nutty Gritties, Olam Group Ltd., Royal Nut Co., Seeberger GmbH, Sincerely Nuts, Sunbest Natural, Tahuamanu S.A.C., We Got Nuts are a few of the key vendors in the Brazil Nuts market.

Europe will register the highest growth rate of 50.5% among the other regions. Therefore, the Brazil Nuts market in Europe is expected to garner significant business opportunities for the vendors during the forecast period.

UK, Germany, France, Italy, The Netherlands, Spain, US, Canada, Mexico, China, Japan, India, South Korea, Australia, Indonesia, Brazil, Argentina, Chile, Saudi Arabia, UAE, South Africa, Israel, Turkey

  • Growing consumer awareness of selenium-related health benefits is the driving factor this market.

The Brazil Nuts market vendors should focus on grabbing business opportunities from the Product segment as it accounted for the largest market share in the base year.
RIA - Research AI Assistant
Ask RIA