Oil and Gas Market Analysis Brazil - Size and Forecast 2024-2028

Oil and Gas Market Analysis Brazil - Size and Forecast 2024-2028

Published: Feb 2024 141 Pages SKU: IRTNTR77527

Market Overview at a Glance

$46.79 B
Market Opportunity
3.68%
CAGR
3.12
YoY growth 2023-2024(%)

Brazil Oil and Gas Market Size and Trends

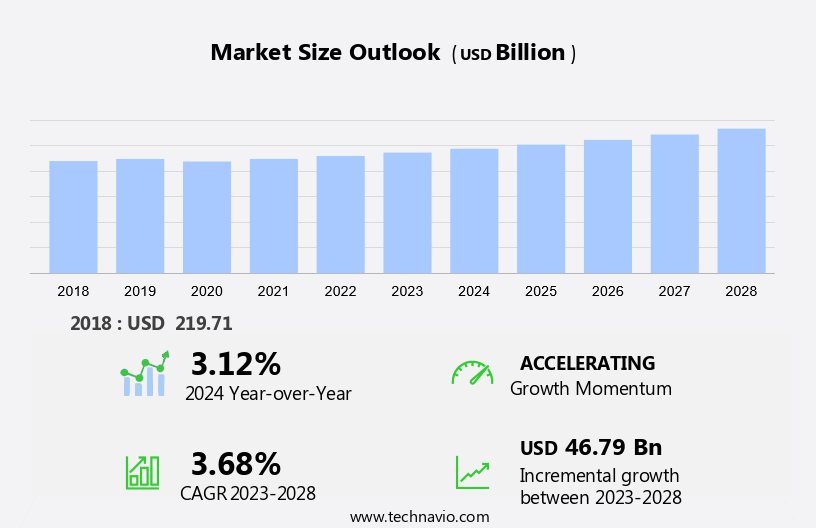
The Brazil oil and gas market size is forecast to increase by USD 46.79 billion at a CAGR of 3.68% between 2023 and 2028. The market is experiencing significant growth, driven by technological advancements in drilling techniques and the increasing adoption of natural gas vehicles (NGVs). These trends are contributing to the expansion of the market, particularly in the upstream sector. Furthermore, the increasing use of renewable fuel sources, such as offshore wind power and solar, is creating opportunities for the integration of renewable energy into the oil and gas industry. This integration is expected to reduce the carbon footprint of oil and gas companies and help them meet sustainability goals. However, challenges such as regulatory issues, high operational costs, and geopolitical risks continue to pose threats to market growth. Despite these challenges, the market is expected to grow at a steady pace, driven by the aforementioned trends and the vast potential for oil and gas exploration in Brazil.

Oil and Gas Market in Brazil Size

 Request Free Sample

The market has been a significant hydrocarbon investment destination due to its vast reserves of crude oil and natural gas. The country is the tenth-largest producer of crude oil in the world and the eighth-largest consumer of petroleum products. The exploration and production sector, including refineries, is a capital-intensive industry that contributes significantly to the country's gross domestic product. Free cash flows from oil and gas operations have been a driving force for shareholders and investors in the market. However, the industry faces challenges such as emissions reduction targets and the shift towards low-carbon energies. Regulators play a crucial role in implementing policies to balance the economic benefits of hydrocarbon production with environmental concerns. Brazil's oil refining capacity stands at approximately 1.6 million barrels per day, making it the seventh-largest refining country in the world. The country's non-OECD petroleum consumption is expected to increase due to growing demand for petrol products. The International Energy Agency (IEA) forecasts that Brazil will remain a significant consumer of oil and natural gas as fuel sources for processes and systems in various industries. The market's future growth depends on continued investment in exploration and production and the development of new technologies to reduce emissions and improve efficiency.

Market Segmentation

The market research report provides comprehensive data (region-wise segment analysis), with forecasts and estimates in "USD billion " for the period 2024-2028, as well as historical data from 2018 - 2022 for the following segments.

  • Application Outlook
    • Industrial
    • Commercial
    • Residential
  • Deployment Outlook
    • Offshore
    • Onshore
  • Region Outlook
    • North America
      • The U.S.
      • Canada
    • Europe
      • U.K.
      • Germany
      • France
      • Rest of Europe
    • APAC
      • China
      • India
    • Middle East & Africa
      • Saudi Arabia
      • South Africa
      • Rest of the Middle East & Africa

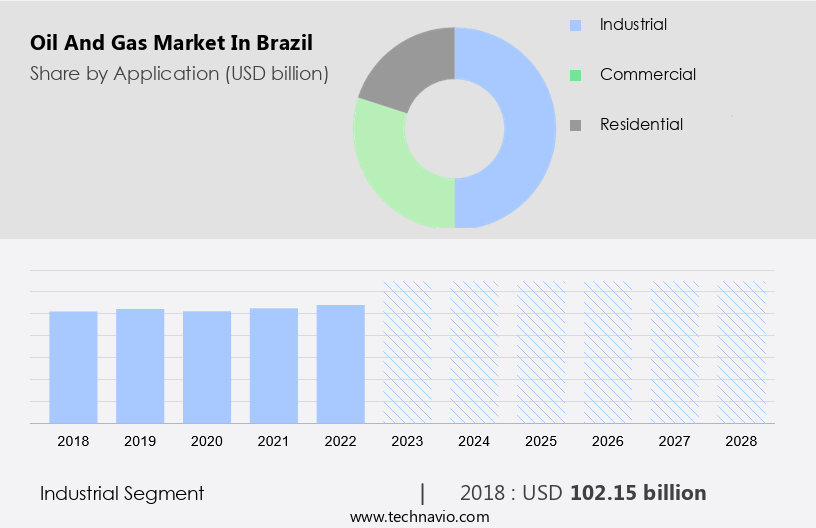
By Application Insights

The industrial segment is estimated to witness significant growth during the forecast period. The market is characterized by processing concentration and the presence of critical mineral resources, including nickel, graphite, lithium, cobalt, and rare earth elements. Occidental Petroleum and TerraLithium are among the companies exploring these resources in the country.

Oil and Gas Market in Brazil Size

Get a glance at the market share of various regions Download the PDF Sample

The industrial segment was the largest segment and valued at USD 102.15 billion in 2018. Control of critical mineral rights and regulatory knowledge are crucial for companies in the clean energy manufacturing sector, given the increasing demand for lithium for EV battery production. Brine deposits are a significant source of lithium in Brazil, and companies are focusing on optimizing water resources and reducing lead times to gain a competitive edge.  Hence, such factors are fuelling the growth of this segment during the forecast period.

Our researchers analyzed the data with 2023 as the base year, along with the key drivers, trends, and challenges. A holistic analysis of drivers will help companies refine their marketing strategies to gain a competitive advantage.

Brazil Oil and Gas Market Driver

Technological advancements in drilling techniques is notably driving market growth. The market has witnessed significant advancements in exploration and production techniques, particularly in the areas of shale formations. Horizontal drilling technology, which enables drillers to access a wider section of shale rock from a single wellbore, has become a game-changer. This is achieved by drilling vertically to the target depth and then turning the drill bit horizontally within the shale formation. This technique has significantly increased productivity and overall resource recovery.

Another crucial development is the application of hydraulic fracturing, which involves injecting a high-pressure fluid mixture into the shale formation to create fractures, thereby allowing natural gas to flow more freely. Innovations in fracking technology, such as multi-stage fracking, have led to more efficient and effective methods by isolating and stimulating specific sections of the wellbore. Thus, such factors are driving the growth of the market during the forecast period.

Brazil Oil and Gas Market Trends

Growing adoption of NGVs is the key trend in the market. The market is witnessing significant growth in the adoption of natural gas as a cleaner alternative fuel, particularly in the transportation sector. The Net-Zero Industry Act and other clean energy policies have encouraged the use of natural gas as a more sustainable fuel option.

The popularity of natural gas vehicles (NGVs) has prompted companies like Ford and GM to introduce certified natural gas conversion systems, enabling consumers to convert internal combustion engines to natural gas-powered engines without voiding the warranty. Thus, such trends will shape the growth of the market during the forecast period.

Brazil Oil and Gas Market Challenge

Increasing use of renewable energy sources is the major challenge that affects the growth of the market. The market is facing significant challenges due to the global shift towards clean energy and net-zero emission targets. The declining costs of renewable energy technology and equipment are making solar and wind power increasingly competitive with traditional gas-fired power plants.

Consequently, the high capital investments required for oil and gas projects may divert towards renewables, potentially hindering the growth of the oil and gas industry in Brazil. Hence, the above factors will impede the growth of the market during the forecast period

Exclusive Customer Landscape

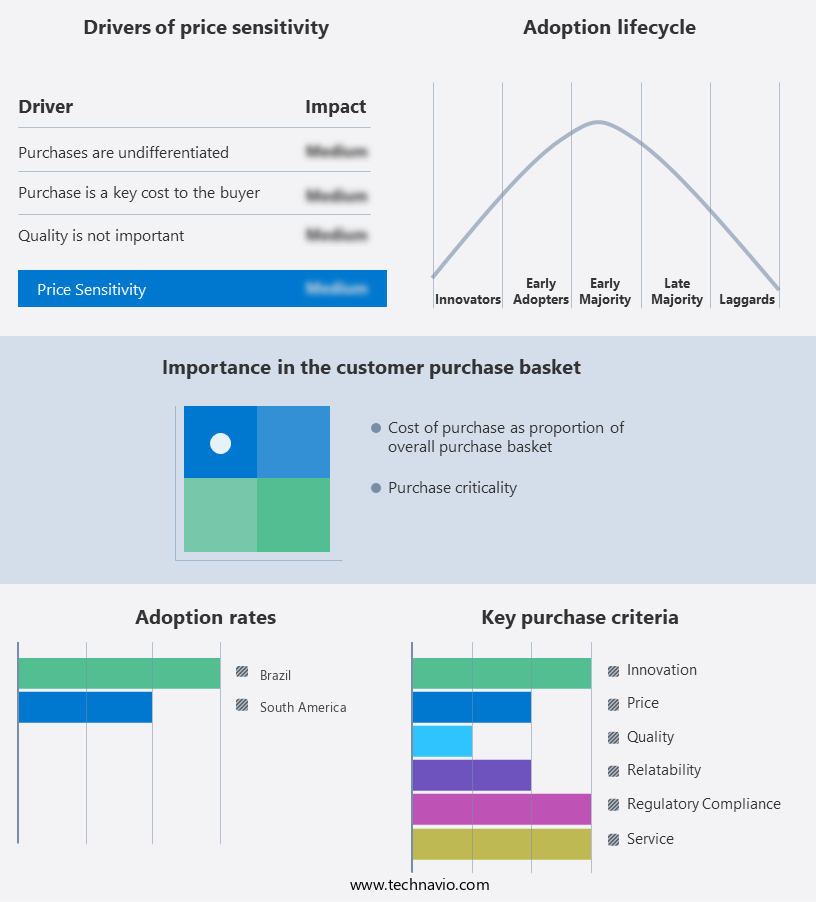
The market forecasting report includes the adoption lifecycle of the market, covering from the innovator's stage to the laggard's stage. It focuses on adoption rates in different regions based on penetration. Furthermore, the report also includes key purchase criteria and drivers of price sensitivity to help companies evaluate and develop their market growth analysis strategies.

Oil and Gas Market in Brazil Share by Geography

 Customer Landscape

Key Companies & Market Insights

Companies are implementing various strategies, such as strategic alliances, partnerships, mergers and acquisitions, geographical expansion, and product/service launches, to enhance their presence in the market.

ALYA CONSTRUTORA: The company offers oil and gas through its subsidiary Enauta Participacoes in Manati wells which are connected by subsea lines to the PMNT-1 platform, a fixed production unit installed at a water depth of 35 m, 10 km offshore.

The market research and growth report also includes detailed analyses of the competitive landscape of the market and information about key companies, including:

  • Bechtel Corp.
  • BP Plc
  • Chevron Corp.
  • Equinor ASA
  • Exxon Mobil Corp.
  • MITSUI and CO. LTD.
  • Murphy Oil Corp.
  • Petroleo Brasileiro SA
  • Shell plc
  • TotalEnergies SE

Qualitative and quantitative analysis of companies has been conducted to help clients understand the wider business environment as well as the strengths and weaknesses of key market players. Data is qualitatively analyzed to categorize companies as pure play, category-focused, industry-focused, and diversified; it is quantitatively analyzed to categorize companies as dominant, leading, strong, tentative, and weak.

Market Analyst Overview

The market is witnessing significant investments in hydrocarbon exploration and production, driven by high free cash flows and operational efficiency. However, the industry is also facing the challenge of reducing emissions and transitioning to low-carbon energies. The Brazilian government has set renewable energy targets, leading to an increase in renewable power projects and renewable energy auctions. The supply chain for low-carbon fuels, such as natural gas, biofuels, hydrogen, and renewable energy, is gaining importance. Critical minerals mining is a crucial aspect of this supply chain, as these minerals are essential for the production of clean energy technologies. The adoption of clean energy avenues, including CCS development and green initiatives, offers benefits such as reduced emissions and improved environmental sustainability. However, there are risks associated with these advancements, including capital allocation strategies, feedstock supply, and scalability. Internal considerations, such as operational efficiency and backward integration, are essential for the progression of the oil and gas industry in Brazil. External considerations, including consumer preferences and regulatory frameworks, also play a significant role in the industry's development. Coalitions between industry players and governments are essential for the commercial viability of clean energy projects. The long-term contracts for renewable energy and natural gas are crucial for securing capital and ensuring the scalability of these projects. The market is at a critical juncture, with opportunities for high-return capex strategies in both traditional and clean energy sectors. The industry must balance internal considerations with external pressures to ensure a sustainable and profitable future.

Market Scope

Report Coverage

Details

Page number

141

Base year

2023

Historic period

2018 - 2022

Forecast period

2024-2028

Growth momentum & CAGR

Accelerate at a CAGR of 3.68%

Market growth 2024-2028

USD 46.79 billion

Market structure

Concentrated

YoY growth 2023-2024(%)

3.12

Competitive landscape

Leading Companies, Market Positioning of Companies, Competitive Strategies, and Industry Risks

Key companies profiled

ALYA CONSTRUTORA, Bechtel Corp., BP Plc, Chevron Corp., Equinor ASA, Exxon Mobil Corp., MITSUI and CO. LTD., Murphy Oil Corp., Petroleo Brasileiro SA, Shell plc, and TotalEnergies SE

Market dynamics

Parent market analysis, market report , market forecast , Market growth inducers and obstacles, Fast-growing and slow-growing segment analysis, COVID-19 impact and recovery analysis and future consumer dynamics, Market condition analysis for forecast period

Customization purview

If our report has not included the data that you are looking for, you can reach out to our analysts and get segments customized.

Download PDF Sample

What are the Key Data Covered in this Market Research Report?

  • CAGR of the market during the forecast period
  • Detailed information on factors that will drive the market growth and forecasting between 2024 and 2028
  • Precise estimation of the size of the market  and its contribution of the market in focus to the parent market
  • Accurate predictions about upcoming market growth and trends and changes in consumer behaviour
  • Growth of the market across Brazil
  • Thorough analysis of the market's competitive landscape and detailed information about companies
  • Comprehensive analysis of factors that will challenge the growth of market companies

We can help! Our analysts can customize this market research report to meet your requirements. Get in touch

1 Executive Summary

  • 1.1 Market overview
    • Exhibit 01: Executive Summary – Chart on Market Overview
    • Exhibit 02: Executive Summary – Data Table on Market Overview
    • Exhibit 03: Executive Summary – Chart on Country Market Characteristics
    • Exhibit 04: Executive Summary – Chart on Market Segmentation by Application
    • Exhibit 05: Executive Summary – Chart on Market Segmentation by Deployment
    • Exhibit 06: Executive Summary – Chart on Market Segmentation by Type
    • Exhibit 07: Executive Summary – Chart on Vendor Market Positioning

2 Market Landscape

  • 2.1 Market ecosystem
    • Exhibit 08: Parent market
    • Exhibit 09: Market Characteristics

3 Market Sizing

  • 3.1 Market definition
    • Exhibit 10: Offerings of vendors included in the market definition
  • 3.2 Market segment analysis
    • Exhibit 11: Market segments
  • 3.3 Market size 2023
    • 3.4 Market outlook: Forecast for 2023-2028
      • Exhibit 12: Chart on Brazil - Market size and forecast 2023-2028 ($ billion)
      • Exhibit 13: Data Table on Brazil - Market size and forecast 2023-2028 ($ billion)
      • Exhibit 14: Chart on Brazil: Year-over-year growth 2023-2028 (%)
      • Exhibit 15: Data Table on Brazil: Year-over-year growth 2023-2028 (%)

    4 Historic Market Size

    • 4.1 Oil and gas market in Brazil 2018 - 2022
      • Exhibit 16: Historic Market Size – Data Table on oil and gas market in Brazil 2018 - 2022 ($ billion)
    • 4.2 Application Segment Analysis 2018 - 2022
      • Exhibit 17: Historic Market Size – Application Segment 2018 - 2022 ($ billion)
    • 4.3 Deployment Segment Analysis 2018 - 2022
      • Exhibit 18: Historic Market Size – Deployment Segment 2018 - 2022 ($ billion)
    • 4.4 Type Segment Analysis 2018 - 2022
      • Exhibit 19: Historic Market Size – Type Segment 2018 - 2022 ($ billion)

    5 Five Forces Analysis

    • 5.1 Five forces summary
      • Exhibit 20: Five forces analysis - Comparison between 2023 and 2028
    • 5.2 Bargaining power of buyers
      • Exhibit 21: Chart on Bargaining power of buyers – Impact of key factors 2023 and 2028
    • 5.3 Bargaining power of suppliers
      • Exhibit 22: Bargaining power of suppliers – Impact of key factors in 2023 and 2028
    • 5.4 Threat of new entrants
      • Exhibit 23: Threat of new entrants – Impact of key factors in 2023 and 2028
    • 5.5 Threat of substitutes
      • Exhibit 24: Threat of substitutes – Impact of key factors in 2023 and 2028
    • 5.6 Threat of rivalry
      • Exhibit 25: Threat of rivalry – Impact of key factors in 2023 and 2028
    • 5.7 Market condition
      • Exhibit 26: Chart on Market condition - Five forces 2023 and 2028

    6 Market Segmentation by Application

    • 6.1 Market segments
      • Exhibit 27: Chart on Application - Market share 2023-2028 (%)
      • Exhibit 28: Data Table on Application - Market share 2023-2028 (%)
    • 6.2 Comparison by Application
      • Exhibit 29: Chart on Comparison by Application
      • Exhibit 30: Data Table on Comparison by Application
    • 6.3 Industrial - Market size and forecast 2023-2028
      • Exhibit 31: Chart on Industrial - Market size and forecast 2023-2028 ($ billion)
      • Exhibit 32: Data Table on Industrial - Market size and forecast 2023-2028 ($ billion)
      • Exhibit 33: Chart on Industrial - Year-over-year growth 2023-2028 (%)
      • Exhibit 34: Data Table on Industrial - Year-over-year growth 2023-2028 (%)
    • 6.4 Commercial - Market size and forecast 2023-2028
      • Exhibit 35: Chart on Commercial - Market size and forecast 2023-2028 ($ billion)
      • Exhibit 36: Data Table on Commercial - Market size and forecast 2023-2028 ($ billion)
      • Exhibit 37: Chart on Commercial - Year-over-year growth 2023-2028 (%)
      • Exhibit 38: Data Table on Commercial - Year-over-year growth 2023-2028 (%)
    • 6.5 Residential - Market size and forecast 2023-2028
      • Exhibit 39: Chart on Residential - Market size and forecast 2023-2028 ($ billion)
      • Exhibit 40: Data Table on Residential - Market size and forecast 2023-2028 ($ billion)
      • Exhibit 41: Chart on Residential - Year-over-year growth 2023-2028 (%)
      • Exhibit 42: Data Table on Residential - Year-over-year growth 2023-2028 (%)
    • 6.6 Market opportunity by Application
      • Exhibit 43: Market opportunity by Application ($ billion)
      • Exhibit 44: Data Table on Market opportunity by Application ($ billion)

    7 Market Segmentation by Deployment

    • 7.1 Market segments
      • Exhibit 45: Chart on Deployment - Market share 2023-2028 (%)
      • Exhibit 46: Data Table on Deployment - Market share 2023-2028 (%)
    • 7.2 Comparison by Deployment
      • Exhibit 47: Chart on Comparison by Deployment
      • Exhibit 48: Data Table on Comparison by Deployment
    • 7.3 Offshore - Market size and forecast 2023-2028
      • Exhibit 49: Chart on Offshore - Market size and forecast 2023-2028 ($ billion)
      • Exhibit 50: Data Table on Offshore - Market size and forecast 2023-2028 ($ billion)
      • Exhibit 51: Chart on Offshore - Year-over-year growth 2023-2028 (%)
      • Exhibit 52: Data Table on Offshore - Year-over-year growth 2023-2028 (%)
    • 7.4 Onshore - Market size and forecast 2023-2028
      • Exhibit 53: Chart on Onshore - Market size and forecast 2023-2028 ($ billion)
      • Exhibit 54: Data Table on Onshore - Market size and forecast 2023-2028 ($ billion)
      • Exhibit 55: Chart on Onshore - Year-over-year growth 2023-2028 (%)
      • Exhibit 56: Data Table on Onshore - Year-over-year growth 2023-2028 (%)
    • 7.5 Market opportunity by Deployment
      • Exhibit 57: Market opportunity by Deployment ($ billion)
      • Exhibit 58: Data Table on Market opportunity by Deployment ($ billion)

    8 Market Segmentation by Type

    • 8.1 Market segments
      • Exhibit 59: Chart on Type - Market share 2023-2028 (%)
      • Exhibit 60: Data Table on Type - Market share 2023-2028 (%)
    • 8.2 Comparison by Type
      • Exhibit 61: Chart on Comparison by Type
      • Exhibit 62: Data Table on Comparison by Type
    • 8.3 Upstream - Market size and forecast 2023-2028
      • Exhibit 63: Chart on Upstream - Market size and forecast 2023-2028 ($ billion)
      • Exhibit 64: Data Table on Upstream - Market size and forecast 2023-2028 ($ billion)
      • Exhibit 65: Chart on Upstream - Year-over-year growth 2023-2028 (%)
      • Exhibit 66: Data Table on Upstream - Year-over-year growth 2023-2028 (%)
    • 8.4 Downstream - Market size and forecast 2023-2028
      • Exhibit 67: Chart on Downstream - Market size and forecast 2023-2028 ($ billion)
      • Exhibit 68: Data Table on Downstream - Market size and forecast 2023-2028 ($ billion)
      • Exhibit 69: Chart on Downstream - Year-over-year growth 2023-2028 (%)
      • Exhibit 70: Data Table on Downstream - Year-over-year growth 2023-2028 (%)
    • 8.5 Midstream - Market size and forecast 2023-2028
      • Exhibit 71: Chart on Midstream - Market size and forecast 2023-2028 ($ billion)
      • Exhibit 72: Data Table on Midstream - Market size and forecast 2023-2028 ($ billion)
      • Exhibit 73: Chart on Midstream - Year-over-year growth 2023-2028 (%)
      • Exhibit 74: Data Table on Midstream - Year-over-year growth 2023-2028 (%)
    • 8.6 Market opportunity by Type
      • Exhibit 75: Market opportunity by Type ($ billion)
      • Exhibit 76: Data Table on Market opportunity by Type ($ billion)

    9 Customer Landscape

    • 9.1 Customer landscape overview
      • Exhibit 77: Analysis of price sensitivity, lifecycle, customer purchase basket, adoption rates, and purchase criteria

    10 Drivers, Challenges, and Trends

    • 10.1 Market drivers
      • 10.2 Market challenges
        • 10.3 Impact of drivers and challenges
          • Exhibit 78: Impact of drivers and challenges in 2023 and 2028
        • 10.4 Market trends

          11 Vendor Landscape

          • 11.1 Overview
            • 11.2 Vendor landscape
              • Exhibit 79: Overview on Criticality of inputs and Factors of differentiation
            • 11.3 Landscape disruption
              • Exhibit 80: Overview on factors of disruption
            • 11.4 Industry risks
              • Exhibit 81: Impact of key risks on business

            12 Vendor Analysis

            • 12.1 Vendors covered
              • Exhibit 82: Vendors covered
            • 12.2 Market positioning of vendors
              • Exhibit 83: Matrix on vendor position and classification
            • 12.3 ALYA CONSTRUTORA
              • Exhibit 84: ALYA CONSTRUTORA - Overview
              • Exhibit 85: ALYA CONSTRUTORA - Product / Service
              • Exhibit 86: ALYA CONSTRUTORA - Key offerings
            • 12.4 Bechtel Corp.
              • Exhibit 87: Bechtel Corp. - Overview
              • Exhibit 88: Bechtel Corp. - Product / Service
              • Exhibit 89: Bechtel Corp. - Key news
              • Exhibit 90: Bechtel Corp. - Key offerings
            • 12.5 BP Plc
              • Exhibit 91: BP Plc - Overview
              • Exhibit 92: BP Plc - Business segments
              • Exhibit 93: BP Plc - Key news
              • Exhibit 94: BP Plc - Key offerings
              • Exhibit 95: BP Plc - Segment focus
            • 12.6 Chevron Corp.
              • Exhibit 96: Chevron Corp. - Overview
              • Exhibit 97: Chevron Corp. - Business segments
              • Exhibit 98: Chevron Corp. - Key news
              • Exhibit 99: Chevron Corp. - Key offerings
              • Exhibit 100: Chevron Corp. - Segment focus
            • 12.7 Equinor ASA
              • Exhibit 101: Equinor ASA - Overview
              • Exhibit 102: Equinor ASA - Business segments
              • Exhibit 103: Equinor ASA - Key offerings
              • Exhibit 104: Equinor ASA - Segment focus
            • 12.8 Exxon Mobil Corp.
              • Exhibit 105: Exxon Mobil Corp. - Overview
              • Exhibit 106: Exxon Mobil Corp. - Business segments
              • Exhibit 107: Exxon Mobil Corp. - Key news
              • Exhibit 108: Exxon Mobil Corp. - Key offerings
              • Exhibit 109: Exxon Mobil Corp. - Segment focus
            • 12.9 MITSUI and CO. LTD.
              • Exhibit 110: MITSUI and CO. LTD. - Overview
              • Exhibit 111: MITSUI and CO. LTD. - Business segments
              • Exhibit 112: MITSUI and CO. LTD. - Key offerings
              • Exhibit 113: MITSUI and CO. LTD. - Segment focus
            • 12.10 Murphy Oil Corp.
              • Exhibit 114: Murphy Oil Corp. - Overview
              • Exhibit 115: Murphy Oil Corp. - Product / Service
              • Exhibit 116: Murphy Oil Corp. - Key offerings
            • 12.11 Petroleo Brasileiro SA
              • Exhibit 117: Petroleo Brasileiro SA - Overview
              • Exhibit 118: Petroleo Brasileiro SA - Business segments
              • Exhibit 119: Petroleo Brasileiro SA - Key offerings
              • Exhibit 120: Petroleo Brasileiro SA - Segment focus
            • 12.12 Shell plc
              • Exhibit 121: Shell plc - Overview
              • Exhibit 122: Shell plc - Business segments
              • Exhibit 123: Shell plc - Key offerings
              • Exhibit 124: Shell plc - Segment focus
            • 12.13 TotalEnergies SE
              • Exhibit 125: TotalEnergies SE - Overview
              • Exhibit 126: TotalEnergies SE - Business segments
              • Exhibit 127: TotalEnergies SE - Key news
              • Exhibit 128: TotalEnergies SE - Key offerings
              • Exhibit 129: TotalEnergies SE - Segment focus

            13 Appendix

            • 13.1 Scope of the report
              • 13.2 Inclusions and exclusions checklist
                • Exhibit 130: Inclusions checklist
                • Exhibit 131: Exclusions checklist
              • 13.3 Currency conversion rates for US$
                • Exhibit 132: Currency conversion rates for US$
              • 13.4 Research methodology
                • Exhibit 133: Research methodology
                • Exhibit 134: Validation techniques employed for market sizing
                • Exhibit 135: Information sources
              • 13.5 List of abbreviations
                • Exhibit 136: List of abbreviations

              Research Methodology

              Technavio presents a detailed picture of the market by way of study, synthesis, and summation of data from multiple sources. The analysts have presented the various facets of the market with a particular focus on identifying the key industry influencers. The data thus presented is comprehensive, reliable, and the result of extensive research, both primary and secondary.

              INFORMATION SOURCES

              Primary sources

              • Manufacturers and suppliers
              • Channel partners
              • Industry experts
              • Strategic decision makers

              Secondary sources

              • Industry journals and periodicals
              • Government data
              • Financial reports of key industry players
              • Historical data
              • Press releases

              DATA ANALYSIS

              Data Synthesis

              • Collation of data
              • Estimation of key figures
              • Analysis of derived insights

              Data Validation

              • Triangulation with data models
              • Reference against proprietary databases
              • Corroboration with industry experts

              REPORT WRITING

              Qualitative

              • Market drivers
              • Market challenges
              • Market trends
              • Five forces analysis

              Quantitative

              • Market size and forecast
              • Market segmentation
              • Geographical insights
              • Competitive landscape

              Interested in this report?

              Get your sample now to see our research methodology and insights!

              Download Now

              Frequently Asked Questions

              Oil and Gasin Brazil market growth will increase by $ 46.79 bn during 2024-2028 .

              The Oil and Gasin Brazil market is expected to grow at a CAGR of 3.68% during 2024-2028 .

              Oil and Gasin Brazil market is segmented by Application( Industrial, Commercial, Residential) Deployment( Offshore, Onshore) Type( Upstream, Downstream, Midstream)

              ALYA CONSTRUTORA, Bechtel Corp., BP Plc, Chevron Corp., Equinor ASA, Exxon Mobil Corp., MITSUI and CO. LTD., Murphy Oil Corp., Petroleo Brasileiro SA, Shell plc, TotalEnergies SE are a few of the key vendors in the Oil and Gasin Brazil market.

              South America will register the highest growth rate of 100% among the other regions. Therefore, the Oil and Gasin Brazil market in South America is expected to garner significant business opportunities for the vendors during the forecast period.

              Brazil, South America

              • Technological advancements in drilling techniquesHorizontal drilling technology allows drillers to access a broader section of shale rock from a single wellbore. By drilling vertically to a target depth and then turning the drill bit horizontally within the shale formation is the driving factor this market.
              • operators can significantly increase the contact area between the well and the shale reservoir. This technique has greatly improved productivity and overall resource recovery. Hydraulic fracturing involves injecting a high-pressure fluid mixture into the shale formation to create fractures is the driving factor this market.
              • allowing natural gas to flow more freely. Advances in fracking technology have led to the development of more efficient and effective fracturing techniques such as multi-stage fracking is the driving factor this market.
              • which involves isolating and stimulating specific sections of the wellbore. This has enhanced gas recovery rates and overall is the driving factor this market.
              • well performance. Precise directional drilling technology allows operators to optimize well placement within the shale formation is the driving factor this market.
              • avoiding geological barriers and increasing production efficiency. Moreover is the driving factor this market.
              • advances in real-time monitoring and data analytics enable operators to monitor well performance is the driving factor this market.
              • pressure is the driving factor this market.
              • and gas flow rates during drilling and production. This information allows for more informed decision-making and better management. The integration of digital technology in the oil and gas sector is the driving factor this market.
              • often referred to as the digital oilfield is the driving factor this market.
              • has improved the overall efficiency and performance of shale gas operations. This includes the use of sensors is the driving factor this market.
              • automation is the driving factor this market.
              • and data analytics to optimize production processes. Thus is the driving factor this market.
              • the technological advancements in drilling techniques will propel the growth of the oil and gas market in Brazil during the forecast period. is the driving factor this market.

              The Oil and Gasin Brazil market vendors should focus on grabbing business opportunities from the Industrial segment as it accounted for the largest market share in the base year.