Buccal Cavity Devices Market Size 2025-2029
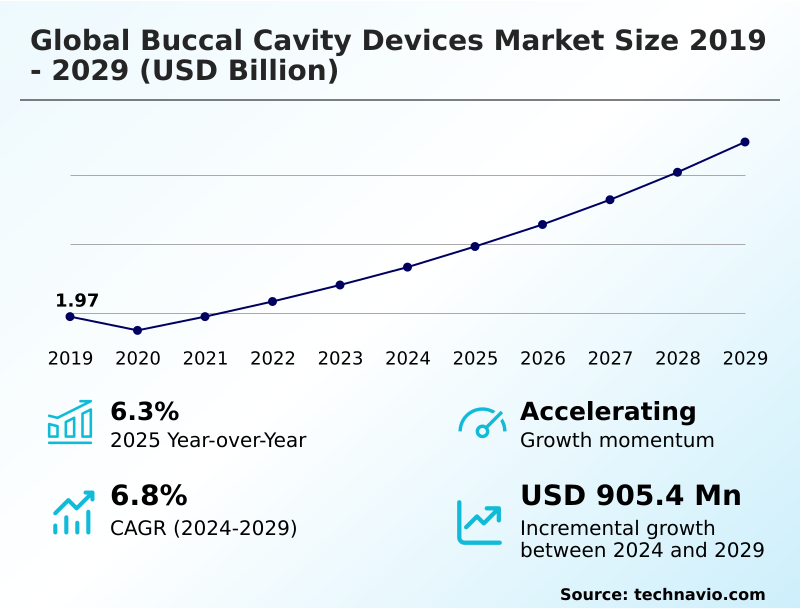
The buccal cavity devices market size is valued to increase by USD 905.4 million, at a CAGR of 6.8% from 2024 to 2029. Increasing prevalence of dental diseases will drive the buccal cavity devices market.
Major Market Trends & Insights
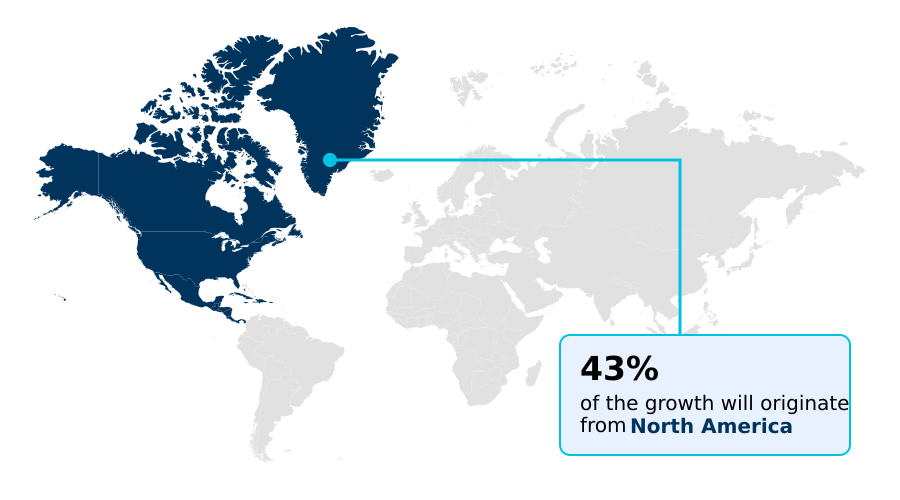
- North America dominated the market and accounted for a 42.7% growth during the forecast period.
- By Device - Electric toothbrushes segment was valued at USD 981.9 million in 2023
- By End-user - Hospitals segment accounted for the largest market revenue share in 2023
Market Size & Forecast
- Market Opportunities: USD 1.27 billion
- Market Future Opportunities: USD 905.4 million
- CAGR from 2024 to 2029 : 6.8%
Market Summary
- The buccal cavity devices market is undergoing significant transformation, driven by technological advancements and a growing emphasis on preventive and minimally invasive dental care. The integration of digital technologies is reshaping clinical practices, moving from traditional methods to highly efficient, data-driven workflows.
- For instance, a dental practice implementing AI-powered diagnostics and digital workflow integration can enhance operational efficiency by reducing chair time for digital impressions and improving diagnostic accuracy for conditions like dental caries. This shift is supported by the increasing adoption of intraoral scanners, CBCT systems, and CAD/CAM solutions.
- Concurrently, the market for buccal drug delivery is expanding, with research into novel mucoadhesive polymers for transmucosal administration. However, the high cost of advanced equipment and the need for skilled professionals to operate guided surgery platforms pose challenges to widespread adoption, particularly in emerging economies.
- The focus on cosmetic dentistry and patient-centric care continues to fuel innovation in this dynamic sector.
What will be the Size of the Buccal Cavity Devices Market during the forecast period?
Get Key Insights on Market Forecast (PDF) Get Free Sample
How is the Buccal Cavity Devices Market Segmented?
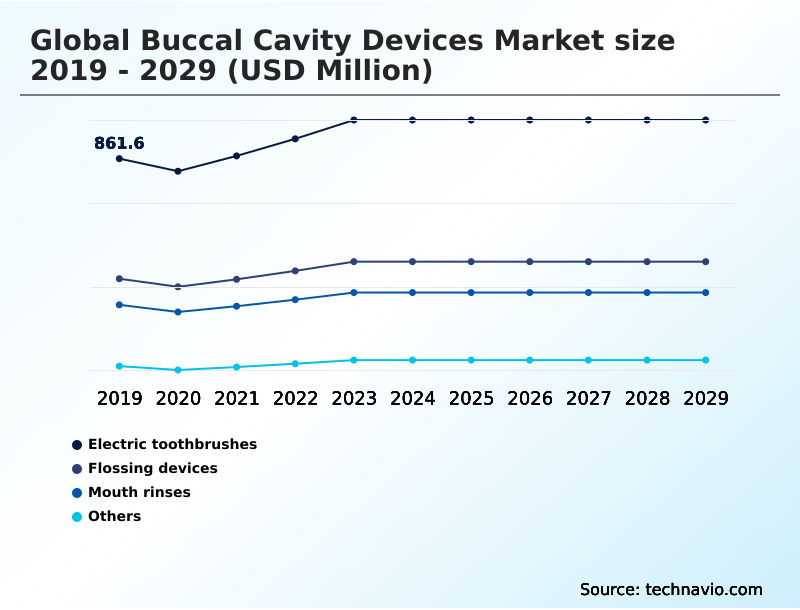
The buccal cavity devices industry research report provides comprehensive data (region-wise segment analysis), with forecasts and estimates in "USD million" for the period 2025-2029, as well as historical data from 2019-2023 for the following segments.
- Device
- Electric toothbrushes
- Flossing devices
- Mouth rinses
- Others
- End-user
- Hospitals
- Specialty clinics
- Research institutions
- Application
- Diagnostics
- Therapeutics
- Geography
- North America
- US
- Canada
- Mexico
- Europe
- Germany
- UK
- Italy
- Asia
- Rest of World (ROW)
- North America
By Device Insights
The electric toothbrushes segment is estimated to witness significant growth during the forecast period.
The market for electric toothbrushes is evolving beyond simple motorized devices, driven by consumer demand for advanced oral care solutions and clinical data supporting superior efficacy.
Innovations now focus on smart technology, with features like AI-powered diagnostics and sensor integration to guide user habits, improving preventive dental care.
This enhances the patient experience and supports better outcomes, with studies showing these devices can reduce plaque by 21% more than manual alternatives.
The integration of such technology into oral health monitoring systems, alongside developments in digital imaging software and ultrasonic surgical tools, signals a shift toward a more connected ecosystem.
This focus on data-driven dentistry and in-office workflows reflects a broader trend of leveraging technology for early pathology detection and improved dental practice management.
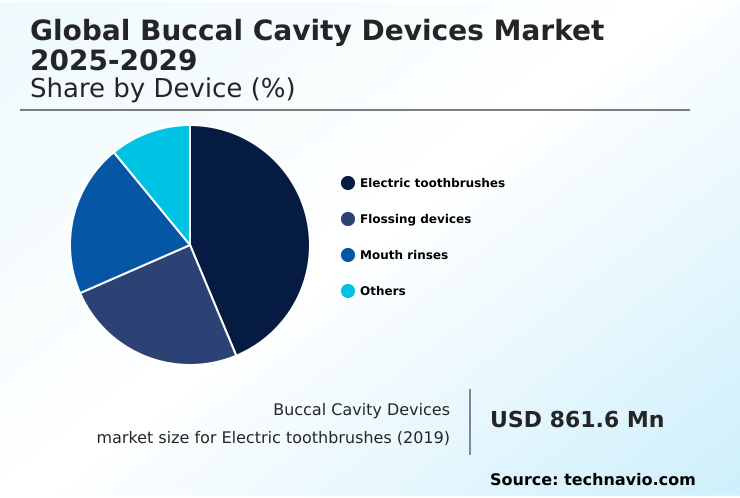
The Electric toothbrushes segment was valued at USD 981.9 million in 2023 and showed a gradual increase during the forecast period.
Regional Analysis
North America is estimated to contribute 42.7% to the growth of the global market during the forecast period.Technavio’s analysts have elaborately explained the regional trends and drivers that shape the market during the forecast period.
See How Buccal Cavity Devices Market Demand is Rising in North America Get Free Sample
The geographic landscape of the buccal cavity devices market is led by North America, which accounts for over 42% of the market's incremental growth.
This dominance is driven by high healthcare expenditure, robust R&D for technologies like AI algorithms and AI-assisted diagnostics, and strong consumer demand for cosmetic dentistry. The region's advanced infrastructure supports the widespread adoption of CBCT units and digital sensors.
European markets are also significant, focusing on clinical precision and restorative workflows. Meanwhile, the Asia-Pacific region is emerging as the fastest-growing market, fueled by increasing awareness of preventive dental care, rising disposable incomes, and government initiatives promoting oral health.
This is accelerating the adoption of buccal drug delivery systems and technologies that support remote dental consultation and treatment outcome improvement.
Market Dynamics
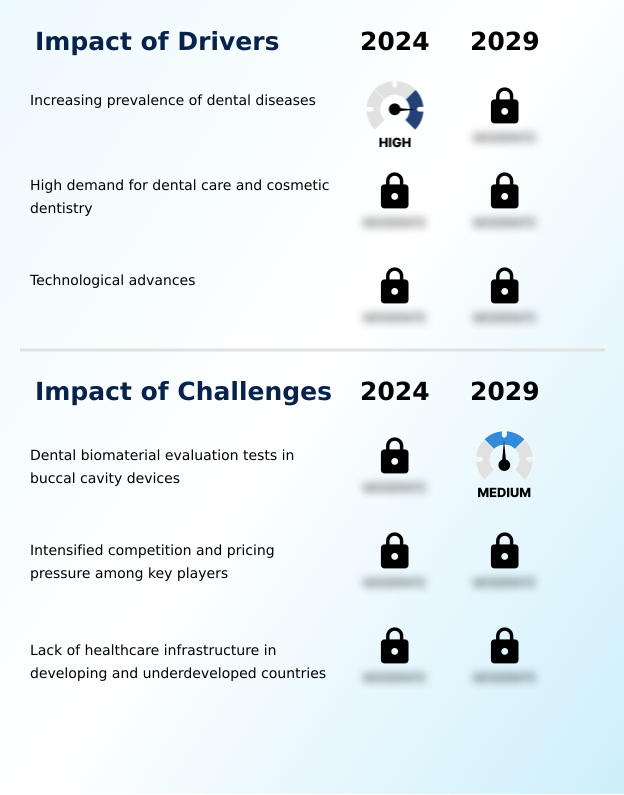
Our researchers analyzed the data with 2024 as the base year, along with the key drivers, trends, and challenges. A holistic analysis of drivers will help companies refine their marketing strategies to gain a competitive advantage.
- The evolution of the buccal cavity devices market is marked by specialized technological applications designed to address specific clinical challenges. The increasing use of AI in dental caries detection is revolutionizing diagnostics, enabling earlier and more accurate interventions. Similarly, the role of intraoral cameras in diagnostics has become fundamental for patient education and documentation.
- For complex procedures, advancements like 3D printing for custom implants and CBCT for maxillofacial surgery are setting new standards in surgical precision. The benefits of digital dental impressions, captured with advanced scanners, are clear, with practices reporting significantly faster turnaround times for restorations.
- Intraoral scanners for orthodontic planning and CAD/CAM for chairside restorations are streamlining digital workflows in cosmetic dentistry, while teledentistry for patient-follow-up enhances continuity of care. Research into advancements in salivary diagnostics and the development of buccal films for drug delivery using mucoadhesive polymers for transmucosal delivery highlight the push toward non-invasive methods.
- The integration of robotic technology in implant placement and software for holistic treatment planning promises to further enhance outcomes. These AI tools for radiographic analysis and wearable oral health monitoring devices are crucial for improving diagnostic accuracy with AI and enhancing patient experience with scanners, which are key goals across all minimally invasive therapeutic devices.
- As a result, firms leveraging AI-assisted periodontal disease assessment are achieving diagnostic consensus rates over 30% higher than those relying solely on manual review.
What are the key market drivers leading to the rise in the adoption of Buccal Cavity Devices Industry?
- The key driver fueling market expansion is the increasing global prevalence of dental diseases, including caries, periodontal conditions, and oral cancer.
- Market growth is primarily driven by the rising prevalence of oral diseases and the growing demand for cosmetic dentistry and preventive dental care.
- Technological advancements in panoramic imaging and operatory equipment are enabling earlier and more accurate diagnoses, improving practice efficiency by up to 25%.
- The development of patient-friendly devices, such as those for non-invasive drug delivery using transmucosal gels and mucoadhesive patches, is expanding therapeutic options and enhanced patient compliance.
- Furthermore, the creation of patient-specific surgical guides through 3D printing and 3D model printing is revolutionizing surgical procedures, ensuring higher surgical precision. This continuous innovation enhances in-office workflows and allows clinics to offer a higher standard of care.
What are the market trends shaping the Buccal Cavity Devices Industry?
- A prominent market trend is the rise of initiatives aimed at increasing public and professional awareness regarding oral health and the array of available treatment options.
- Key trends are reshaping the market, led by the integration of AI algorithms and AI-enhanced software into diagnostic equipment. The adoption of teledentistry and cloud-enabled dental software is accelerating, with platforms enabling remote dental consultation showing a 30% increase in user engagement. This facilitates better oral health monitoring and makes advanced oral care solutions more accessible.
- The push for minimally invasive procedures is driving innovation in endodontic tools and desktop 3D facial scanners, enhancing clinical precision. Chairside milling technologies allow for same-day restorations, significantly improving the patient experience. These trends collectively support a move toward more efficient, patient-centric care models, improving treatment outcome improvement by leveraging technology for better planning and execution.
What challenges does the Buccal Cavity Devices Industry face during its growth?
- A significant challenge impacting market growth is the stringent requirement for comprehensive dental biomaterial evaluation tests for buccal cavity devices before market approval.
- A primary challenge facing the market is the rigorous and costly process of biocompatibility testing for new materials, including buccal films and mucoadhesive polymers. This can delay product launches and increase R&D expenditure by over 20%.
- The complexity of AI-assisted diagnostics and guided surgery systems, such as robotic dental surgery platforms, requires significant capital investment and specialized training, limiting adoption in smaller practices. Ensuring seamless digital workflow integration between disparate systems, like CAD/CAM solutions and CBCT systems, remains a technical hurdle.
- These factors can impact the overall pace of innovation and the accessibility of advanced technologies for holistic treatment planning and early pathology detection across the industry.
Exclusive Technavio Analysis on Customer Landscape
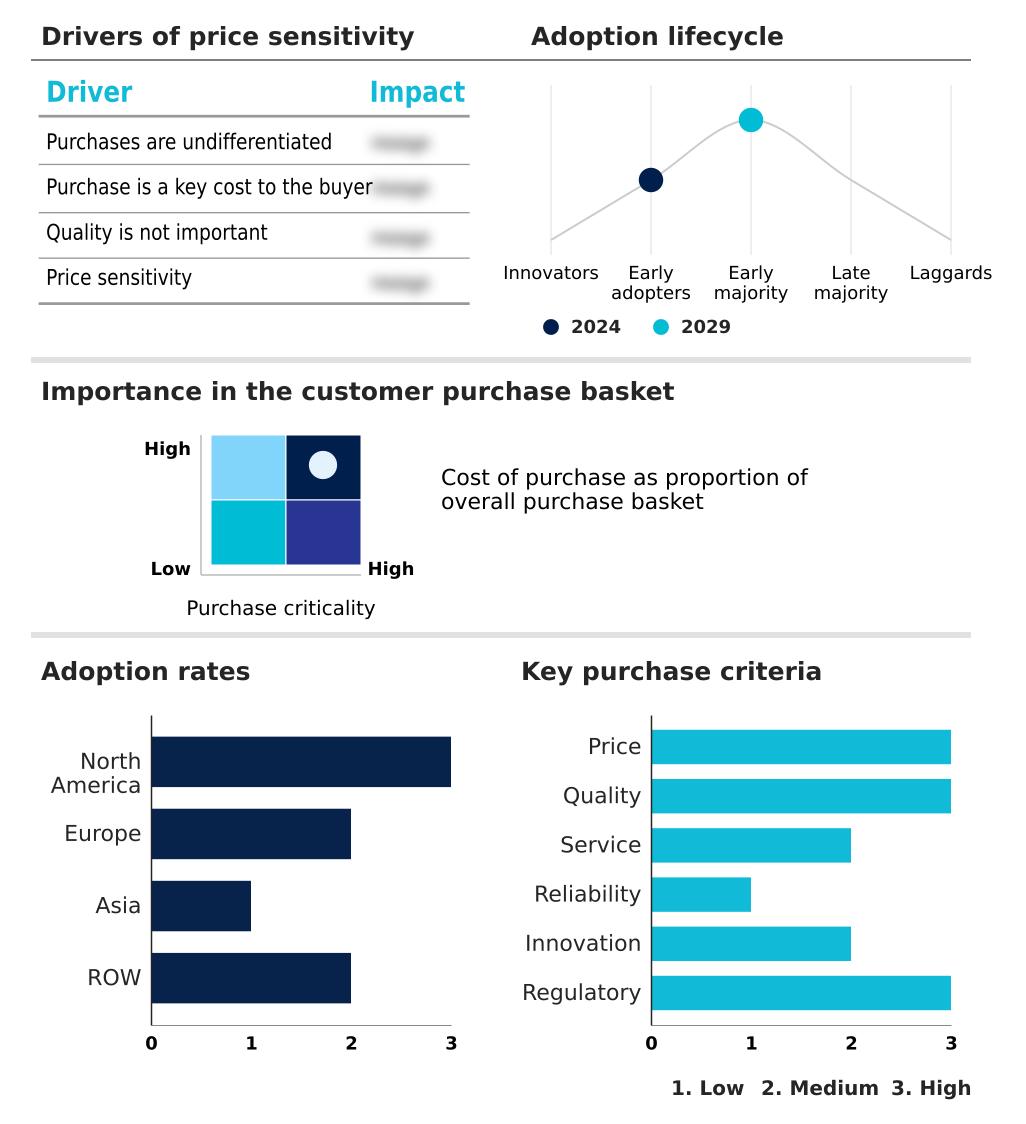
The buccal cavity devices market forecasting report includes the adoption lifecycle of the market, covering from the innovator’s stage to the laggard’s stage. It focuses on adoption rates in different regions based on penetration. Furthermore, the buccal cavity devices market report also includes key purchase criteria and drivers of price sensitivity to help companies evaluate and develop their market growth analysis strategies.
Customer Landscape of Buccal Cavity Devices Industry
Competitive Landscape
Companies are implementing various strategies, such as strategic alliances, buccal cavity devices market forecast, partnerships, mergers and acquisitions, geographical expansion, and product/service launches, to enhance their presence in the industry.
ACTEON Group - Delivering advanced buccal cavity devices, including sophisticated imaging systems and ultrasonic tools, to enhance diagnostic capabilities and support precise therapeutic applications in modern dentistry.
The industry research and growth report includes detailed analyses of the competitive landscape of the market and information about key companies, including:
- ACTEON Group
- Align Technology Inc.
- Carestream Dental LLC
- Cyber Medical Imaging Inc.
- Denterprise International Inc.
- Dentsply Sirona Inc.
- Detection Technology Plc
- DEXIS Imaging Suite
- E4D Technologies
- FONA Dental s.r.o.
- Hamamatsu Photonics KK
- J. Morita Corp.
- KaVo Dental GmbH
- Midmark Corp.
- Owandy Radiology
- Planet DDS Inc.
- Planmeca Oy
- Ray Co. Ltd.
- Trixell
- Varex Imaging Corp.
Qualitative and quantitative analysis of companies has been conducted to help clients understand the wider business environment as well as the strengths and weaknesses of key industry players. Data is qualitatively analyzed to categorize companies as pure play, category-focused, industry-focused, and diversified; it is quantitatively analyzed to categorize companies as dominant, leading, strong, tentative, and weak.
Recent Development and News in Buccal cavity devices market
- In August 2024, Waterpik introduced its Sensonic Electric Toothbrush, which features advanced sonic technology clinically proven to be more effective at removing plaque bacteria than manual brushing.
- In November 2024, Dentsply Sirona announced a partnership with Google to develop a medical-grade 3D printing solution, enabling comprehensive in-office workflows for creating patient-specific implants.
- In February 2025, Align Technology received expanded FDA clearance for its AI-powered iTero Lumina intraoral scanner, now approved for early caries detection to improve preventive dental care.
- In May 2025, Planmeca Oy acquired a leading dental software firm, bolstering its portfolio of cloud-enabled digital workflow integration solutions for specialty clinics and hospitals.
Dive into Technavio’s robust research methodology, blending expert interviews, extensive data synthesis, and validated models for unparalleled Buccal Cavity Devices Market insights. See full methodology.
| Market Scope | |
|---|---|
| Page number | 287 |
| Base year | 2024 |
| Historic period | 2019-2023 |
| Forecast period | 2025-2029 |
| Growth momentum & CAGR | Accelerate at a CAGR of 6.8% |
| Market growth 2025-2029 | USD 905.4 million |
| Market structure | Fragmented |
| YoY growth 2024-2025(%) | 6.3% |
| Key countries | US, Canada, Mexico, Germany, UK, Italy, France, Spain, The Netherlands, China, Japan, India, South Korea, Thailand, Indonesia, Brazil, Saudi Arabia, South Africa, Australia, Argentina, UAE, Egypt and Nigeria |
| Competitive landscape | Leading Companies, Market Positioning of Companies, Competitive Strategies, and Industry Risks |
Research Analyst Overview
- The buccal cavity devices market is undergoing a fundamental shift, compelling a strategic pivot in boardroom-level investment toward digital infrastructure and data-driven dentistry. The integration of AI-powered diagnostics is no longer a niche trend but a core competency for maintaining a competitive edge, with early adopters reporting a 15% improvement in diagnostic accuracy for certain conditions.
- This evolution encompasses a wide array of tools, from the intraoral scanner to full CBCT systems, all connected through sophisticated digital imaging software. Boardroom decisions must now prioritize capital allocation for these technologies to enhance restorative workflows and patient outcomes.
- The challenge lies not just in acquiring the technology but in re-architecting clinical processes and training personnel for effective digital workflow integration. Strategic focus is also turning toward non-invasive drug delivery systems, requiring new R&D investment in areas like mucoadhesive polymers, which will redefine therapeutic applications in the coming years.
What are the Key Data Covered in this Buccal Cavity Devices Market Research and Growth Report?
-
What is the expected growth of the Buccal Cavity Devices Market between 2025 and 2029?
-
USD 905.4 million, at a CAGR of 6.8%
-
-
What segmentation does the market report cover?
-
The report is segmented by Device (Electric toothbrushes, Flossing devices, Mouth rinses, Others), End-user (Hospitals, Specialty clinics, Research institutions), Application (Diagnostics, Therapeutics) and Geography (North America, Europe, Asia, Rest of World (ROW))
-
-
Which regions are analyzed in the report?
-
North America, Europe, Asia and Rest of World (ROW)
-
-
What are the key growth drivers and market challenges?
-
Increasing prevalence of dental diseases, Dental biomaterial evaluation tests in buccal cavity devices
-
-
Who are the major players in the Buccal Cavity Devices Market?
-
ACTEON Group, Align Technology Inc., Carestream Dental LLC, Cyber Medical Imaging Inc., Denterprise International Inc., Dentsply Sirona Inc., Detection Technology Plc, DEXIS Imaging Suite, E4D Technologies, FONA Dental s.r.o., Hamamatsu Photonics KK, J. Morita Corp., KaVo Dental GmbH, Midmark Corp., Owandy Radiology, Planet DDS Inc., Planmeca Oy, Ray Co. Ltd., Trixell and Varex Imaging Corp.
-
Market Research Insights
- The market dynamics are increasingly shaped by a focus on improving the patient experience and achieving superior clinical outcomes through technology. The adoption of digital workflow integration enhances operational efficiency in clinics, with some practices reporting a 15% reduction in appointment times for restorative procedures. This move toward data-driven dentistry is enabling more precise treatment visualization and holistic treatment planning.
- Furthermore, the demand for minimally invasive procedures is growing, supported by advancements that boost diagnostic accuracy by over 20% in early pathology detection. These shifts underscore the industry's commitment to advanced oral care solutions and improved dental practice management.
We can help! Our analysts can customize this buccal cavity devices market research report to meet your requirements.
 RIA -
RIA - 
