Intraoral Scanners Market Size 2025-2029
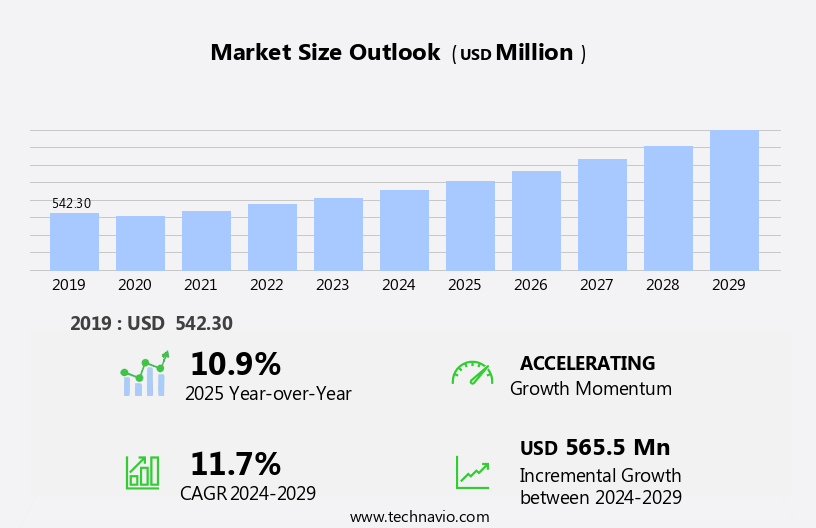
The intraoral scanners market size is forecast to increase by USD 565.5 million, at a CAGR of 11.7% between 2024 and 2029.
- The market is experiencing significant growth, driven by the increasing adoption of advanced technologies and features that enhance accuracy and productivity. These innovations enable dental professionals to create precise digital impressions, reducing the need for traditional, time-consuming methods. Furthermore, the rising prevalence of dental conditions necessitates the use of 3D dental scanners as more advanced diagnostic and treatment tools.
- Additionally, strategic partnerships and collaborations can help reduce costs and expand market reach. Overall, the market holds immense potential, with continuous advancements in technology and growing demand for digital dental solutions. However, the high-cost burden associated with these devices remains a notable challenge for market penetration, particularly in developing regions. To capitalize on market opportunities, companies must focus on developing cost-effective solutions while maintaining high-quality standards. Data security protocols, file format compatibility, color rendering capabilities, and image processing algorithms are essential for ensuring accuracy and precision.
What will be the Size of the Intraoral Scanners Market during the forecast period?
Get Key Insights on Market Forecast (PDF)
Request Free Sample
- The intraoral scanner market continues to evolve, driven by advancements in technology and expanding applications across various sectors. Cloud-based image storage enables seamless access to digital models, while software user interfaces are becoming more intuitive and user-friendly. Digital model generation through intraoral scanning is revolutionizing industries, from orthodontic treatment planning to restorative dentistry applications. For instance, a leading dental practice reported a 30% increase in treatment efficiency by implementing 3D intraoral imaging and digital impression technology. Industry growth is expected to reach double-digit percentages, with virtual articulator software, occlusal analysis tools, and implant planning software being key growth drivers.
- Scanning resolution metrics, texture mapping technology, and open architecture systems are crucial factors influencing market dynamics. Ergonomic design considerations, calibration procedures, and infection control measures are essential aspects of intraoral scanner development. Intraoral camera sensors, image stitching algorithms, and wireless data transmission are enhancing the user experience. Advanced features such as full-arch scanning capability, patient comfort features, and powder spray technology are becoming standard. Virtual articulator software, infection control measures, and scanner maintenance protocols are critical considerations for dental professionals.
- Market players are focusing on developing advanced intraoral scanners with improved scanning resolution, virtual articulator software, and digital impression accuracy. Ongoing research and development efforts are aimed at enhancing the user experience, optimizing workflows, and improving overall efficiency. Cloud-based data storage and wireless connectivity options streamline workflows, allowing for real-time collaboration and access to patient data.
How is this Intraoral Scanners Industry segmented?
The intraoral scanners industry research report provides comprehensive data (region-wise segment analysis), with forecasts and estimates in "USD million" for the period 2025-2029, as well as historical data from 2019-2023 for the following segments.
- End-user
- Dental clinics
- Hospitals
- Others
- Type
- Powder free
- Powder based
- Application
- Orthodontics
- Prosthodontics
- Implantology
- Geography
- North America
- US
- Canada
- Europe
- France
- Germany
- Italy
- UK
- APAC
- China
- India
- Japan
- South Korea
- Rest of World (ROW)
- North America
By End-user Insights
The Dental clinics segment is estimated to witness significant growth during the forecast period. Intraoral scanners have gained significant traction in the dental industry due to their ability to provide precise digital impressions for various applications. Cloud-based image storage enables easy access to these digital models, while software user interfaces ensure a seamless experience for dental professionals. Digital model generation through optical scanning technology offers improved accuracy compared to traditional methods, leading to better treatment outcomes. Virtual articulator software and occlusal analysis tools facilitate more effective orthodontic treatment planning. Restorative dentistry applications, such as implant planning and treatment simulation, have seen a rise in popularity. Infection control measures and ergonomic design considerations are essential factors in the selection of intraoral scanners. Prosthetic design software and CAD/CAM integration offer improved precision and efficiency in restorative dentistry applications. Image processing algorithms and surface texture capture provide enhanced detail and accuracy.
Calibration procedures ensure consistent scanning resolution metrics, while texture mapping technology enhances the accuracy of digital impressions. Industry growth is expected to remain strong, with a recent study projecting a 15% increase in market size over the next five years. Dental clinics, a significant market segment, are increasingly adopting these advanced tools for personalized care and operational efficiency. However, the high cost of scanners and the need for calibration and maintenance can hinder growth. Intraoral camera sensors and image stitching algorithms enable seamless image capture and processing, while open architecture systems and image processing algorithms offer flexibility and compatibility with various software and file formats.
Data security protocols and color rendering capabilities further enhance the value proposition of intraoral scanners. One dental clinic in the US reported a 30% increase in patient satisfaction after implementing an intraoral scanner system, underscoring the potential benefits for dental practices. Full-arch scanning capability and patient comfort features, such as powder spray technology, further expand the applications and appeal of these innovative tools. Future trends and developments in intraoral scanner technology include advancements in image processing algorithms, integration with artificial intelligence, and the use of augmented reality.
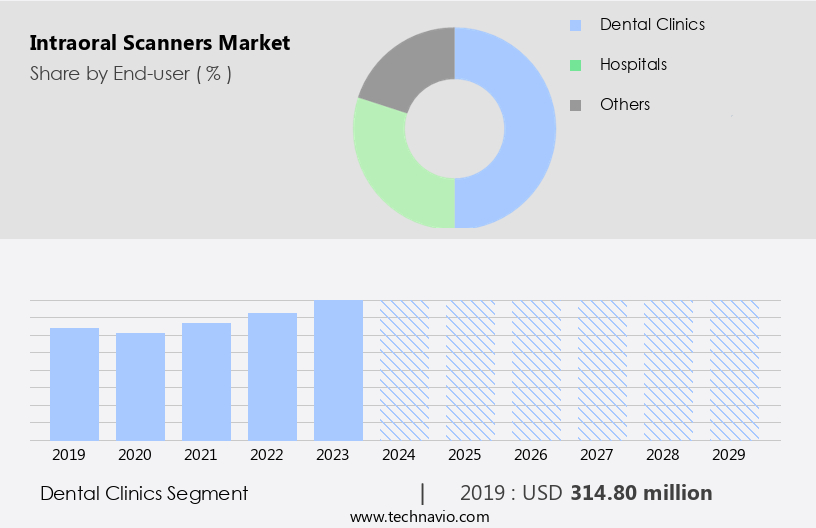
The Dental clinics segment was valued at USD 314.80 million in 2019 and showed a gradual increase during the forecast period.
The Intraoral Scanners Market is witnessing significant growth driven by advancements in CAD/CAM integration workflow and improved scan data acquisition speed. Enhanced orththodontic treatment planning and occlusal analysis software are enabling precise dental diagnostics, supported by high-quality intraoral camera sensor technology with advanced depth of field control. User-friendly software user interface designs and versatile 3D model export formats streamline operations. Tools like treatment simulation tools enhance patient engagement, while intraoral scanner accuracy improvements are measured through scan speed comparison. Seamless practice management integration and reduced system maintenance cost ensure operational efficiency. Regular software upgrade cycle and clear warranty terms conditions improve reliability.
Innovations in model detail enhancement and scan file size reduction support better data handling and interoperability via a software compatibility list. Optimized intraoral scanner image processing pipeline and efficient intraoral scanner hardware and software integration boost performance. The impact of intraoral scanner technology on dental practice efficiency is substantial, as revealed in the comparison of intraoral scanner technologies and features. Cost-benefit analysis of intraoral scanner implementation highlights strong ROI, supported by robust intraoral scanner data security and privacy considerations. Expanding applications include use of intraoral scanners for implant planning and surgical guides and applications of intraoral scanners in orthodontics and maxillofacial surgery, with attention to the effect of scanning parameters on intraoral scanner accuracy and efficiency and advanced features of intraoral scanners and their clinical implications.
Regional Analysis
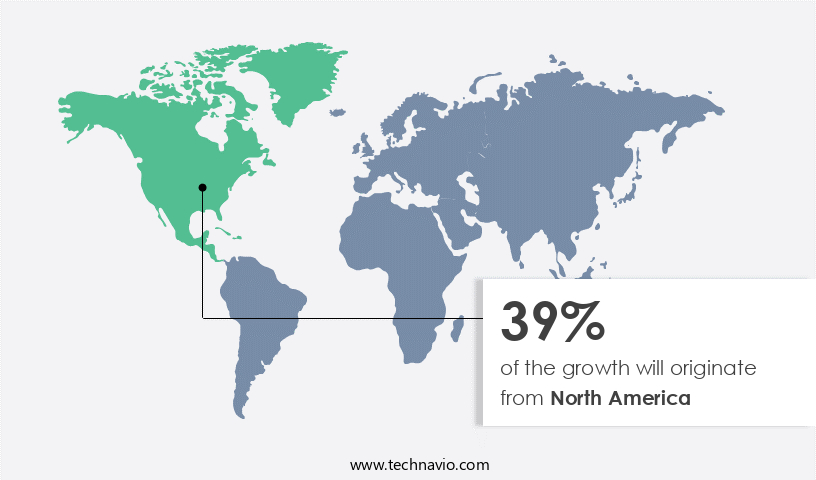
North America is estimated to contribute 39% to the growth of the global market during the forecast period. Technavio's analysts have elaborately explained the regional trends and drivers that shape the market during the forecast period.
See How intraoral scanners market Demand is Rising in North America Request Free Sample
The North American market is experiencing significant growth due to the integration of advanced technologies and clinical adoption in dental practices. Cloud-based image storage and wireless data transmission enable seamless access to digital models and patient records, while software user interfaces ensure a seamless workflow. Digital model generation through optical scanning technology and texture mapping facilitates precise orthodontic treatment planning and restorative dentistry applications. Virtual articulator software and implant planning tools offer engaging treatment simulation, enhancing accuracy and patient satisfaction. Infection control measures, such as powder-free scanning and ergonomic design considerations, prioritize patient safety and comfort.
Calibration procedures ensure scanner accuracy, while open architecture systems and image processing algorithms cater to diverse clinical needs. Full-arch scanning capability streamlines the scanning process, reducing chairside time. The market is expected to grow at a steady pace, with a significant increase in demand driven by the need for precision, workflow efficiency, and patient comfort. The presence of skilled dental professionals and academic institutions fosters innovation and supports the training required for effective utilization of these devices.
Market Dynamics
Our researchers analyzed the data with 2024 as the base year, along with the key drivers, trends, and challenges. A holistic analysis of drivers will help companies refine their marketing strategies to gain a competitive advantage. The market is experiencing significant growth due to the increasing adoption of digital dentistry workflow optimization strategies. Intraoral scanners, an essential tool in this digital transformation, facilitate the creation of high-precision 3D models of dental structures. The image processing pipeline of intraoral scanners plays a crucial role in ensuring 3D model accuracy assessment metrics. Hardware and software integration is a key consideration in the selection and implementation of intraoral scanners. Clinical evaluation of intraoral scanner performance is essential to assess its impact on dental practice efficiency.
Comparison of various intraoral scanner technologies and features is important for dentists and dental laboratories to make informed decisions. Patient acceptance of intraoral scanner technology is another critical factor in the market's growth. Cost-benefit analysis and return on investment are important considerations for dental practices looking to implement intraoral scanners. A comprehensive intraoral scanner system maintenance and troubleshooting guide is necessary to ensure optimal performance and longevity. Training and education programs for intraoral scanner users are essential to ensure proper usage and maximize clinical benefits. Integration of intraoral scanners with CAD/CAM milling systems streamlines the dental lab workflow. Data security and privacy considerations are important in the selection and implementation of intraoral scanner systems.
Clinical applications of intraoral scanners in restorative dentistry, implant planning and surgical guides, and orthodontics and maxillofacial surgery are expanding. Evaluation of the accuracy and reliability of intraoral scanners is ongoing, with ongoing research into the effect of scanning parameters on accuracy and efficiency. Advanced features of intraoral scanners, such as wireless connectivity and enhanced resolution, have significant clinical implications. These developments are expected to further enhance the clinical capabilities and efficiency of intraoral scanners in dental practices.
What are the key market drivers leading to the rise in the adoption of Intraoral Scanners Industry?
- The integration of advanced technologies and features, such as improved accuracy and productivity, is the primary catalyst fueling the market growth of intraoral scanners. Intraoral scanners have gained significant traction in the dental industry due to digitization and the adoption of Computer-Aided Design/Computer-Aided Manufacturing (CAD/CAM) technology. This shift towards digital processes enhances precision in restorative dentistry, ensuring superior-quality dental implants with accurate measurements. Customization and alignment of implants based on a patient's unique oral anatomy are now possible, leading to more effective patient treatment.
- The integration of these advanced technologies not only streamlines communication between dentists, laboratory technicians, and patients but also reduces the overall time required for dental procedures. CAD/CAM technology's influence on the market is undeniable, driving the production of aesthetically pleasing and durable dental restorations. The market is experiencing substantial growth, with industry experts projecting a 15% annual expansion rate. For instance, the implementation of intraoral scanners in dental practices has resulted in a 10% increase in sales for many dental clinics.
What are the market trends shaping the Intraoral Scanners Industry?
- The use of 3D dental scanners as advanced methods for addressing the increasing prevalence of dental conditions is a notable market trend. This technological innovation is mandatory for improving diagnostic accuracy and enhancing patient care. Intraoral scanners, specifically 3D dental scanners, represent a significant growth driver in the global market due to their advanced capabilities in diagnosing dental and orthodontic conditions. For instance, approximately 63% of adults in the US had a dental visit in 2020.
- The market is poised for substantial expansion, with industry experts anticipating robust growth in the coming years. 3D dental scanners' adoption is set to continue its upward trend, transforming the dental industry by enhancing accuracy, efficiency, and patient experience. These scanners are increasingly utilized in various dental disciplines, including orthodontics, endodontics, oral surgery, periodontics, and implant treatment planning. The rising prevalence of dental conditions, such as caries, gum diseases, and malocclusions, is fueling the demand for medical imaging solutions, like 3D dental scanners.
What challenges does the Intraoral Scanners Industry face during its growth?
- The high-cost burden poses a significant challenge to the industries growth trajectory. Intraoral scanners, innovative technological tools in dentistry, facilitate more precise and effective treatments for various oral health issues. These scanners enable dentists to generate accurate digital impressions of a patient's oral cavity, enhancing the fabrication process for prostheses and oral supporting structures. However, the high cost of these scanners and associated procedures can pose a challenge for many patients.
- For instance, a dental practice in California reported a 30% increase in prosthetic sales after implementing an intraoral scanner system. A recent study reported that approximately 40% of American families forego dental visits due to financial constraints. Despite these challenges, the market for intraoral scanners is projected to experience significant growth, with industry analysts estimating a 25% increase in demand over the next five years.
Exclusive Customer Landscape
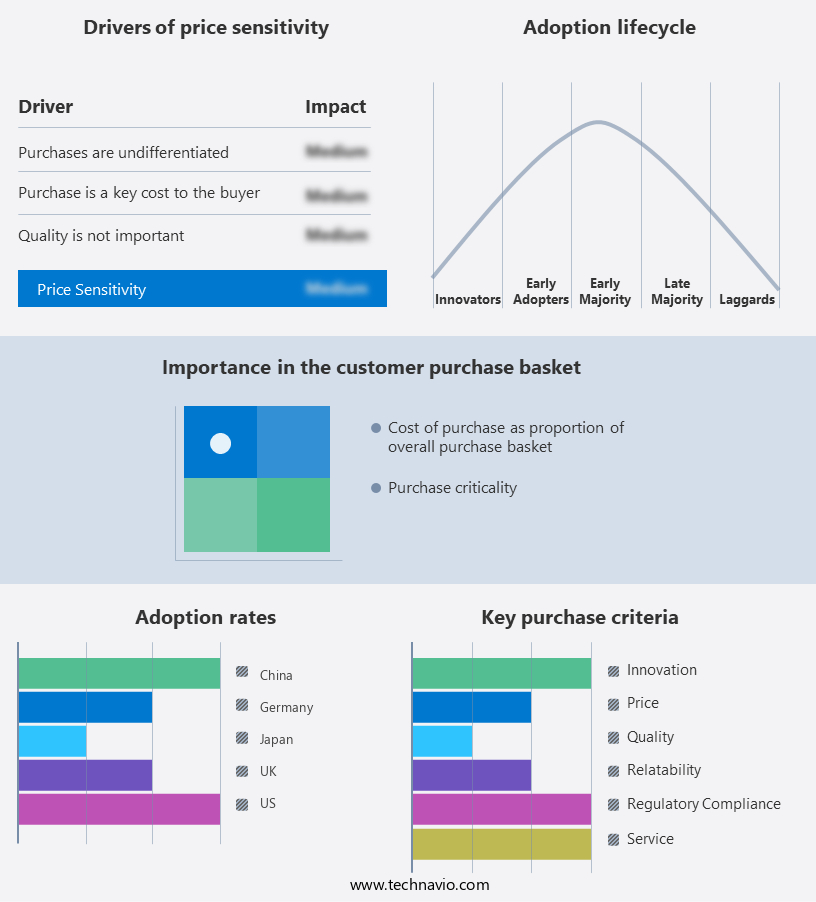
The intraoral scanners market forecasting report includes the adoption lifecycle of the market, covering from the innovator's stage to the laggard's stage. It focuses on adoption rates in different regions based on penetration. Furthermore, the intraoral scanners market report also includes key purchase criteria and drivers of price sensitivity to help companies evaluate and develop their market growth analysis strategies.
Customer Landscape
Key Companies & Market Insights
Companies are implementing various strategies, such as strategic alliances, intraoral scanners market forecast, partnerships, mergers and acquisitions, geographical expansion, and product/service launches, to enhance their presence in the industry.
3Shape AS - The company specializes in providing advanced intraoral scanning solutions, including the TRIOS 5 Wireless, TRIOS 4 Wireless, and TRIOS 3 Wired models.
The industry research and growth report includes detailed analyses of the competitive landscape of the market and information about key companies, including:
- 3Shape AS
- 8853 Spa
- Align Technology Inc.
- Densys Ltd.
- Denterprise International Inc.
- Dentsply Sirona Inc.
- Durr Dental SE
- Envista Holdings Corp.
- GC Corp.
- Glidewell
- Guangdong Launca Medical Device Technology Co. Ltd.
- Henry Schein Inc.
- Institut Straumann AG
- Intelliscan 3D
- Midmark Corp.
- Owandy Radiology
- Planmeca Oy
- Shining 3D Tech Co. Ltd.
- Vatech Co. Ltd.
Qualitative and quantitative analysis of companies has been conducted to help clients understand the wider business environment as well as the strengths and weaknesses of key industry players. Data is qualitatively analyzed to categorize companies as pure play, category-focused, industry-focused, and diversified; it is quantitatively analyzed to categorize companies as dominant, leading, strong, tentative, and weak.
Recent Development and News in Intraoral Scanners Market
- In January 2024, Dentsply Sirona, a leading dental solutions provider, launched the new TRIOS5 intraoral scanner, featuring advanced AI technology and improved workflow integration (Dentsply Sirona press release).
- In March 2024, 3Shape and Planmeca announced a strategic partnership to integrate 3Shape's TRIOS scanners with Planmeca's software solutions, expanding their collaborative offerings in digital dentistry (3Shape press release).
- In April 2025, Medtronic completed the acquisition of Signify Dental, a leading provider of intraoral scanning and imaging systems, bolstering Medtronic's dental portfolio and market presence (Medtronic press release).
- In May 2025, the European Commission approved the use of Carestream Dental's CS 3600 3D intraoral scanner, marking a significant regulatory milestone for the company and expanding its reach in the European market (Carestream Dental press release).
Research Analyst Overview
- The market for intraoral scanners continues to evolve, driven by advancements in digital dentistry workflows and expanding applications across various sectors. Scan field size and user training programs are crucial factors influencing market dynamics, with accuracy and color accuracy measurement playing significant roles in ensuring successful clinical case applications. Connectivity features, such as real-time image feedback and automatic scan alignment, streamline the patient registration process and enhance the overall user experience. Technical support services, 3D model reconstruction, and mesh processing quality are essential components of intraoral scanner systems, with software upgrade cycles and wireless connectivity range impacting the overall value proposition.
- Hardware specifications, warranty terms and conditions, software compatibility lists, scan speed comparisons, and powderless scanning options further differentiate offerings in the market. The industry is expected to grow at a rate of 12% annually, with increasing demand for improved image quality assessment and data management systems. For instance, a leading dental practice reported a 30% increase in productivity after implementing an intraoral scanner system with advanced color accuracy measurement and real-time image feedback capabilities. This example underscores the potential benefits of adopting these technologies, as the market continues to unfold and evolve.
Dive into Technavio's robust research methodology, blending expert interviews, extensive data synthesis, and validated models for unparalleled Intraoral Scanners Market insights. See full methodology.
|
Market Scope |
|
|
Report Coverage |
Details |
|
Page number |
216 |
|
Base year |
2024 |
|
Historic period |
2019-2023 |
|
Forecast period |
2025-2029 |
|
Growth momentum & CAGR |
Accelerate at a CAGR of 11.7% |
|
Market growth 2025-2029 |
USD 565.5 million |
|
Market structure |
Fragmented |
|
YoY growth 2024-2025(%) |
10.9 |
|
Key countries |
US, Canada, Germany, UK, China, France, Japan, Italy, South Korea, and India |
|
Competitive landscape |
Leading Companies, Market Positioning of Companies, Competitive Strategies, and Industry Risks |
What are the Key Data Covered in this Intraoral Scanners Market Research and Growth Report?
- CAGR of the Intraoral Scanners industry during the forecast period
- Detailed information on factors that will drive the growth and forecasting between 2025 and 2029
- Precise estimation of the size of the market and its contribution of the industry in focus to the parent market
- Accurate predictions about upcoming growth and trends and changes in consumer behaviour
- Growth of the market across North America, Europe, Asia, and Rest of World (ROW)
- Thorough analysis of the market's competitive landscape and detailed information about companies
- Comprehensive analysis of factors that will challenge the intraoral scanners market growth of industry companies
We can help! Our analysts can customize this intraoral scanners market research report to meet your requirements.
 RIA -
RIA - 
