Bulk Food Ingredient Market Analysis, Size, and Forecast 2026-2030: APAC (China, India, and Japan), North America (US, Canada, and Mexico), Europe (Germany, UK, and France), Middle East and Africa (Saudi Arabia, UAE, and South Africa), South America (Brazil, Argentina, and Colombia), and Rest of World (ROW)

Bulk Food Ingredient Market Analysis, Size, and Forecast 2026-2030:
APAC (China, India, and Japan), North America (US, Canada, and Mexico), Europe (Germany, UK, and France), Middle East and Africa (Saudi Arabia, UAE, and South Africa), South America (Brazil, Argentina, and Colombia), and Rest of World (ROW)

Published: Dec 2025 315 Pages SKU: IRTNTR81199

Market Overview at a Glance

$100.9 B
Market Opportunity
4.5%
CAGR 2025 - 2030
44.8%
APAC Growth
$162.5 B
Grains and cereals segment 2024

Bulk Food Ingredient Market Size 2026-2030

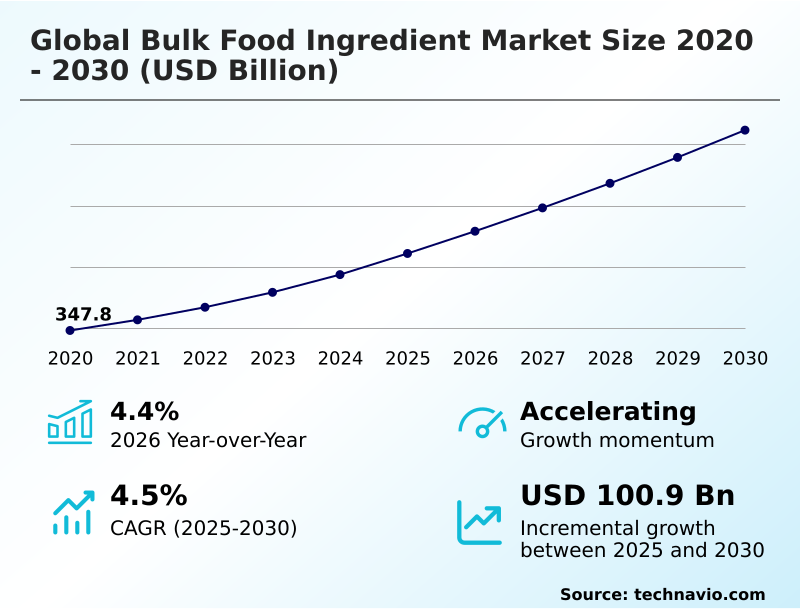
The bulk food ingredient market size is valued to increase by USD 100.9 billion, at a CAGR of 4.5% from 2025 to 2030. Escalating consumer demand for clean label and natural ingredients will drive the bulk food ingredient market.

Major Market Trends & Insights

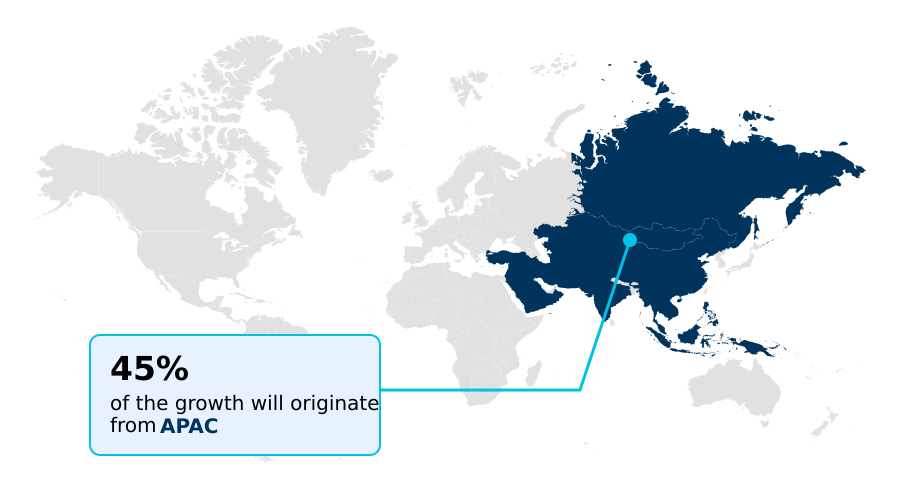
  • APAC dominated the market and accounted for a 44.8% growth during the forecast period.
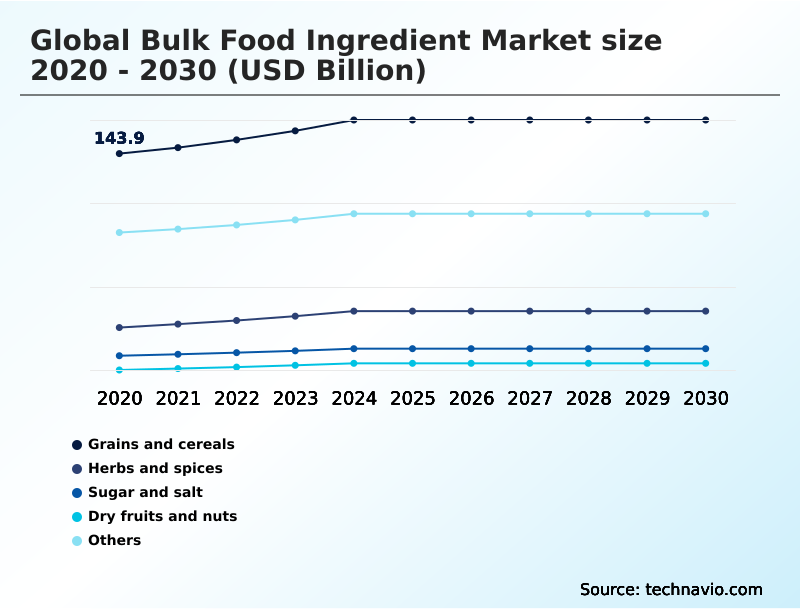
  • By Type - Grains and cereals segment was valued at USD 162.5 billion in 2024
  • By Application - Bakery and confectionery segment accounted for the largest market revenue share in 2024

Market Size & Forecast

  • Market Opportunities: USD 163.9 billion
  • Market Future Opportunities: USD 100.9 billion
  • CAGR from 2025 to 2030 : 4.5%

Market Summary

  • The bulk food ingredient market serves as the foundational layer of the food supply chain, providing essential components for industrial food production. This market is undergoing a significant transformation, driven by evolving consumer ethics that favor clean-label products, plant-based diets, and functional foods.
  • For instance, a major consumer packaged goods company aiming to launch a healthier snack line must navigate this landscape by reformulating products. This involves replacing artificial additives with natural preservatives, enriching items with plant proteins and fibers, and reducing sugar content with novel sweeteners. This process highlights the market's core dynamics: balancing innovation and health trends against persistent challenges.
  • These include navigating complex international regulations that differ by region and managing severe supply chain disruptions caused by geopolitical events and climate change. The industry's ability to innovate with ingredients that are sustainable, functional, and ethically sourced, while maintaining cost-effectiveness and supply resilience, will determine its future trajectory.
  • This strategic balancing act defines the operational reality for participants in the bulk food ingredient market.

What will be the Size of the Bulk Food Ingredient Market during the forecast period?

Get Key Insights on Market Forecast (PDF) Request Free Sample

How is the Bulk Food Ingredient Market Segmented?

The bulk food ingredient industry research report provides comprehensive data (region-wise segment analysis), with forecasts and estimates in "USD billion" for the period 2026-2030, as well as historical data from 2020-2024 for the following segments.

  • Type
    • Grains and cereals
    • Herbs and spices
    • Sugar and salt
    • Dry fruits and nuts
    • Others
  • Application
    • Bakery and confectionery
    • Beverages
    • Snacks and spreads
    • Ready meals
    • Others
  • Distribution channel
    • Direct from manufacturers
    • Distributors
  • Geography
    • APAC
      • China
      • India
      • Japan
    • North America
      • US
      • Canada
      • Mexico
    • Europe
      • Germany
      • UK
      • France
    • Middle East and Africa
      • Saudi Arabia
      • UAE
      • South Africa
    • South America
      • Brazil
      • Argentina
      • Colombia
    • Rest of World (ROW)

By Type Insights

The grains and cereals segment is estimated to witness significant growth during the forecast period.

The bulk food ingredient market is segmented by type, where grains and cereals are foundational, and by application, where demand from bakery, beverage, and ready meal sectors is strong.

The consumer shift toward on-the-go convenience drives the nutrient-dense snacks and shelf-stable meals categories, creating demand for functional components. This includes soy protein concentrates for protein enrichment and polydextrose for added fiber.

In beverages, ingredients like L-theanine and ashwagandha are gaining traction for functional benefits. The need for dairy alternatives and gluten-free alternatives is reshaping the use of traditional ingredients.

Furthermore, food manufacturers are incorporating yeast extracts and potassium chloride for sodium reduction, while a focus on wellness boosts demand for collagen peptides. Corporate commitments increasingly require deforestation-free supply chains, impacting sourcing strategies globally.

Request Free Sample

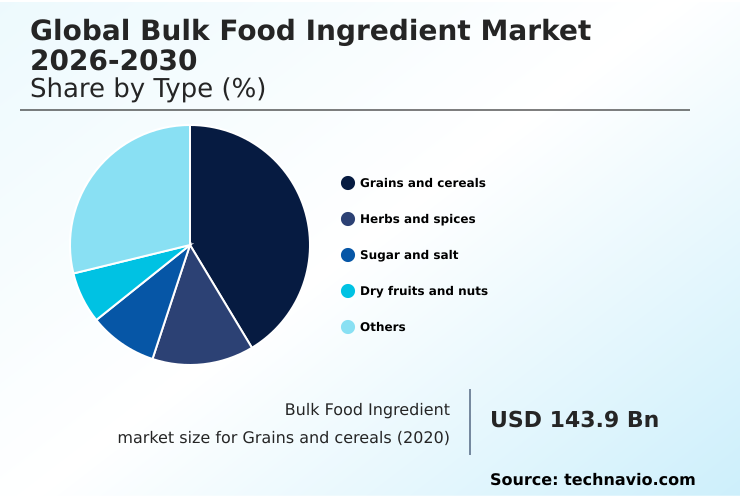
The Grains and cereals segment was valued at USD 162.5 billion in 2024 and showed a gradual increase during the forecast period.

Request Free Sample

Regional Analysis

APAC is estimated to contribute 44.8% to the growth of the global market during the forecast period.Technavio’s analysts have elaborately explained the regional trends and drivers that shape the market during the forecast period.

See How Bulk Food Ingredient Market Demand is Rising in APAC Request Free Sample

The APAC region is the fastest-growing market, contributing over 44% of the incremental growth, driven by an expanding food processing sector in countries like China and India.

This fuels demand for a wide range of ingredients, from commodity native starches to specialty flavorings and savory flavor systems.

In contrast, mature markets in Europe and North America focus on value-added products, driving innovation in sugar reduction solutions using stevia and monk fruit. European regulations are pushing for environmental social governance (ESG) compliance, making sustainable sourcing a prerequisite.

This has accelerated the adoption of steam sterilization and non-eto treatment for spices and rosemary extract for preservation.

Investment in cold chain infrastructure remains critical globally, improving the supply of ingredients like chicory root fiber and plant-based gelling systems, which are essential for many upcycled food byproducts.

Market Dynamics

Our researchers analyzed the data with 2025 as the base year, along with the key drivers, trends, and challenges. A holistic analysis of drivers will help companies refine their marketing strategies to gain a competitive advantage.

  • Strategic formulation is at the forefront of the global bulk food ingredient market 2026-2030, with a significant emphasis on clean label ingredients for bakery and functional ingredients for beverages. This drives the adoption of plant protein isolates for meat analogues and specialized hydrocolloids for dairy alternative texture, addressing consumer demand for healthier options.
  • Sourcing strategies are also evolving, highlighted by the push for sustainable sourcing of cocoa ingredients and the adoption of regenerative agriculture for grain sourcing. This has increased the importance of traceability technology in food supply chains, where firms that have implemented such systems report a 25% faster response to quality inquiries compared to those using manual methods.
  • The industry is also focused on innovation, with natural sweeteners versus artificial sweeteners being a key consideration in product development, leading to the wider use of options like allulose and stevia for sugar replacement. The use of upcycled ingredients in circular economy models is growing, and fortification with micronutrient premixes addresses public health goals.
  • However, significant challenges in the bulk food ingredient supply chain, including the impact of geopolitics on commodity prices and complex sodium reduction strategies in processed foods, require constant strategic management. The use of clean label texturizers replacing modified starches, probiotics in functional food formulation, and botanical extracts for stress relief beverages showcases the market's innovative direction.
  • Companies must balance cost-effective ingredients for ready meals with the need to meet stringent halal certified ingredients for export markets.

What are the key market drivers leading to the rise in the adoption of Bulk Food Ingredient Industry?

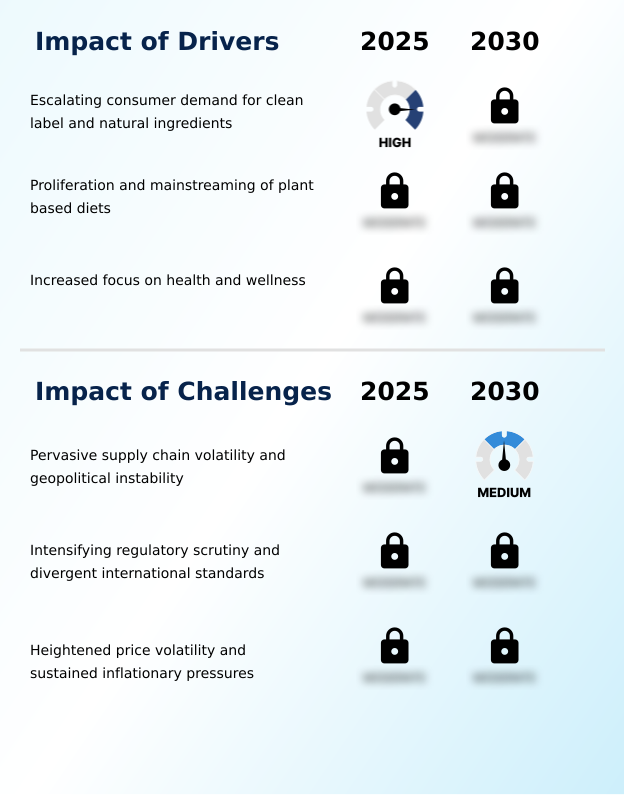
  • The escalating consumer demand for clean label and natural ingredients serves as a key driver for growth and innovation within the market.

  • The 'food as medicine' movement is a major driver, creating robust demand for ingredients that support wellness.
  • Formulations now incorporate probiotics and prebiotics for gut health modulation, a segment where clinical studies have shown specific dietary fibers can improve outcomes by up to 25%.
  • This has led to the mainstreaming of botanical extracts and nootropic compounds in functional beverages.
  • The push for healthier products also fuels the market for sodium reduction solutions and sugar reduction solutions, with regulatory goals targeting a 15% decrease in sodium in certain food categories.
  • Manufacturers are actively reformulating to create allergen-free products and prioritize non-gmo ingredients, using technologies like cold-pressure processing and natural preservatives such as cultured dextrose to deliver cleaner, safer products.

What are the market trends shaping the Bulk Food Ingredient Industry?

  • The increasing importance of sustainable and ethically sourced ingredients represents a significant emerging market trend. This shift is reshaping procurement strategies and influencing consumer purchasing decisions across the food industry.

  • A dominant trend is the pivot to sustainable sourcing, with corporate initiatives committing to regenerative agriculture on over 10 million acres of farmland. This emphasis on ethical transparency requires advanced supply chain traceability systems. Concurrently, innovation in upcycled ingredients is turning manufacturing byproducts into valuable functional ingredients, with some firms achieving a 20% waste reduction.
  • The expansion of plant-based analogues is driving demand for plant protein isolates and hydrocolloids for texture. Manufacturers are adopting clean label texturizers and natural colorants to meet consumer demand for simple products, a core tenet of clean label formulation.
  • This aligns with the food as medicine concept, where ingredient choice is linked to health outcomes, a preference cited by over 60% of consumers.

What challenges does the Bulk Food Ingredient Industry face during its growth?

  • Pervasive supply chain volatility, compounded by geopolitical instability, presents a key challenge affecting the growth and stability of the industry.

  • Pervasive supply chain volatility presents a significant challenge, with geopolitical events causing transit time increases of 10-15 days and freight cost surges of over 200% on key routes. This instability affects the reliable supply of commodities, including textured vegetable protein and demineralized whey.
  • Concurrently, divergent international standards for food fortification with micronutrient premixes and approvals for novel ingredients like allulose create complexity. Navigating requirements for halal certification and kosher certification adds further operational overhead. While technologies such as high-pressure processing aid in natural preservation, the high capital investment is a barrier.
  • Meanwhile, nascent sectors like cellular agriculture and other food-tech ventures face long-term uncertainty regarding regulatory pathways for ingredients such as gellan gum and methylcellulose.

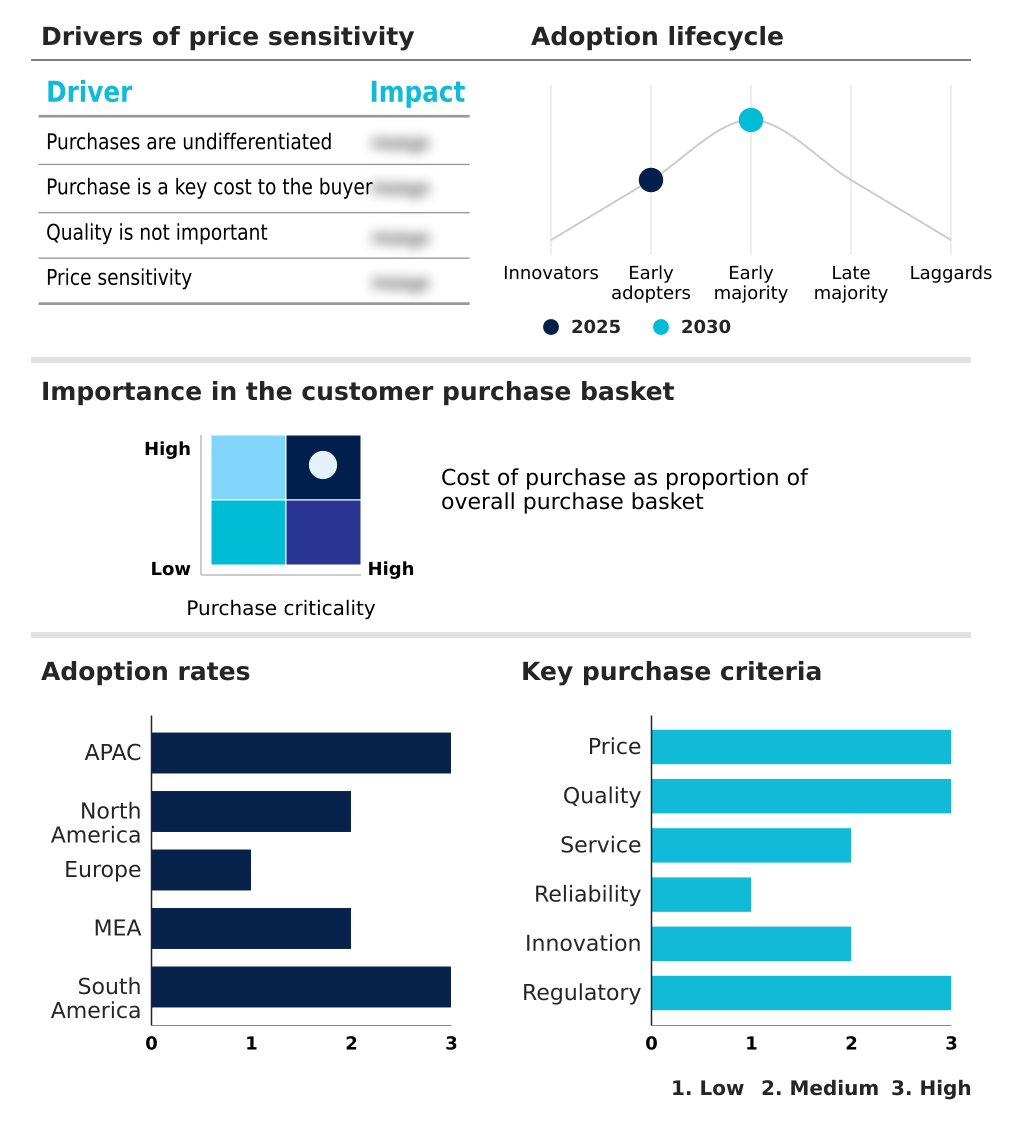
Exclusive Technavio Analysis on Customer Landscape

The bulk food ingredient market forecasting report includes the adoption lifecycle of the market, covering from the innovator’s stage to the laggard’s stage. It focuses on adoption rates in different regions based on penetration. Furthermore, the bulk food ingredient market report also includes key purchase criteria and drivers of price sensitivity to help companies evaluate and develop their market growth analysis strategies.

Customer Landscape of Bulk Food Ingredient Industry

Competitive Landscape

Companies are implementing various strategies, such as strategic alliances, bulk food ingredient market forecast, partnerships, mergers and acquisitions, geographical expansion, and product/service launches, to enhance their presence in the industry.

Ajinomoto Co. Inc. - The landscape is defined by diversified agribusinesses and specialized firms providing a vast portfolio of commodity, functional, and value-added ingredients to the food and beverage sector.

The industry research and growth report includes detailed analyses of the competitive landscape of the market and information about key companies, including:

  • Ajinomoto Co. Inc.
  • Archer Daniels Midland Co.
  • Barry Callebaut AG
  • BASF SE
  • Beneo GmbH
  • Bunge Global SA
  • CP Kelco US Inc.
  • DSM Firmenich AG
  • Fonterra Cooperative Group Ltd.
  • Givaudan SA
  • Glanbia plc
  • Ingredion Inc.
  • International Flavors Inc.
  • Kerry Group Plc
  • Novonesis Group
  • Roquette Freres SA
  • Royal Friesland Campina NV
  • Symrise Group
  • Tate and Lyle PLC
  • Wilmar International Ltd.

Qualitative and quantitative analysis of companies has been conducted to help clients understand the wider business environment as well as the strengths and weaknesses of key industry players. Data is qualitatively analyzed to categorize companies as pure play, category-focused, industry-focused, and diversified; it is quantitatively analyzed to categorize companies as dominant, leading, strong, tentative, and weak.

Recent Development and News in Bulk food ingredient market

  • In September 2024, Archer Daniels Midland Co. announced the acquisition of a European food-tech startup specializing in precision fermentation for USD 150 million, aiming to scale up production of novel dairy-alternative proteins.
  • In November 2024, Tate & Lyle PLC launched its new 'Sweeten-Pro' line, an advanced allulose-based sweetening system designed to replicate the mouthfeel and browning of sucrose in bakery applications with 90% fewer calories.
  • In January 2025, the US Food and Drug Administration (FDA) issued final guidance requiring mandatory supply chain traceability for high-risk bulk food ingredients, including certain spices and nuts, to combat foodborne illness outbreaks.
  • In April 2025, Cargill Inc. announced a major expansion of its regenerative agriculture program in South America, partnering with local cooperatives to transition 5 million acres of soy and corn farmland to sustainable practices by 2030.

Dive into Technavio’s robust research methodology, blending expert interviews, extensive data synthesis, and validated models for unparalleled Bulk Food Ingredient Market insights. See full methodology.

Market Scope
Page number 315
Base year 2025
Historic period 2020-2024
Forecast period 2026-2030
Growth momentum & CAGR Accelerate at a CAGR of 4.5%
Market growth 2026-2030 USD 100.9 billion
Market structure Fragmented
YoY growth 2025-2026(%) 4.4%
Key countries China, India, Japan, South Korea, Australia, Indonesia, US, Canada, Mexico, Germany, UK, France, Italy, Spain, The Netherlands, Saudi Arabia, UAE, South Africa, Israel, Turkey, Brazil, Argentina and Colombia
Competitive landscape Leading Companies, Market Positioning of Companies, Competitive Strategies, and Industry Risks

Request Free Sample

Research Analyst Overview

  • The bulk food ingredient market is defined by a strategic pivot from commodity supply to science-backed solutions. Boardroom-level decisions now center on balancing investment in R&D for high-value functional ingredients against the need to secure volatile raw material supply chains. The market is increasingly rewarding innovation in clean label texturizers, plant protein isolates, and specialized hydrocolloids.
  • Companies focusing on these areas report that their new product development cycles are up to 30% faster than those centered on traditional commodities. This shift is driven by consumer demand for healthier products featuring probiotics, prebiotics, and natural colorants.
  • Consequently, suppliers must offer not just ingredients like dietary fibers and botanical extracts but also the formulation expertise to integrate them effectively. Success now depends on providing a portfolio of advanced components, including nootropic compounds, cold-pressure processing compatible items, and natural preservatives like cultured dextrose, to meet the complex demands of modern food manufacturing.

What are the Key Data Covered in this Bulk Food Ingredient Market Research and Growth Report?

  • What is the expected growth of the Bulk Food Ingredient Market between 2026 and 2030?

    • USD 100.9 billion, at a CAGR of 4.5%

  • What segmentation does the market report cover?

    • The report is segmented by Type (Grains and cereals, Herbs and spices, Sugar and salt, Dry fruits and nuts, and Others), Application (Bakery and confectionery, Beverages, Snacks and spreads, Ready meals, and Others), Distribution Channel (Direct from manufacturers, and Distributors) and Geography (APAC, North America, Europe, Middle East and Africa, South America)

  • Which regions are analyzed in the report?

    • APAC, North America, Europe, Middle East and Africa and South America

  • What are the key growth drivers and market challenges?

    • Escalating consumer demand for clean label and natural ingredients, Pervasive supply chain volatility and geopolitical instability

  • Who are the major players in the Bulk Food Ingredient Market?

    • Ajinomoto Co. Inc., Archer Daniels Midland Co., Barry Callebaut AG, BASF SE, Beneo GmbH, Bunge Global SA, CP Kelco US Inc., DSM Firmenich AG, Fonterra Cooperative Group Ltd., Givaudan SA, Glanbia plc, Ingredion Inc., International Flavors Inc., Kerry Group Plc, Novonesis Group, Roquette Freres SA, Royal Friesland Campina NV, Symrise Group, Tate and Lyle PLC and Wilmar International Ltd.

Market Research Insights

  • Market dynamics are increasingly shaped by strategic pivots toward value-added offerings. The demand for plant-based analogues and ingredients supporting sustainable sourcing is compelling suppliers to innovate beyond commodities, with firms leveraging advanced supply chain traceability reporting a 15% improvement in meeting ESG compliance metrics. This shift toward ethical transparency is not just consumer-driven; it enhances operational resilience.
  • The focus on food as medicine is expanding the use of specialized ingredients, while a commitment to clean label formulation is now a baseline expectation. As a result, suppliers that offer robust technical support for reformulation and can verify claims through transparent sourcing command a competitive advantage, achieving up to a 10% higher customer retention rate compared to commodity-focused peers.

We can help! Our analysts can customize this bulk food ingredient market research report to meet your requirements.

Get in touch

1. Executive Summary

1.1 Market overview

Executive Summary - Chart on Market Overview
Executive Summary - Data Table on Market Overview
Executive Summary - Chart on Global Market Characteristics
Executive Summary - Chart on Market by Geography
Executive Summary - Chart on Market Segmentation by Type
Executive Summary - Chart on Market Segmentation by Application
Executive Summary - Chart on Market Segmentation by Distribution Channel
Executive Summary - Chart on Incremental Growth
Executive Summary - Data Table on Incremental Growth
Executive Summary - Chart on Company Market Positioning

2. Technavio Analysis

2.1 Analysis of price sensitivity, lifecycle, customer purchase basket, adoption rates, and purchase criteria

2.2 Criticality of inputs and Factors of differentiation

Chart on Overview on criticality of inputs and factors of differentiation

2.3 Factors of disruption

Chart on Overview on factors of disruption

2.4 Impact of drivers and challenges

Chart on Impact of drivers and challenges in 2025 and 2030

3. Market Landscape

3.1 Market ecosystem

Chart on Parent Market
Data Table on - Parent Market

3.2 Market characteristics

Chart on Market characteristics analysis

3.3 Value chain analysis

Chart on Value chain analysis

4. Market Sizing

4.1 Market definition

Data Table on Offerings of companies included in the market definition

4.2 Market segment analysis

Market segments

4.3 Market size 2025

4.4 Market outlook: Forecast for 2025-2030

Chart on Global - Market size and forecast 2025-2030 ($ billion)
Data Table on Global - Market size and forecast 2025-2030 ($ billion)
Chart on Global Market: Year-over-year growth 2025-2030 (%)
Data Table on Global Market: Year-over-year growth 2025-2030 (%)

5. Historic Market Size

5.1 Global Bulk Food Ingredient Market 2020 - 2024

Historic Market Size - Data Table on Global Bulk Food Ingredient Market 2020 - 2024 ($ billion)

5.2 Type segment analysis 2020 - 2024

Historic Market Size - Type Segment 2020 - 2024 ($ billion)

5.3 Application segment analysis 2020 - 2024

Historic Market Size - Application Segment 2020 - 2024 ($ billion)

5.4 Distribution Channel segment analysis 2020 - 2024

Historic Market Size - Distribution Channel Segment 2020 - 2024 ($ billion)

5.5 Geography segment analysis 2020 - 2024

Historic Market Size - Geography Segment 2020 - 2024 ($ billion)

5.6 Country segment analysis 2020 - 2024

Historic Market Size - Country Segment 2020 - 2024 ($ billion)

6. Qualitative Analysis

6.1 Impact of AI on the Global Bulk Food Ingredient Market

7. Five Forces Analysis

7.1 Five forces summary

Five forces analysis - Comparison between 2025 and 2030

7.2 Bargaining power of buyers

Bargaining power of buyers - Impact of key factors 2025 and 2030

7.3 Bargaining power of suppliers

Bargaining power of suppliers - Impact of key factors in 2025 and 2030

7.4 Threat of new entrants

Threat of new entrants - Impact of key factors in 2025 and 2030

7.5 Threat of substitutes

Threat of substitutes - Impact of key factors in 2025 and 2030

7.6 Threat of rivalry

Threat of rivalry - Impact of key factors in 2025 and 2030

7.7 Market condition

Chart on Market condition - Five forces 2025 and 2030

8. Market Segmentation by Type

8.1 Market segments

Chart on Type - Market share 2025-2030 (%)
Data Table on Type - Market share 2025-2030 (%)

8.2 Comparison by Type

Chart on Comparison by Type
Data Table on Comparison by Type

8.3 Grains and cereals - Market size and forecast 2025-2030

Chart on Grains and cereals - Market size and forecast 2025-2030 ($ billion)
Data Table on Grains and cereals - Market size and forecast 2025-2030 ($ billion)
Chart on Grains and cereals - Year-over-year growth 2025-2030 (%)
Data Table on Grains and cereals - Year-over-year growth 2025-2030 (%)

8.4 Herbs and spices - Market size and forecast 2025-2030

Chart on Herbs and spices - Market size and forecast 2025-2030 ($ billion)
Data Table on Herbs and spices - Market size and forecast 2025-2030 ($ billion)
Chart on Herbs and spices - Year-over-year growth 2025-2030 (%)
Data Table on Herbs and spices - Year-over-year growth 2025-2030 (%)

8.5 Sugar and salt - Market size and forecast 2025-2030

Chart on Sugar and salt - Market size and forecast 2025-2030 ($ billion)
Data Table on Sugar and salt - Market size and forecast 2025-2030 ($ billion)
Chart on Sugar and salt - Year-over-year growth 2025-2030 (%)
Data Table on Sugar and salt - Year-over-year growth 2025-2030 (%)

8.6 Dry fruits and nuts - Market size and forecast 2025-2030

Chart on Dry fruits and nuts - Market size and forecast 2025-2030 ($ billion)
Data Table on Dry fruits and nuts - Market size and forecast 2025-2030 ($ billion)
Chart on Dry fruits and nuts - Year-over-year growth 2025-2030 (%)
Data Table on Dry fruits and nuts - Year-over-year growth 2025-2030 (%)

8.7 Others - Market size and forecast 2025-2030

Chart on Others - Market size and forecast 2025-2030 ($ billion)
Data Table on Others - Market size and forecast 2025-2030 ($ billion)
Chart on Others - Year-over-year growth 2025-2030 (%)
Data Table on Others - Year-over-year growth 2025-2030 (%)

8.8 Market opportunity by Type

Market opportunity by Type ($ billion)
Data Table on Market opportunity by Type ($ billion)

9. Market Segmentation by Application

9.1 Market segments

Chart on Application - Market share 2025-2030 (%)
Data Table on Application - Market share 2025-2030 (%)

9.2 Comparison by Application

Chart on Comparison by Application
Data Table on Comparison by Application

9.3 Bakery and confectionery - Market size and forecast 2025-2030

Chart on Bakery and confectionery - Market size and forecast 2025-2030 ($ billion)
Data Table on Bakery and confectionery - Market size and forecast 2025-2030 ($ billion)
Chart on Bakery and confectionery - Year-over-year growth 2025-2030 (%)
Data Table on Bakery and confectionery - Year-over-year growth 2025-2030 (%)

9.4 Beverages - Market size and forecast 2025-2030

Chart on Beverages - Market size and forecast 2025-2030 ($ billion)
Data Table on Beverages - Market size and forecast 2025-2030 ($ billion)
Chart on Beverages - Year-over-year growth 2025-2030 (%)
Data Table on Beverages - Year-over-year growth 2025-2030 (%)

9.5 Snacks and spreads - Market size and forecast 2025-2030

Chart on Snacks and spreads - Market size and forecast 2025-2030 ($ billion)
Data Table on Snacks and spreads - Market size and forecast 2025-2030 ($ billion)
Chart on Snacks and spreads - Year-over-year growth 2025-2030 (%)
Data Table on Snacks and spreads - Year-over-year growth 2025-2030 (%)

9.6 Ready meals - Market size and forecast 2025-2030

Chart on Ready meals - Market size and forecast 2025-2030 ($ billion)
Data Table on Ready meals - Market size and forecast 2025-2030 ($ billion)
Chart on Ready meals - Year-over-year growth 2025-2030 (%)
Data Table on Ready meals - Year-over-year growth 2025-2030 (%)

9.7 Others - Market size and forecast 2025-2030

Chart on Others - Market size and forecast 2025-2030 ($ billion)
Data Table on Others - Market size and forecast 2025-2030 ($ billion)
Chart on Others - Year-over-year growth 2025-2030 (%)
Data Table on Others - Year-over-year growth 2025-2030 (%)

9.8 Market opportunity by Application

Market opportunity by Application ($ billion)
Data Table on Market opportunity by Application ($ billion)

10. Market Segmentation by Distribution Channel

10.1 Market segments

Chart on Distribution Channel - Market share 2025-2030 (%)
Data Table on Distribution Channel - Market share 2025-2030 (%)

10.2 Comparison by Distribution Channel

Chart on Comparison by Distribution Channel
Data Table on Comparison by Distribution Channel

10.3 Direct from manufacturers - Market size and forecast 2025-2030

Chart on Direct from manufacturers - Market size and forecast 2025-2030 ($ billion)
Data Table on Direct from manufacturers - Market size and forecast 2025-2030 ($ billion)
Chart on Direct from manufacturers - Year-over-year growth 2025-2030 (%)
Data Table on Direct from manufacturers - Year-over-year growth 2025-2030 (%)

10.4 Distributors - Market size and forecast 2025-2030

Chart on Distributors - Market size and forecast 2025-2030 ($ billion)
Data Table on Distributors - Market size and forecast 2025-2030 ($ billion)
Chart on Distributors - Year-over-year growth 2025-2030 (%)
Data Table on Distributors - Year-over-year growth 2025-2030 (%)

10.5 Market opportunity by Distribution Channel

Market opportunity by Distribution Channel ($ billion)
Data Table on Market opportunity by Distribution Channel ($ billion)

11. Customer Landscape

11.1 Customer landscape overview

Analysis of price sensitivity, lifecycle, customer purchase basket, adoption rates, and purchase criteria

12. Geographic Landscape

12.1 Geographic segmentation

Chart on Market share by geography 2025-2030 (%)
Data Table on Market share by geography 2025-2030 (%)

12.2 Geographic comparison

Chart on Geographic comparison
Data Table on Geographic comparison

12.3 APAC - Market size and forecast 2025-2030

Chart on APAC - Market size and forecast 2025-2030 ($ billion)
Data Table on APAC - Market size and forecast 2025-2030 ($ billion)
Chart on APAC - Year-over-year growth 2025-2030 (%)
Data Table on APAC - Year-over-year growth 2025-2030 (%)
Chart on Regional Comparison - APAC
Data Table on Regional Comparison - APAC

12.3.1 China - Market size and forecast 2025-2030

Chart on China - Market size and forecast 2025-2030 ($ billion)
Data Table on China - Market size and forecast 2025-2030 ($ billion)
Chart on China - Year-over-year growth 2025-2030 (%)
Data Table on China - Year-over-year growth 2025-2030 (%)

12.3.2 India - Market size and forecast 2025-2030

Chart on India - Market size and forecast 2025-2030 ($ billion)
Data Table on India - Market size and forecast 2025-2030 ($ billion)
Chart on India - Year-over-year growth 2025-2030 (%)
Data Table on India - Year-over-year growth 2025-2030 (%)

12.3.3 Japan - Market size and forecast 2025-2030

Chart on Japan - Market size and forecast 2025-2030 ($ billion)
Data Table on Japan - Market size and forecast 2025-2030 ($ billion)
Chart on Japan - Year-over-year growth 2025-2030 (%)
Data Table on Japan - Year-over-year growth 2025-2030 (%)

12.3.4 South Korea - Market size and forecast 2025-2030

Chart on South Korea - Market size and forecast 2025-2030 ($ billion)
Data Table on South Korea - Market size and forecast 2025-2030 ($ billion)
Chart on South Korea - Year-over-year growth 2025-2030 (%)
Data Table on South Korea - Year-over-year growth 2025-2030 (%)

12.3.5 Australia - Market size and forecast 2025-2030

Chart on Australia - Market size and forecast 2025-2030 ($ billion)
Data Table on Australia - Market size and forecast 2025-2030 ($ billion)
Chart on Australia - Year-over-year growth 2025-2030 (%)
Data Table on Australia - Year-over-year growth 2025-2030 (%)

12.3.6 Indonesia - Market size and forecast 2025-2030

Chart on Indonesia - Market size and forecast 2025-2030 ($ billion)
Data Table on Indonesia - Market size and forecast 2025-2030 ($ billion)
Chart on Indonesia - Year-over-year growth 2025-2030 (%)
Data Table on Indonesia - Year-over-year growth 2025-2030 (%)

12.4 North America - Market size and forecast 2025-2030

Chart on North America - Market size and forecast 2025-2030 ($ billion)
Data Table on North America - Market size and forecast 2025-2030 ($ billion)
Chart on North America - Year-over-year growth 2025-2030 (%)
Data Table on North America - Year-over-year growth 2025-2030 (%)
Chart on Regional Comparison - North America
Data Table on Regional Comparison - North America

12.4.1 US - Market size and forecast 2025-2030

Chart on US - Market size and forecast 2025-2030 ($ billion)
Data Table on US - Market size and forecast 2025-2030 ($ billion)
Chart on US - Year-over-year growth 2025-2030 (%)
Data Table on US - Year-over-year growth 2025-2030 (%)

12.4.2 Canada - Market size and forecast 2025-2030

Chart on Canada - Market size and forecast 2025-2030 ($ billion)
Data Table on Canada - Market size and forecast 2025-2030 ($ billion)
Chart on Canada - Year-over-year growth 2025-2030 (%)
Data Table on Canada - Year-over-year growth 2025-2030 (%)

12.4.3 Mexico - Market size and forecast 2025-2030

Chart on Mexico - Market size and forecast 2025-2030 ($ billion)
Data Table on Mexico - Market size and forecast 2025-2030 ($ billion)
Chart on Mexico - Year-over-year growth 2025-2030 (%)
Data Table on Mexico - Year-over-year growth 2025-2030 (%)

12.5 Europe - Market size and forecast 2025-2030

Chart on Europe - Market size and forecast 2025-2030 ($ billion)
Data Table on Europe - Market size and forecast 2025-2030 ($ billion)
Chart on Europe - Year-over-year growth 2025-2030 (%)
Data Table on Europe - Year-over-year growth 2025-2030 (%)
Chart on Regional Comparison - Europe
Data Table on Regional Comparison - Europe

12.5.1 Germany - Market size and forecast 2025-2030

Chart on Germany - Market size and forecast 2025-2030 ($ billion)
Data Table on Germany - Market size and forecast 2025-2030 ($ billion)
Chart on Germany - Year-over-year growth 2025-2030 (%)
Data Table on Germany - Year-over-year growth 2025-2030 (%)

12.5.2 UK - Market size and forecast 2025-2030

Chart on UK - Market size and forecast 2025-2030 ($ billion)
Data Table on UK - Market size and forecast 2025-2030 ($ billion)
Chart on UK - Year-over-year growth 2025-2030 (%)
Data Table on UK - Year-over-year growth 2025-2030 (%)

12.5.3 France - Market size and forecast 2025-2030

Chart on France - Market size and forecast 2025-2030 ($ billion)
Data Table on France - Market size and forecast 2025-2030 ($ billion)
Chart on France - Year-over-year growth 2025-2030 (%)
Data Table on France - Year-over-year growth 2025-2030 (%)

12.5.4 Italy - Market size and forecast 2025-2030

Chart on Italy - Market size and forecast 2025-2030 ($ billion)
Data Table on Italy - Market size and forecast 2025-2030 ($ billion)
Chart on Italy - Year-over-year growth 2025-2030 (%)
Data Table on Italy - Year-over-year growth 2025-2030 (%)

12.5.5 Spain - Market size and forecast 2025-2030

Chart on Spain - Market size and forecast 2025-2030 ($ billion)
Data Table on Spain - Market size and forecast 2025-2030 ($ billion)
Chart on Spain - Year-over-year growth 2025-2030 (%)
Data Table on Spain - Year-over-year growth 2025-2030 (%)

12.5.6 The Netherlands - Market size and forecast 2025-2030

Chart on The Netherlands - Market size and forecast 2025-2030 ($ billion)
Data Table on The Netherlands - Market size and forecast 2025-2030 ($ billion)
Chart on The Netherlands - Year-over-year growth 2025-2030 (%)
Data Table on The Netherlands - Year-over-year growth 2025-2030 (%)

12.6 Middle East and Africa - Market size and forecast 2025-2030

Chart on Middle East and Africa - Market size and forecast 2025-2030 ($ billion)
Data Table on Middle East and Africa - Market size and forecast 2025-2030 ($ billion)
Chart on Middle East and Africa - Year-over-year growth 2025-2030 (%)
Data Table on Middle East and Africa - Year-over-year growth 2025-2030 (%)
Chart on Regional Comparison - Middle East and Africa
Data Table on Regional Comparison - Middle East and Africa

12.6.1 Saudi Arabia - Market size and forecast 2025-2030

Chart on Saudi Arabia - Market size and forecast 2025-2030 ($ billion)
Data Table on Saudi Arabia - Market size and forecast 2025-2030 ($ billion)
Chart on Saudi Arabia - Year-over-year growth 2025-2030 (%)
Data Table on Saudi Arabia - Year-over-year growth 2025-2030 (%)

12.6.2 UAE - Market size and forecast 2025-2030

Chart on UAE - Market size and forecast 2025-2030 ($ billion)
Data Table on UAE - Market size and forecast 2025-2030 ($ billion)
Chart on UAE - Year-over-year growth 2025-2030 (%)
Data Table on UAE - Year-over-year growth 2025-2030 (%)

12.6.3 South Africa - Market size and forecast 2025-2030

Chart on South Africa - Market size and forecast 2025-2030 ($ billion)
Data Table on South Africa - Market size and forecast 2025-2030 ($ billion)
Chart on South Africa - Year-over-year growth 2025-2030 (%)
Data Table on South Africa - Year-over-year growth 2025-2030 (%)

12.6.4 Israel - Market size and forecast 2025-2030

Chart on Israel - Market size and forecast 2025-2030 ($ billion)
Data Table on Israel - Market size and forecast 2025-2030 ($ billion)
Chart on Israel - Year-over-year growth 2025-2030 (%)
Data Table on Israel - Year-over-year growth 2025-2030 (%)

12.6.5 Turkey - Market size and forecast 2025-2030

Chart on Turkey - Market size and forecast 2025-2030 ($ billion)
Data Table on Turkey - Market size and forecast 2025-2030 ($ billion)
Chart on Turkey - Year-over-year growth 2025-2030 (%)
Data Table on Turkey - Year-over-year growth 2025-2030 (%)

12.7 South America - Market size and forecast 2025-2030

Chart on South America - Market size and forecast 2025-2030 ($ billion)
Data Table on South America - Market size and forecast 2025-2030 ($ billion)
Chart on South America - Year-over-year growth 2025-2030 (%)
Data Table on South America - Year-over-year growth 2025-2030 (%)
Chart on Regional Comparison - South America
Data Table on Regional Comparison - South America

12.7.1 Brazil - Market size and forecast 2025-2030

Chart on Brazil - Market size and forecast 2025-2030 ($ billion)
Data Table on Brazil - Market size and forecast 2025-2030 ($ billion)
Chart on Brazil - Year-over-year growth 2025-2030 (%)
Data Table on Brazil - Year-over-year growth 2025-2030 (%)

12.7.2 Argentina - Market size and forecast 2025-2030

Chart on Argentina - Market size and forecast 2025-2030 ($ billion)
Data Table on Argentina - Market size and forecast 2025-2030 ($ billion)
Chart on Argentina - Year-over-year growth 2025-2030 (%)
Data Table on Argentina - Year-over-year growth 2025-2030 (%)

12.7.3 Colombia - Market size and forecast 2025-2030

Chart on Colombia - Market size and forecast 2025-2030 ($ billion)
Data Table on Colombia - Market size and forecast 2025-2030 ($ billion)
Chart on Colombia - Year-over-year growth 2025-2030 (%)
Data Table on Colombia - Year-over-year growth 2025-2030 (%)

12.8 Market opportunity by geography

Market opportunity by geography ($ billion)
Data Tables on Market opportunity by geography ($ billion)

13. Drivers, Challenges, and Opportunity

13.1 Market drivers

Escalating consumer demand for clean label and natural ingredients
Proliferation and mainstreaming of plant based diets
Increased focus on health and wellness

13.2 Market challenges

Pervasive supply chain volatility and geopolitical instability
Intensifying regulatory scrutiny and divergent international standards
Heightened price volatility and sustained inflationary pressures

13.3 Impact of drivers and challenges

Impact of drivers and challenges in 2025 and 2030

13.4 Market opportunities

Ascendancy of sustainable and ethically sourced ingredients
Proliferation of alternative protein sources
Integration of functional ingredients

14. Competitive Landscape

14.1 Overview

14.2

Overview on criticality of inputs and factors of differentiation

14.3 Landscape disruption

Overview on factors of disruption

14.4 Industry risks

Impact of key risks on business

15. Competitive Analysis

15.1 Companies profiled

Companies covered

15.2 Company ranking index

15.3 Market positioning of companies

Matrix on companies position and classification

15.4 Archer Daniels Midland Co.

Archer Daniels Midland Co. - Overview
Archer Daniels Midland Co. - Business segments
Archer Daniels Midland Co. - Key news
Archer Daniels Midland Co. - Key offerings
Archer Daniels Midland Co. - Segment focus
SWOT

15.5 BASF SE

BASF SE - Overview
BASF SE - Business segments
BASF SE - Key news
BASF SE - Key offerings
BASF SE - Segment focus
SWOT

15.6 Bunge Global SA

Bunge Global SA - Overview
Bunge Global SA - Business segments
Bunge Global SA - Key news
Bunge Global SA - Key offerings
Bunge Global SA - Segment focus
SWOT

15.7 DSM Firmenich AG

DSM Firmenich AG - Overview
DSM Firmenich AG - Product / Service
DSM Firmenich AG - Key offerings
SWOT

15.8 Fonterra Cooperative Group Ltd.

Fonterra Cooperative Group Ltd. - Overview
Fonterra Cooperative Group Ltd. - Business segments
Fonterra Cooperative Group Ltd. - Key news
Fonterra Cooperative Group Ltd. - Key offerings
Fonterra Cooperative Group Ltd. - Segment focus
SWOT

15.9 Givaudan SA

Givaudan SA - Overview
Givaudan SA - Business segments
Givaudan SA - Key news
Givaudan SA - Key offerings
Givaudan SA - Segment focus
SWOT

15.10 Glanbia plc

Glanbia plc - Overview
Glanbia plc - Business segments
Glanbia plc - Key news
Glanbia plc - Key offerings
Glanbia plc - Segment focus
SWOT

15.11 Ingredion Inc.

Ingredion Inc. - Overview
Ingredion Inc. - Business segments
Ingredion Inc. - Key news
Ingredion Inc. - Key offerings
Ingredion Inc. - Segment focus
SWOT

15.12 International Flavors Inc.

International Flavors Inc. - Overview
International Flavors Inc. - Business segments
International Flavors Inc. - Key news
International Flavors Inc. - Key offerings
International Flavors Inc. - Segment focus
SWOT

15.13 Kerry Group Plc

Kerry Group Plc - Overview
Kerry Group Plc - Business segments
Kerry Group Plc - Key offerings
Kerry Group Plc - Segment focus
SWOT

15.14 Novonesis Group

Novonesis Group - Overview
Novonesis Group - Product / Service
Novonesis Group - Key offerings
SWOT

15.15 Roquette Freres SA

Roquette Freres SA - Overview
Roquette Freres SA - Product / Service
Roquette Freres SA - Key offerings
SWOT

15.16 Royal Friesland Campina NV

Royal Friesland Campina NV - Overview
Royal Friesland Campina NV - Product / Service
Royal Friesland Campina NV - Key offerings
SWOT

15.17 Symrise Group

Symrise Group - Overview
Symrise Group - Business segments
Symrise Group - Key news
Symrise Group - Key offerings
Symrise Group - Segment focus
SWOT

15.18 Tate and Lyle PLC

Tate and Lyle PLC - Overview
Tate and Lyle PLC - Business segments
Tate and Lyle PLC - Key news
Tate and Lyle PLC - Key offerings
Tate and Lyle PLC - Segment focus
SWOT

16. Appendix

16.1 Scope of the report

Market definition
Objectives
Notes and caveats

16.2 Inclusions and exclusions checklist

Inclusions checklist
Exclusions checklist

16.3 Currency conversion rates for US$

16.4 Research methodology

16.5 Data procurement

Information sources

16.6 Data validation

16.7 Validation techniques employed for market sizing

16.8 Data synthesis

16.9 360 degree market analysis

16.10 List of abbreviations

Research Methodology

Technavio presents a detailed picture of the market by way of study, synthesis, and summation of data from multiple sources. The analysts have presented the various facets of the market with a particular focus on identifying the key industry influencers. The data thus presented is comprehensive, reliable, and the result of extensive research, both primary and secondary.

INFORMATION SOURCES

Primary sources

  • Manufacturers and suppliers
  • Channel partners
  • Industry experts
  • Strategic decision makers

Secondary sources

  • Industry journals and periodicals
  • Government data
  • Financial reports of key industry players
  • Historical data
  • Press releases

DATA ANALYSIS

Data Synthesis

  • Collation of data
  • Estimation of key figures
  • Analysis of derived insights

Data Validation

  • Triangulation with data models
  • Reference against proprietary databases
  • Corroboration with industry experts

REPORT WRITING

Qualitative

  • Market drivers
  • Market challenges
  • Market trends
  • Five forces analysis

Quantitative

  • Market size and forecast
  • Market segmentation
  • Geographical insights
  • Competitive landscape

Interested in this report?

Get your sample now to see our research methodology and insights!

Download Now

Frequently Asked Questions

Bulk Food Ingredient market growth will increase by USD 100.9 billion during 2026-2030 .

The Bulk Food Ingredient market is expected to grow at a CAGR of 4.5% during 2026-2030 .

Bulk Food Ingredient market is segmented by Type (Grains and cereals, Herbs and spices, Sugar and salt, Dry fruits and nuts, Others) Application (Bakery and confectionery, Beverages, Snacks and spreads, Ready meals, Others) Distribution channel (Direct from manufacturers, Distributors)

Ajinomoto Co. Inc., Archer Daniels Midland Co., Barry Callebaut AG, BASF SE, Beneo GmbH, Bunge Global SA, CP Kelco US Inc., DSM Firmenich AG, Fonterra Cooperative Group Ltd., Givaudan SA, Glanbia plc, Ingredion Inc., International Flavors Inc., Kerry Group Plc, Novonesis Group, Roquette Freres SA, Royal Friesland Campina NV, Symrise Group, Tate and Lyle PLC, Wilmar International Ltd. are a few of the key vendors in the Bulk Food Ingredient market.

APAC will register the highest growth rate of 44.8% among the other regions. Therefore, the Bulk Food Ingredient market in APAC is expected to garner significant business opportunities for the vendors during the forecast period.

China, India, Japan, South Korea, Australia, Indonesia, US, Canada, Mexico, Germany, UK, France, Italy, Spain, The Netherlands, Saudi Arabia, UAE, South Africa, Israel, Turkey, Brazil, Argentina, Colombia

  • Escalating consumer demand for clean label and natural ingredients is the driving factor this market.

The Bulk Food Ingredient market vendors should focus on grabbing business opportunities from the Type segment as it accounted for the largest market share in the base year.