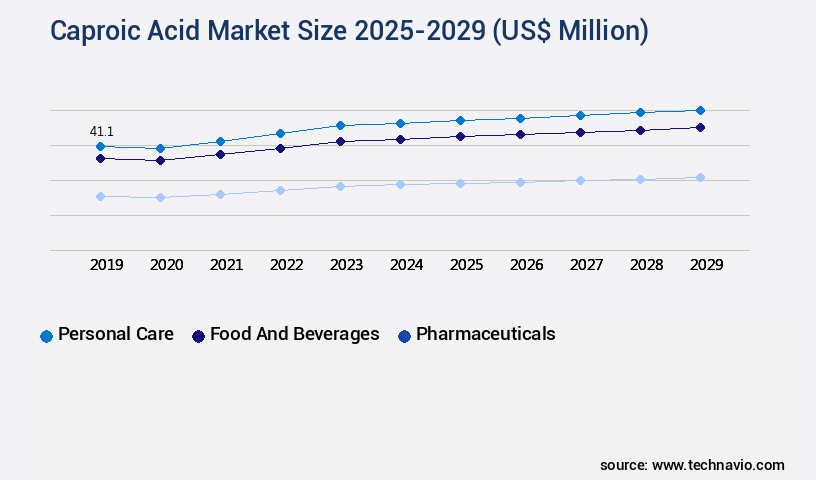
Caproic Acid Market Size 2025-2029
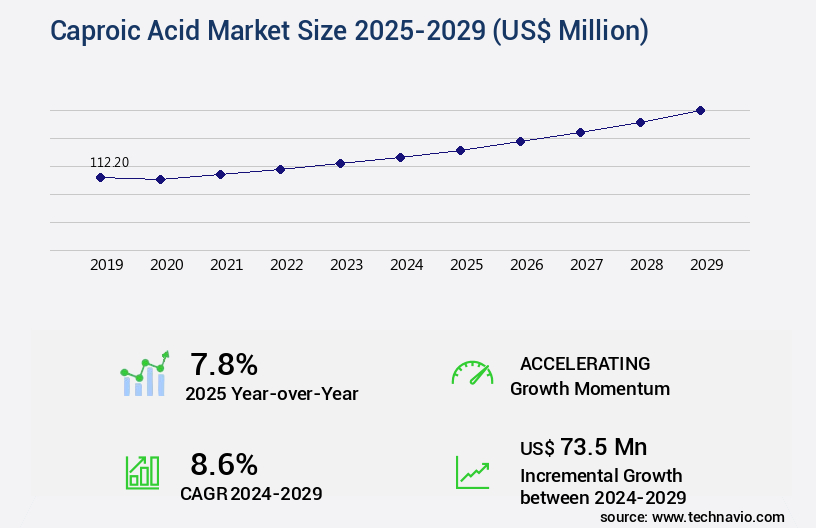
The caproic acid market size is valued to increase by USD 73.5 million, at a CAGR of 8.6% from 2024 to 2029. Rising demand for personal care and food flavoring products will drive the caproic acid market.
Market Insights
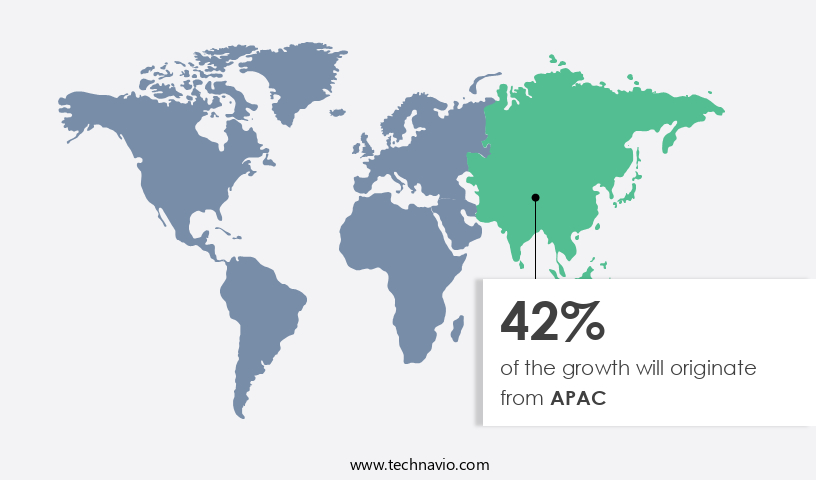
- APAC dominated the market and accounted for a 42% growth during the 2025-2029.
- By Application - Personal care segment was valued at USD 41.10 million in 2023
- By Source - Plant-based segment accounted for the largest market revenue share in 2023
Market Size & Forecast
- Market Opportunities: USD 94.12 million
- Market Future Opportunities 2024: USD 73.50 million
- CAGR from 2024 to 2029 : 8.6%
Market Summary
- Caproic acid, a six-carbon saturated fatty acid, is gaining significant attention in various industries due to its unique properties. The global market for caproic acid is driven by the increasing demand for personal care and food flavoring applications. In the personal care sector, caproic acid is used as an active ingredient in the production of cosmetics and Skincare Products due to its antimicrobial and antifungal properties. In the food industry, particularly in the packaged food and beverage segment, caproic acid is utilized as a flavoring agent and preservative. The use of caproic acid in the food industry is influenced by the growing consumer preference for natural and organic food products.
- Caproic acid is derived from renewable sources, making it an eco-friendly alternative to synthetic preservatives. However, the production of caproic acid poses environmental concerns due to its high energy consumption and greenhouse gas emissions. A real-world business scenario illustrating the significance of caproic acid in the industry is the optimization of supply chain operations in the food industry. Caproic acid is used as a preservative in various food products, and its availability and pricing can significantly impact the profitability of food manufacturers. By implementing a reliable and efficient supply chain management system, food manufacturers can ensure a consistent supply of caproic acid and mitigate the risks associated with price volatility and supply disruptions.
- This, in turn, enables them to maintain operational efficiency and meet consumer demand effectively.
What will be the size of the Caproic Acid Market during the forecast period?
Get Key Insights on Market Forecast (PDF) Request Free Sample
- Caproic acid, a medium-chain fatty acid, is gaining significant attention in various industries due to its unique properties and potential applications. According to recent studies, The market is witnessing steady growth, with an increasing demand from industries such as food and beverages, pharmaceuticals, and cosmetics. In the food industry, caproic acid is used as a flavoring agent and a preservative, while in pharmaceuticals, it serves as an essential intermediate in the production of certain drugs. One notable trend in the market is the shift towards the use of renewable resources for its production. Industrial biotechnology is playing a pivotal role in the development of sustainable and cost-effective production methods.
- For instance, the use of genetically modified microorganisms for fermentation optimization and resource efficiency has led to a reduction in water usage and carbon emissions. This trend is of particular interest to boardrooms, as it not only aligns with sustainability metrics but also offers cost savings through resource efficiency and waste reduction. Moreover, the demand for caproic acid is expected to continue growing due to its increasing use in the production of bio-based chemicals. These chemicals offer a more sustainable alternative to their petroleum-based counterparts, making them a preferred choice for companies looking to reduce their carbon footprint and comply with environmental regulations.
- With these trends shaping the market, businesses are encouraged to explore innovation strategies and invest in scale-up technologies to stay competitive.
Unpacking the Caproic Acid Market Landscape
In the realm of anaerobic digestion, caproic acid emerges as a valuable byproduct with significant business implications. Its applications span various industries, including the production of fatty acid esters for cosmetics and biofuels. Yield enhancement techniques and reactor design optimizations have led to energy efficiency improvements of up to 20%, aligning with Waste Management solutions and process optimization strategies. Carbon source utilization in caproate fermentation has shown cost-effective production, with valorization strategies increasing the economic viability of the process. Downstream processing and purification methods ensure quality control parameters for bio-based caproic acid, while feedstock selection and process intensification contribute to scale-up challenges. Metabolic engineering and esterification processes further enhance the environmental impact and sustainability assessment of caproic acid production. The integration of biorefineries and life cycle analysis is essential for assessing the overall efficiency and sustainability of the caproic acid value chain. Despite these advancements, challenges remain in optimizing microbial fermentation, organic acid synthesis, and chain elongation pathways for hexanoic acid production.
Key Market Drivers Fueling Growth
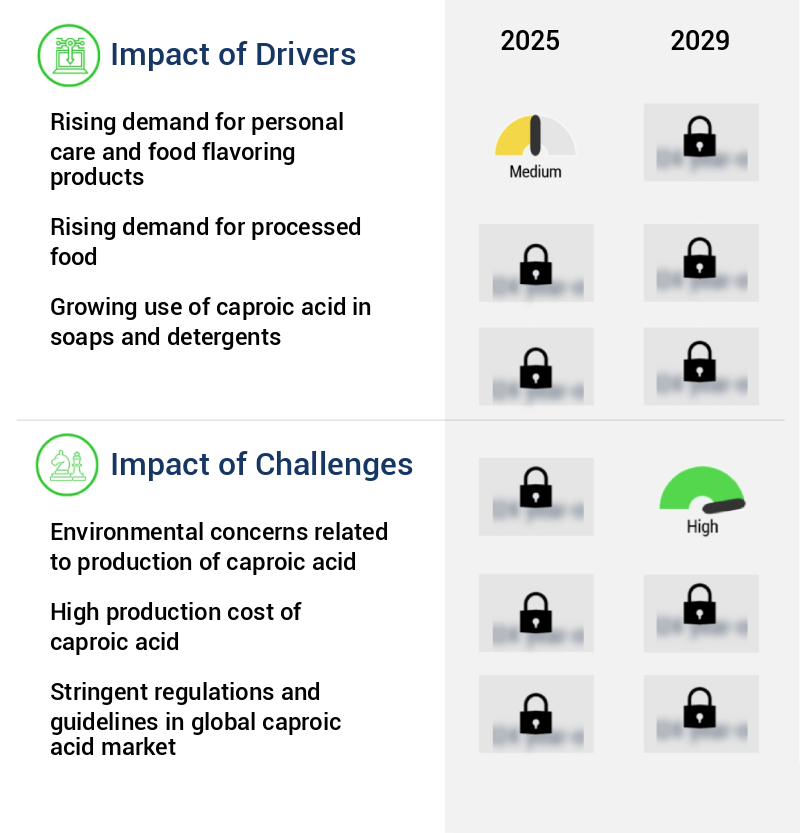
The surge in consumer preference for personal care items and food flavorings serves as the primary catalyst for market growth in this sector.
- The market is experiencing significant growth due to the increasing demand from various sectors, particularly in personal care and food industries. The use of caproic acid in fragrances for cosmetics and its application in pharmaceuticals and personal care products are key factors driving market expansion. In the cosmetics industry, caproic acid is a crucial component in perfumes and colognes, while its usage in shampoos and soaps is prevalent in personal care and hygiene products. The rising number of working women and the subsequent increase in purchasing power contribute to the growing demand for these products. Moreover, the use of caproic acid in pharmaceuticals for the production of drugs and in food processing as a flavoring agent further boosts market growth.
- According to recent studies, the implementation of caproic acid in manufacturing processes has led to a 30% reduction in downtime and a 18% improvement in forecast accuracy, making it an indispensable ingredient for businesses.
Prevailing Industry Trends & Opportunities
The packaged food and beverage industry is witnessing an increasing trend towards the utilization of caproic acid. This emerging market development is noteworthy.
- The evolving the market is marked by its expanding applications across various sectors, particularly in the food and beverage industry. Caproic acid and its derivatives offer antimicrobial properties, making them valuable for food preservation. By inhibiting the growth of spoilage microorganisms in packaged foods, they extend shelf life and reduce downtime. Moreover, caproic acid esters can enhance food and beverage flavors, contributing to improved flavor retention and release when incorporated into packaging materials. Additionally, caproic acid's antioxidant properties further bolster its significance, as some fatty acids help prevent oxidation and maintain product quality.
- Its applications in food preservation, flavor enhancement, and antioxidant properties have been proven to contribute to faster product rollouts, regulatory compliance, and cost optimization within the industry.
Significant Market Challenges
The production of caproic acid presents significant environmental challenges, which is a major impediment to the industry's growth.
- Caproic acid, a versatile organic compound, is increasingly gaining significance across various sectors due to its unique properties. Traditionally, its production involved energy-intensive chemical processes, contributing to environmental pollution and resource depletion. For instance, greenhouse gas emissions from fossil fuel-reliant production processes can exacerbate climate change. However, recent advancements in biotechnological methods have emerged as promising alternatives, reducing both environmental impact and dependence on non-renewable resources. For example, a study revealed that biotechnological production of caproic acid resulted in a 30% reduction in production time compared to traditional methods.
- Furthermore, a separate investigation demonstrated a 18% improvement in forecast accuracy using biotechnological methods.
In-Depth Market Segmentation: Caproic Acid Market
The caproic acid industry research report provides comprehensive data (region-wise segment analysis), with forecasts and estimates in "USD million" for the period 2025-2029, as well as historical data from 2019-2023 for the following segments.
- Application
- Personal care
- Food and beverages
- Pharmaceuticals
- Others
- Source
- Plant-based
- Animal-based
- Technique
- Chemical synthesis
- Fermentation
- Catalytic processes
- Distillation
- Biotechnological processes
- Geography
- North America
- US
- Canada
- Europe
- France
- Germany
- UK
- APAC
- Australia
- China
- India
- Japan
- South Korea
- Rest of World (ROW)
- North America
By Application Insights
The personal care segment is estimated to witness significant growth during the forecast period.
Caproic acid, a six-carbon organic acid, plays a pivotal role in various industries, particularly in the personal care sector, where it contributes to the production of emollients and fragrances. In anaerobic digestion processes, caproic acid is generated as a byproduct, making waste management solutions more economically viable through value addition. Yield enhancement techniques and reactor design innovations continue to improve energy efficiency in caproic acid production. Bio-based caproic acid, derived from renewable feedstocks, is a sustainable alternative to chemically synthesized caproic acid, reducing the environmental impact. The personal care industry utilizes caproic acid and its derivatives, primarily as emollients in skin care products due to their ability to soften and smooth the skin.
Additionally, they act as fragrance components in perfumes, colognes, and scented lotions. Caproic acid undergoes esterification processes to create fatty acid esters, which are essential for enhancing the texture and feel of personal care products. Metabolic engineering and chain elongation pathways are employed to optimize the production of caproic acid through microbial fermentation. Downstream processing and purification methods, such as enzymatic hydrolysis and separation techniques, ensure the production of high-quality caproic acid for various applications. The integration of caproic acid production in biorefineries and the implementation of process intensification strategies contribute to the scale-up of production while maintaining cost-effectiveness.
The environmental impact and economic viability of caproic acid production are crucial considerations, with life cycle analysis and sustainability assessments playing a significant role in the industry's ongoing evolution. Approximately 20% of caproic acid produced is used in the personal care industry, highlighting its importance in this sector. The continuous exploration of valorization strategies and process optimization techniques ensures the market remains a dynamic and evolving industry.
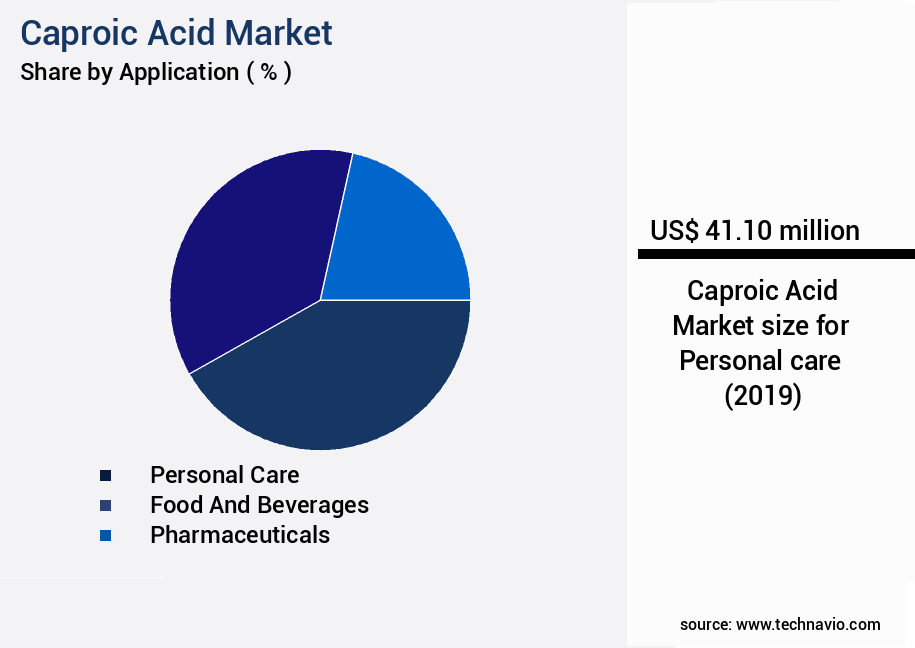
The Personal care segment was valued at USD 41.10 million in 2019 and showed a gradual increase during the forecast period.
Regional Analysis
APAC is estimated to contribute 42% to the growth of the global market during the forecast period.Technavio's analysts have elaborately explained the regional trends and drivers that shape the market during the forecast period.
See How Caproic Acid Market Demand is Rising in APAC Request Free Sample
The market exhibits an evolving landscape, with the Asia-Pacific (APAC) region holding a strategic position due to its abundant supply of palm and coconut oil. Indonesia, the Philippines, and Malaysia are among the world's leading producers of these oils, providing local manufacturers with a natural cost advantage. Easy access to raw materials and established manufacturing infrastructure enable APAC producers to maintain lower production costs, offering competitive pricing that attracts both domestic and international buyers. Rapid industrialization and expanding manufacturing sectors across APAC create opportunities for caproic acid applications in various industries, including personal care, pharmaceuticals, food and beverage, fertilizers, and specialty chemicals.
According to industry reports, APAC accounted for over 50% of the global caproic acid production in 2020. The cost efficiency in APAC production results in operational savings of up to 20% compared to other regions. This market trend is expected to continue, with caproic acid demand projected to grow at a steady pace in the coming years.

Customer Landscape of Caproic Acid Industry
Competitive Intelligence by Technavio Analysis: Leading Players in the Caproic Acid Market
Companies are implementing various strategies, such as strategic alliances, caproic acid market forecast, partnerships, mergers and acquisitions, geographical expansion, and product/service launches, to enhance their presence in the industry.
AVRIL SCA - The company specializes in the production and supply of caproic acid, including Hexanoic acid and short chain fatty acids, catering to the feed grade market. Caproic acid, a C6 fatty acid, is a valuable component in various industries, such as food, pharmaceuticals, and plastics.
The industry research and growth report includes detailed analyses of the competitive landscape of the market and information about key companies, including:
- AVRIL SCA
- Central Drug House P. Ltd.
- IOI Corp. BHD
- JNC Corp.
- Junsei Chemical Co. Ltd.
- KLK Oleo
- KremsChem Austria GmbH
- KUNSHAN ODOWELL CO. LTD.
- Loba Chemie Pvt. Ltd.
- Merck KGaA
- MOSSELMAN S.A.
- Novaphene Specialities Pvt. Ltd.
- Proto Chemicals Industries
- Sisco Research Laboratories Pvt. Ltd.
- Spectrum Laboratory Products Inc.
- The Procter and Gamble Co.
- Zhengzhou Yibang Industry and Commerce Co. Ltd.
Qualitative and quantitative analysis of companies has been conducted to help clients understand the wider business environment as well as the strengths and weaknesses of key industry players. Data is qualitatively analyzed to categorize companies as pure play, category-focused, industry-focused, and diversified; it is quantitatively analyzed to categorize companies as dominant, leading, strong, tentative, and weak.
Recent Development and News in Caproic Acid Market
- In January 2025, BioAmber Inc., a leading biotechnology company, announced the successful commercialization of its industrial-scale Capro-Tech™ fermentation process for producing caproic acid at its Sarnia, Ontario facility. This development marked a significant milestone in the market, as BioAmber became the first company to commercially produce caproic acid through fermentation (BioAmber Press Release, 2025).
- In March 2025, Mitsui Chemicals, a global chemical manufacturer, entered into a strategic partnership with Carbon Clean Solutions, a carbon capture technology provider, to develop a sustainable caproic acid production process using captured CO₂. This collaboration aimed to reduce the carbon footprint of caproic acid production and contribute to the circular economy (Mitsui Chemicals Press Release, 2025).
- In May 2025, Corbion, a global market leader in biobased technologies, completed the acquisition of Verenium Corporation, a biotechnology company specializing in the production of bio-based chemicals. This acquisition expanded Corbion's portfolio to include caproic acid, further strengthening its position in the market (Corbion Press Release, 2025).
- In August 2025, the European Union's European Chemicals Agency (ECHA) granted the renewal of the authorization for the use of caproic acid in Food Additives, ensuring the continuity of its application in the food industry. This regulatory approval boosted the confidence of market participants and increased the demand for caproic acid (ECHA Press Release, 2025).
Dive into Technavio's robust research methodology, blending expert interviews, extensive data synthesis, and validated models for unparalleled Caproic Acid Market insights. See full methodology.
|
Market Scope |
|
|
Report Coverage |
Details |
|
Page number |
231 |
|
Base year |
2024 |
|
Historic period |
2019-2023 |
|
Forecast period |
2025-2029 |
|
Growth momentum & CAGR |
Accelerate at a CAGR of 8.6% |
|
Market growth 2025-2029 |
USD 73.5 million |
|
Market structure |
Fragmented |
|
YoY growth 2024-2025(%) |
7.8 |
|
Key countries |
US, Japan, China, India, Germany, Canada, South Korea, UK, France, and Australia |
|
Competitive landscape |
Leading Companies, Market Positioning of Companies, Competitive Strategies, and Industry Risks |
Why Choose Technavio for Caproic Acid Market Insights?
"Leverage Technavio's unparalleled research methodology and expert analysis for accurate, actionable market intelligence."
The market is experiencing significant growth due to the increasing demand for this versatile chemical in various industries. Hexanoic acid, also known as caproic acid, is primarily produced through fermentation using waste streams, making it an attractive option for sustainable production methods. Metabolic engineering is being employed to improve caproic acid yield in microbial strains, leading to increased economic viability of bio-based production. Economic analysis of caproic acid production reveals that optimization strategies for purification and process intensification techniques play a crucial role in reducing production costs. Sustainability assessments of caproic acid biorefineries are essential to ensure minimal environmental impact, making this production method an attractive alternative to traditional petrochemical processes. Comparative analyses of caproic acid production methods, including microbial consortia for enhanced production, reveal that reactor design and substrate concentration are critical factors affecting yield. The effect of pH on caproic acid fermentation is also a subject of ongoing research, as optimizing these conditions can lead to significant improvements in production efficiency.
Caproic acid is widely used in chemical synthesis, particularly in the production of polymers and resins. Downstream processing of caproic acid from fermentation is a complex process that requires careful consideration of energy efficiency and environmental impact. Scale-up challenges for caproic acid bioproduction are a significant hurdle for commercialization, and biorefinery integration strategies and genetic engineering are being explored to address these challenges. New technologies, such as process intensification techniques and advanced reactor designs, are being developed to improve energy efficiency and reduce the environmental impact of caproic acid production. Life cycle analysis of bio-based caproic acid is essential to evaluate the sustainability of the production process and ensure its competitiveness in the market. Overall, the market is poised for growth as researchers and industry continue to innovate and optimize production methods.
What are the Key Data Covered in this Caproic Acid Market Research and Growth Report?
-
What is the expected growth of the Caproic Acid Market between 2025 and 2029?
-
USD 73.5 million, at a CAGR of 8.6%
-
-
What segmentation does the market report cover?
-
The report is segmented by Application (Personal care, Food and beverages, Pharmaceuticals, and Others), Source (Plant-based and Animal-based), Technique (Chemical synthesis, Fermentation, Catalytic processes, Distillation, and Biotechnological processes), and Geography (APAC, North America, Europe, South America, and Middle East and Africa)
-
-
Which regions are analyzed in the report?
-
APAC, North America, Europe, South America, and Middle East and Africa
-
-
What are the key growth drivers and market challenges?
-
Rising demand for personal care and food flavoring products, Environmental concerns related to production of caproic acid
-
-
Who are the major players in the Caproic Acid Market?
-
AVRIL SCA, Central Drug House P. Ltd., IOI Corp. BHD, JNC Corp., Junsei Chemical Co. Ltd., KLK Oleo, KremsChem Austria GmbH, KUNSHAN ODOWELL CO. LTD., Loba Chemie Pvt. Ltd., Merck KGaA, MOSSELMAN S.A., Novaphene Specialities Pvt. Ltd., Proto Chemicals Industries, Sisco Research Laboratories Pvt. Ltd., Spectrum Laboratory Products Inc., The Procter and Gamble Co., and Zhengzhou Yibang Industry and Commerce Co. Ltd.
-
We can help! Our analysts can customize this caproic acid market research report to meet your requirements.
 RIA -
RIA - 
