
Car Sharing Market Size 2025-2029
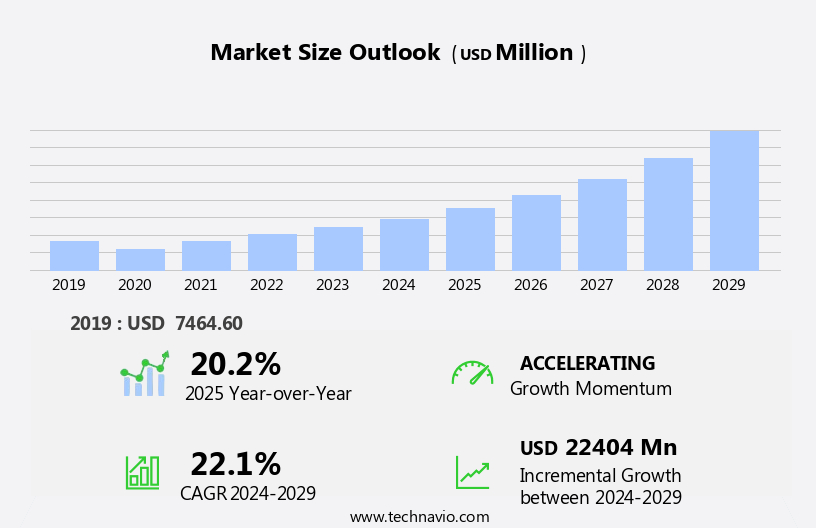
The car sharing market size is forecast to increase by USD 22.4 billion, at a CAGR of 22.1% between 2024 and 2029.
- The market is experiencing significant growth, driven by increasing investments in autonomous car production and the subsequent integration of car sharing services. This trend is transforming the automotive industry, as companies explore new business models that leverage advanced technologies to offer more convenient and cost-effective mobility solutions. However, the market's expansion is not without challenges. Strict government regulations regarding emission control pose a significant obstacle, as policymakers seek to mitigate the environmental impact of these services. Additionally, rigid government regulations pertaining to car sharing services themselves create complex operational environments, necessitating compliance with various safety, insurance, and licensing requirements.
- Companies navigating this market must carefully balance innovation and regulatory compliance to capitalize on the opportunities presented by the evolving car sharing landscape.
What will be the Size of the Car Sharing Market during the forecast period?
Explore in-depth regional segment analysis with market size data - historical 2019-2023 and forecasts 2025-2029 - in the full report.
Request Free Sample
The market continues to evolve, with customer experience management playing a pivotal role in shaping the industry's trajectory. Public-private partnerships foster innovation, enabling the integration of dynamic pricing mechanisms that optimize fuel efficiency and promote green technology adoption. Multi-modal transportation networks and urban mobility solutions are seamlessly merging, with real-time vehicle tracking and on-demand transportation services streamlining urban transportation planning. Public transportation integration and parking management systems are key components of smart city initiatives, reducing carbon footprints and mitigating traffic congestion. Vehicle fleet management and inventory management are essential for optimizing vehicle utilization and ensuring regulatory compliance.
Dynamic pricing mechanisms and user interface design are crucial in catering to diverse customer segments, with ride-hailing platforms and bike-sharing programs offering micro-mobility options. Peer-to-peer car sharing and ride-sharing partnerships are transforming the industry, with electric vehicle integration and subscription models gaining popularity. The ongoing integration of green technology, sustainability initiatives, and autonomous vehicles is revolutionizing the car sharing landscape. Vehicle telematics and mobile app development are enhancing the customer experience, while community engagement and traffic congestion mitigation are essential for long-term success. The evolving market dynamics of car sharing encompass various sectors, including intercity travel solutions, last-mile delivery services, and mobility-as-a-service (MAAS).
Demand forecasting and environmental impact assessment are crucial in ensuring the sustainability and growth of these services. Spare parts management and payment gateway integration are vital components of vehicle maintenance schedules and ride-hailing platforms. In conclusion, the market is an ever-changing landscape, with continuous innovation and integration of various components shaping its future. From customer experience management to green technology adoption, the industry's dynamism is evident in its ongoing evolution.
How is this Car Sharing Industry segmented?
The car sharing industry research report provides comprehensive data (region-wise segment analysis), with forecasts and estimates in "USD million" for the period 2025-2029, as well as historical data from 2019-2023 for the following segments.
- End-user
- Business
- Individual
- Mode Of Booking
- Online
- Offline
- Geography
- North America
- US
- Canada
- Europe
- France
- Germany
- Italy
- UK
- APAC
- China
- India
- Japan
- South Korea
- Rest of World (ROW)
- North America
By End-user Insights
The business segment is estimated to witness significant growth during the forecast period.
The market is experiencing significant growth in the business segment due to various factors. One key driver is the adoption of this service for fleet optimization and cost reduction. By implementing car sharing, companies can save on fleet-related expenses and make efficient use of underutilized vehicles. Additionally, car sharing offers a sustainable mobility solution, enhancing corporate social responsibility. This not only decreases the need for car renting but also saves time and resources through advanced vehicle management. Furthermore, the integration of public transportation, real-time tracking, and multi-modal transportation networks enables seamless urban mobility.
The implementation of green technology, electric vehicles, and micro-mobility options also contributes to the reduction of carbon footprints. Public-private partnerships and regulatory compliance further bolster the market's growth. As the market evolves, we can expect the integration of autonomous vehicles, shared mobility services, and payment gateways to create a more efficient and connected transportation ecosystem.
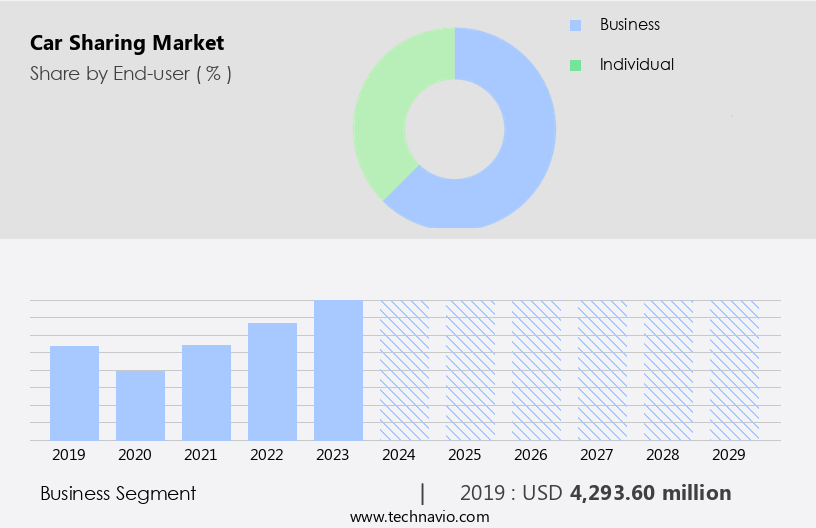
The Business segment was valued at USD 4.29 billion in 2019 and showed a gradual increase during the forecast period.
Regional Analysis
North America is estimated to contribute 31% to the growth of the global market during the forecast period.Technavio’s analysts have elaborately explained the regional trends and drivers that shape the market during the forecast period.
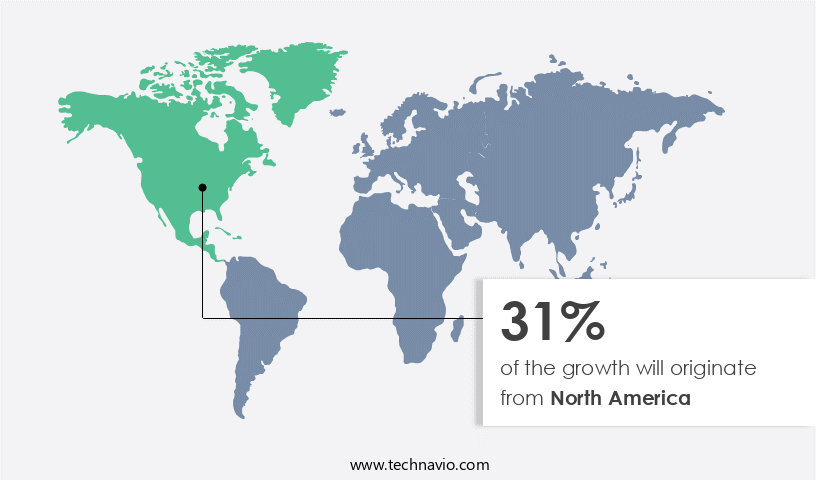
The North American the market is experiencing significant growth due to the investment of international Original Equipment Manufacturers (OEMs) in the region's car sharing platforms. Strict government regulations, such as the US motor vehicle emission control program, are also driving market expansion. These regulations aim to reduce vehicular emissions by promoting car sharing services, which decrease vehicle ownership and consequently, the number of cars on the road. The market encompasses various entities, including customer experience management, public-private partnerships, dynamic pricing mechanisms, fuel efficiency optimization, multi-modal transportation networks, urban mobility solutions, public transportation integration, parking management systems, real-time vehicle tracking, on-demand transportation services, green technology adoption, carbon footprint reduction, smart city integration, vehicle fleet management, intercity travel solutions, bike-sharing programs, user interface design, vehicle telematics, community engagement, traffic congestion mitigation, inventory management, vehicle utilization optimization, last-mile delivery services, ride-hailing platforms, customer segmentation, vehicle maintenance schedules, mobile app development, urban transportation planning, mobility-as-a-service (MaaS), electric vehicle integration, subscription models, regulatory compliance, demand forecasting, environmental impact assessment, spare parts management, micro-mobility options, e-scooter integration, ride-sharing partnerships, shared mobility services, payment gateway integration, peer-to-peer car sharing, autonomous vehicle integration, and sustainability initiatives.
These entities are shaping the market by offering innovative solutions to address the evolving transportation needs of consumers and cities.
Market Dynamics
Our researchers analyzed the data with 2024 as the base year, along with the key drivers, trends, and challenges. A holistic analysis of drivers will help companies refine their marketing strategies to gain a competitive advantage.
What are the key market drivers leading to the rise in the adoption of Car Sharing Industry?
- Strict government regulations mandating emission control are the primary driver for market growth in this industry.
- The markets are experiencing significant growth due to the integration of various mobility solutions and sustainability initiatives. Environmental impact assessments are becoming crucial for car sharing companies to reduce their carbon footprint. Strict vehicle emission norms, such as Euro standards and Corporate Average Fuel Economy (CAFE) standards, are driving the market towards advanced engine technologies and fuel filtration systems. Spare parts management and e-scooter integration are other key trends in the car sharing industry. Micro-mobility options, including e-scooters, are complementing car sharing services, offering consumers flexible and cost-effective transportation solutions. Ride-sharing partnerships and payment gateway integrations are streamlining the user experience and increasing the convenience of car sharing services.
- Peer-to-peer car sharing and autonomous vehicle integration are also gaining traction in the market. These innovations are enhancing the user experience and reducing operational costs for car sharing companies. Sustainability initiatives, such as electric vehicle fleets and carbon offset programs, are further boosting the market's growth and appeal to environmentally-conscious consumers. In conclusion, the market is witnessing dynamic changes, driven by stringent emission norms, advanced technologies, and consumer preferences for sustainable transportation solutions. These trends are shaping the future of the car sharing industry and offering new opportunities for growth and innovation.
What are the market trends shaping the Car Sharing Industry?
- The market trend mandates an increase in investments for the production of autonomous cars. This trend reflects the growing demand for advanced technology in the automotive industry.
- The market is witnessing significant growth due to the integration of advanced technologies such as customer experience management, public-private partnerships, dynamic pricing mechanisms, fuel efficiency optimization, multi-modal transportation networks, and public transportation integration. Real-time vehicle tracking, on-demand transportation services, parking management systems, and green technology adoption are also driving the market. Self-driving vehicles, a key trend in the market, rely on a network of sensors and electronic systems, including forward-view cameras, backup aids, autonomous brake systems, IMUs, and radar sensors. Radar sensors, which are essential for autonomous navigation, determine object velocity, range, and angles. These electronic systems are controlled using sensors and are becoming increasingly sophisticated to enhance urban mobility solutions.
- The adoption of green technology, such as electric and hybrid vehicles, is also contributing to the market's growth. The implementation of these technologies is expected to provide a harmonious and immersive customer experience, making car sharing a preferred choice for many consumers.
What challenges does the Car Sharing Industry face during its growth?
- The car sharing industry faces significant growth restrictions due to stringent government regulations governing its operations.
- The market faces substantial regulatory hurdles, necessitating car sharing companies to navigate a complex regulatory landscape that varies significantly between countries and cities. These regulations can restrict the number of cars permitted for car sharing in certain urban areas, potentially limiting accessibility and impeding business expansion. Moreover, some cities may require specific permits or licenses, creating a time-consuming and costly process for companies. Carbon footprint reduction and smart city integration are key drivers in the market. Vehicle fleet management, inventory management, and vehicle utilization optimization are essential components of car sharing services. The integration of bike-sharing programs and user interface design enhances the overall user experience.
- Vehicle telematics plays a crucial role in traffic congestion mitigation and community engagement. In the realm of intercity travel solutions, car sharing offers a sustainable and cost-effective alternative to traditional modes of transportation. The implementation of advanced technologies, such as vehicle telematics and user interface design, contributes to a more immersive and harmonious user experience. Effective inventory management and vehicle utilization optimization are essential for maintaining a profitable business model. In conclusion, the market presents both opportunities and challenges. While regulatory complexities can hinder growth, the potential for carbon footprint reduction, smart city integration, and user-centric solutions make it an attractive proposition for businesses and consumers alike.
- By focusing on vehicle fleet management, inventory management, and user experience, car sharing companies can navigate the regulatory landscape and capitalize on the market's growth potential. Recent research suggests that the market is poised for continued expansion, driven by the increasing demand for sustainable transportation solutions and the integration of advanced technologies.
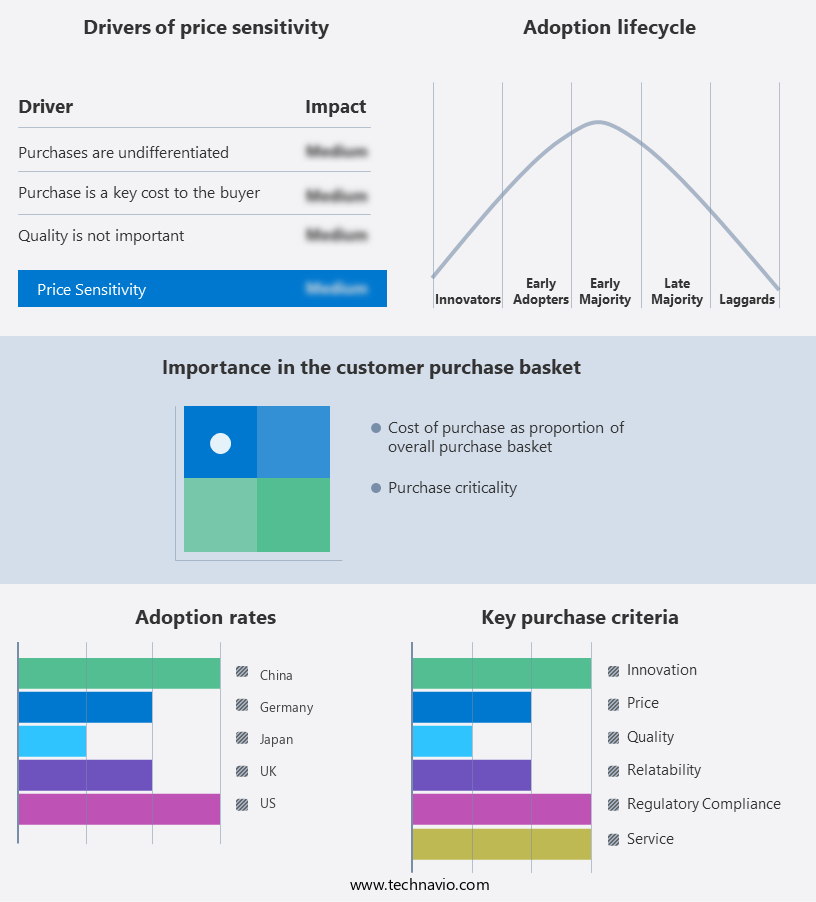
Exclusive Customer Landscape
The car sharing market forecasting report includes the adoption lifecycle of the market, covering from the innovator’s stage to the laggard’s stage. It focuses on adoption rates in different regions based on penetration. Furthermore, the car sharing market report also includes key purchase criteria and drivers of price sensitivity to help companies evaluate and develop their market growth analysis strategies.
Customer Landscape
Key Companies & Market Insights
Companies are implementing various strategies, such as strategic alliances, car sharing market forecast, partnerships, mergers and acquisitions, geographical expansion, and product/service launches, to enhance their presence in the industry.
Avis Budget Group Inc. - Avis Budget Group Inc. Offers car sharing services, including Zipcar, granting members flexible access to vehicles for hourly or daily usage in numerous cities and campuses. Members can conveniently reserve and utilize vehicles as needed, streamlining transportation solutions. This innovative approach to mobility enhances accessibility and efficiency, aligning with the company's commitment to delivering exceptional customer experiences.
The industry research and growth report includes detailed analyses of the competitive landscape of the market and information about key companies, including:
- Avis Budget Group Inc.
- cambio Mobilitatsservice GmbH and Co. KG
- Carrot
- Cityhop
- Communauto Group
- DiDi Global Inc.
- ekar Car Rental LLC
- Enterprise Holdings Inc.
- Getaround Inc.
- GoGet
- Hertz Global Holdings Inc.
- HOURCAR
- Lyft Inc.
- Mobility Cooperative
- Modo Co-operative
- Orix Corp.
- Peg City Car Co-op
- Regina Car Share Co-operative
- Stellantis NV
- Turo Inc.
Qualitative and quantitative analysis of companies has been conducted to help clients understand the wider business environment as well as the strengths and weaknesses of key industry players. Data is qualitatively analyzed to categorize companies as pure play, category-focused, industry-focused, and diversified; it is quantitatively analyzed to categorize companies as dominant, leading, strong, tentative, and weak.
Recent Development and News in Car Sharing Market
- In February 2024, Zipcar, a leading car-sharing service, announced a strategic partnership with Hertz, the car rental giant, to expand its reach and offerings. This collaboration aimed to provide members with access to Hertz's extensive vehicle fleet and airport locations, enhancing the overall user experience (Zipcar Press Release).
- In May 2024, Getaround, another major car-sharing player, secured a USD300 million funding round led by SoftBank's Vision Fund 2. This investment will support Getaround's growth initiatives, including the expansion of its peer-to-peer car-sharing platform to new markets and the development of innovative technologies (Getaround Press Release).
- In August 2024, Tencent, the Chinese tech conglomerate, acquired a significant stake in Didi Chuxing, the Chinese ride-hailing and car-sharing giant. This investment marked a strategic move by Tencent to strengthen its presence in the Chinese transportation market and capitalize on Didi's extensive user base (Reuters).
- In November 2025, the European Union passed new regulations to standardize car-sharing services across member states. These rules aim to simplify cross-border car-sharing and create a more level playing field for companies operating in multiple countries (European Commission Press Release).
Research Analyst Overview
- In the evolving the market, mobility-as-a-platform (MAAP) is revolutionizing transportation by integrating various technologies to offer seamless mobility solutions. RFID technology facilitates contactless vehicle access, while big data analytics and machine learning (ML) optimize traffic flow management and public transit usage. Customer loyalty programs, fueled by digital mapping platforms and automated payment processing, enhance user experience. Blockchain technology ensures secure transactions, and route optimization algorithms reduce emissions in line with sustainability targets. Sensor technology, geolocation services, and cloud computing enable real-time data processing for multi-modal transportation planning.
- AI and GPS tracking systems offer personalized services and risk management strategies, while cybersecurity measures protect user data. Connected vehicle technology and smart infrastructure development further advance the market, paving the way for autonomous driving systems.
Dive into Technavio’s robust research methodology, blending expert interviews, extensive data synthesis, and validated models for unparalleled Car Sharing Market insights. See full methodology.
|
Market Scope |
|
|
Report Coverage |
Details |
|
Page number |
191 |
|
Base year |
2024 |
|
Historic period |
2019-2023 |
|
Forecast period |
2025-2029 |
|
Growth momentum & CAGR |
Accelerate at a CAGR of 22.1% |
|
Market growth 2025-2029 |
USD 22404 million |
|
Market structure |
Fragmented |
|
YoY growth 2024-2025(%) |
20.2 |
|
Key countries |
US, Canada, China, UK, Japan, Germany, India, France, South Korea, and Italy |
|
Competitive landscape |
Leading Companies, Market Positioning of Companies, Competitive Strategies, and Industry Risks |
What are the Key Data Covered in this Car Sharing Market Research and Growth Report?
- CAGR of the Car Sharing industry during the forecast period
- Detailed information on factors that will drive the growth and forecasting between 2025 and 2029
- Precise estimation of the size of the market and its contribution of the industry in focus to the parent market
- Accurate predictions about upcoming growth and trends and changes in consumer behaviour
- Growth of the market across North America, Europe, APAC, Middle East and Africa, and South America
- Thorough analysis of the market’s competitive landscape and detailed information about companies
- Comprehensive analysis of factors that will challenge the car sharing market growth of industry companies
We can help! Our analysts can customize this car sharing market research report to meet your requirements.
 RIA -
RIA - 
