Carbon Credit Trading Platform Market Analysis Europe, APAC, North America, South America, Middle East and Africa - Germany, UK, Italy, China, US - Size and Forecast 2024-2028

Carbon Credit Trading Platform Market Analysis Europe, APAC, North America, South America, Middle East and Africa - Germany, UK, Italy, China, US - Size and Forecast 2024-2028

Published: Aug 2024 150 Pages SKU: IRTNTR76052

Market Overview at a Glance

$313.8 Mn
Market Opportunity
27.77%
CAGR
22.76
YoY growth 2023-2024(%)

Carbon Credit Trading Platform Market Size 2024-2028 

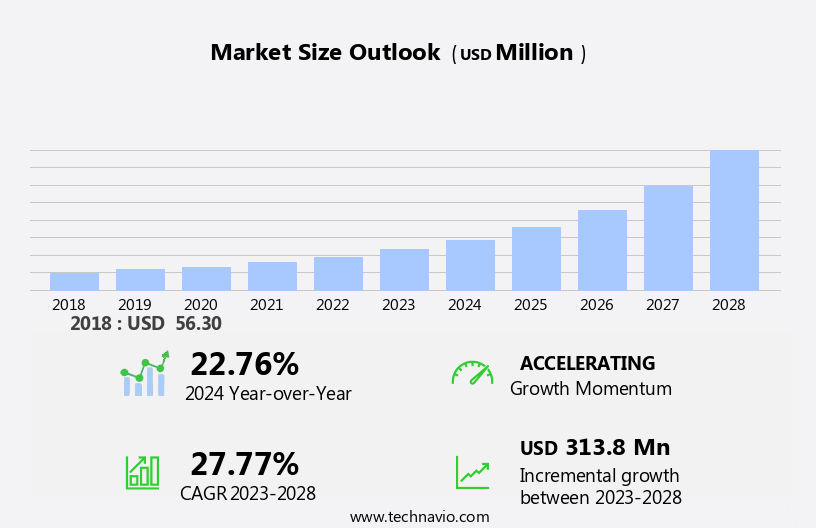
The carbon credit trading platform market size is forecast to increase by USD 313.8 billion at a CAGR of 27.77% between 2023 and 2028. The carbon credit trading market is experiencing significant growth due to increasing international sustainability initiatives and stricter environmental rules. As enterprises strive to reduce their carbon footprints and comply with emission regulations, the demand for emission reduction projects and carbon credits is on the rise. Market stability is a key trend, as more businesses recognize the long-term benefits of carbon credit trading. However, a lack of awareness and understanding of the process hinders widespread adoption. Greenhouse gas emissions continue to be a major concern for governments and organizations alike, making the carbon credit trading platform an essential tool for achieving emission reduction targets.

Carbon Credit Trading Platform Market Size

 Request Free Sample

The global focus on climate change and the adoption of renewable energy sources have led enterprises to prioritize emission reduction targets and environmental responsibility. Carbon credits have emerged as a financial tool to facilitate these efforts, enabling businesses to offset their carbon footprints by investing in emission reduction projects. Carbon capture technologies are gaining traction as essential components of the global transition towards a low-carbon economy. The increasing awareness of the environmental impact of greenhouse gas emissions has driven enterprises to seek sustainable practices and adhere to international sustainability initiatives.

Moreover, net zero goals have become a corporate mindset, with many organizations committing to reducing their carbon emissions in line with environmental regulations. Carbon credits provide a means for businesses to achieve these targets by investing in projects that reduce or remove greenhouse gas emissions from the atmosphere. The market is witnessing significant growth as more enterprises recognize the importance of carbon footprint reduction in their business strategies. Carbon credits offer a flexible and cost-effective solution for organizations to meet their emission reduction targets while supporting sustainable projects. The economic transition towards a low-carbon economy necessitates the adoption of carbon credits as a financial instrument.

Further, renewable energy sources, such as wind and solar power, are increasingly becoming the preferred choice for power generation, reducing the demand for fossil fuels and, consequently, carbon emissions. Carbon credits serve as a crucial financial mechanism in the context of environmental regulations. As governments worldwide implement stricter emission norms, businesses are turning to carbon credits to offset their carbon footprints and ensure compliance with these rules. Sustainability is a key concern for businesses, and carbon credits offer a tangible way to demonstrate environmental responsibility. By investing in emission reduction projects, organizations can reduce their carbon footprints and contribute to global efforts to mitigate climate change.

In conclusion, the market is expected to continue its growth trajectory, driven by the increasing demand for carbon credits from enterprises. The market's expansion is further fueled by the growing awareness of the importance of cybersecurity in the context of carbon credit trading platforms. In conclusion, the market plays a vital role in facilitating the transition towards a low-carbon economy by enabling enterprises to offset their carbon footprints and invest in emission reduction projects. As the global focus on climate change and sustainability intensifies, the demand for carbon credits and carbon credit trading platforms is expected to continue growing.

Market Segmentation

The market research report provides comprehensive data (region-wise segment analysis), with forecasts and estimates in "USD million" for the period 2024-2028, as well as historical data from 2018-2022 for the following segments.

  • Type
    • Voluntary carbon market
    • Regulated carbon market
  • Service Type
    • Cap and trade
    • Baseline and credit
  • Geography
    • Europe
      • Germany
      • UK
      • Italy
    • APAC
      • China
    • North America
      • US
    • South America
    • Middle East and Africa

By Type Insights

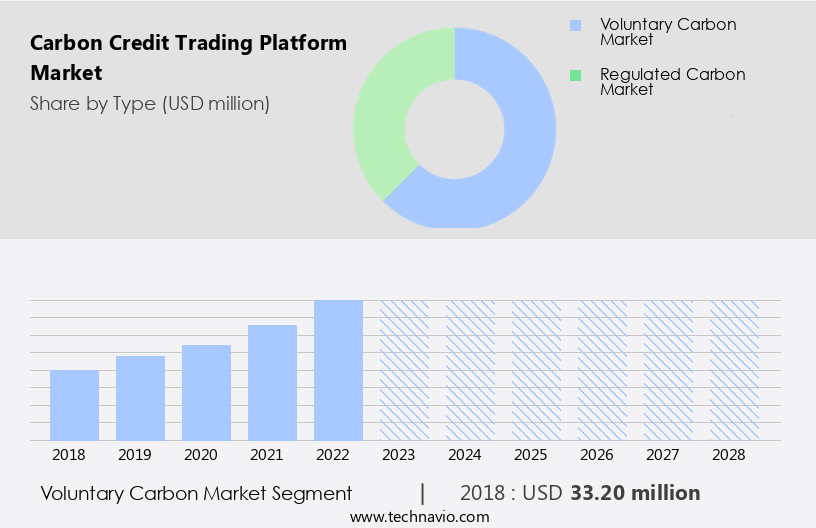
The voluntary carbon market segment is estimated to witness significant growth during the forecast period. In The market, the voluntary segment held the largest share in 2022. This segment's popularity is on the rise as businesses increasingly commit to net zero goals and renewable energy adoption in response to climate change concerns. Voluntary carbon credits enable companies to offset their carbon emissions by investing in projects that reduce or remove greenhouse gas (GHG) emissions. These initiatives not only contribute to the fight against climate change but also bring about additional benefits, such as pollution reduction, improved public health, job creation, and biodiversity preservation. By purchasing carbon credits, businesses demonstrate their commitment to environmental sustainability and support innovative climate change solutions that might not otherwise receive funding.

Carbon Credit Trading Platform Market Size

Get a glance at the market share of various segments Request Free Sample

The voluntary carbon market segment was valued at USD 33.20 million in 2018 and showed a gradual increase during the forecast period.

Regional Insights

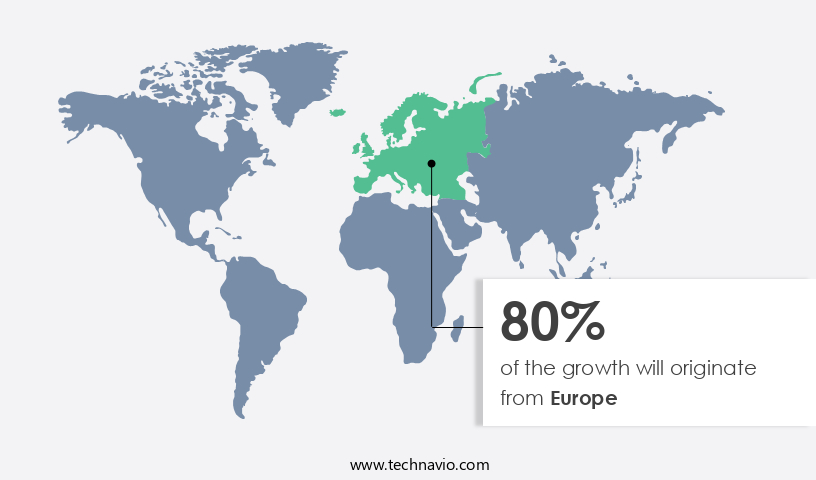
Europe is estimated to contribute 80% to the growth of the global market during the forecast period. Technavio's analysts have elaborately explained the regional trends and drivers that shape the market during the forecast period.

Carbon Credit Trading Platform Market Share by Geography

For more insights on the market share of various regions Request Free Sample

Carbon credit trading platforms have gained significant attention from sustainability-focused investors in Europe due to the region's strong commitment to renewable energy projects and stringent regulations. The European Union (EU) has implemented policies to reduce emissions and improve air quality, making it a major contributor to the global carbon credit market. The European Environment Agency (EEA) plays a crucial role in evaluating and developing strategies to enhance air quality in the EU. Countries like the UK, Germany, and France are projected to have high pollution levels during the forecast period due to urbanization. Blockchain technology, smart contracts, artificial intelligence (AI), and advanced analytics are transforming the carbon credit trading landscape.

Further, these technologies streamline transactions, ensure transparency, and enhance the efficiency of the market. The voluntary carbon market and regulated carbon market, including cap and trade systems, are utilizing these technologies to meet their sustainability goals. The market is expected to grow steadfastly, with Europe remaining a key player. Blockchain technology, smart contracts, and AI are revolutionizing the market by providing transparency, security, and efficiency. The UK, Germany, and France, with their significant pollution levels, are expected to contribute significantly to the market's growth. According to market research, The market is expected to expand at a steady pace, with Europe leading the charge.

Our researchers analyzed the data with 2023 as the base year, along with the key drivers, trends, and challenges. A holistic analysis of drivers will help companies refine their marketing strategies to gain a competitive advantage.

Market Driver

The increasing adoption of policies on carbon emissions is the key driver of the market. In the global business landscape, the regulatory landscape regarding carbon emissions is evolving, leading to a significant increase in the demand for carbon credit trading platforms. For instance, in the US, the Clean Air Act's Section 111 empowers the Environmental Protection Agency (EPA) to regulate greenhouse gas emissions from power plants.

Further, this regulation allows the EPA to set standards for carbon emissions from power plants. Similar regulations are in place in Europe and several Chinese cities and provinces through the cap-and-trade policy, also known as emissions trading. Under this policy, organizations or companies responsible for greenhouse gas emissions must acquire allowances for each ton they emit during a designated period. The energy, industrials, petrochemical, and aviation sectors are significant contributors to carbon emissions and are, therefore, key players in the carbon credit trading market. 

Market Trends

The growing adoption of carbon credit trading platform across various industries is the upcoming trend in the market. Carbon credit trading platforms have gained increasing popularity among various industries in the US, as organizations recognize the importance of addressing their carbon emissions and contributing to renewable energy solutions. Previously, large corporations in sectors like energy, manufacturing, and transportation predominantly utilized these platforms. However, the scope has broadened to include retail, real estate, construction, and IT services, among others. The growing concern for environmental sustainability and the need to reduce carbon footprints have driven this expansion. By implementing carbon credit trading platforms, companies can accurately measure their CO2 emissions, establish reduction targets, and track their progress towards sustainability goals.

Similarly, regulatory bodies and governments worldwide are imposing stricter environmental regulations and reporting requirements to ensure environmental improvements or prevent damage. As a result, organizations are increasingly turning to carbon credit trading to remain compliant and demonstrate their commitment to reducing their carbon impact. Carbon credits, derived from CO2 offsets, serve as a crucial component of these platforms, allowing organizations to trade and exchange these credits to offset their own emissions. This market, which facilitates the buying and selling of these credits, is expected to grow significantly due to the increasing demand for carbon neutrality and sustainability. In summary, carbon credit trading platforms have become an essential tool for businesses in the US and beyond, enabling them to accurately assess their carbon emissions, set reduction targets, and contribute to renewable energy initiatives while staying compliant with regulatory requirements.

Market Challenge

The lack of awareness in adopting low-carbon emission infrastructure is a key challenge affecting the market growth. The global market for carbon credit trading platforms is witnessing significant growth due to the increasing focus on reducing greenhouse gas emissions and the implementation of international sustainability initiatives. Enterprises are recognizing the importance of measuring and reducing their carbon footprints to comply with environmental rules and regulations. Carbon credit trading platforms facilitate the buying and selling of emission reduction projects, providing market stability and incentivizing emission reductions.

However, a lack of awareness and understanding among businesses about the benefits and processes of carbon credit trading may hinder market growth. The rapid proliferation of electronic devices, while driving technological advancements, also poses a challenge due to the resulting e-waste and its contribution to pollution. It is crucial for manufacturers to provide clear guidelines on product disposal to mitigate these issues.

Exclusive Customer Landscape

The market forecasting report includes the adoption lifecycle of the market, covering from the innovator's stage to the laggard's stage. It focuses on adoption rates in different regions based on penetration. Furthermore, the report also includes key purchase criteria and drivers of price sensitivity to help companies evaluate and develop their market growth analysis strategies.
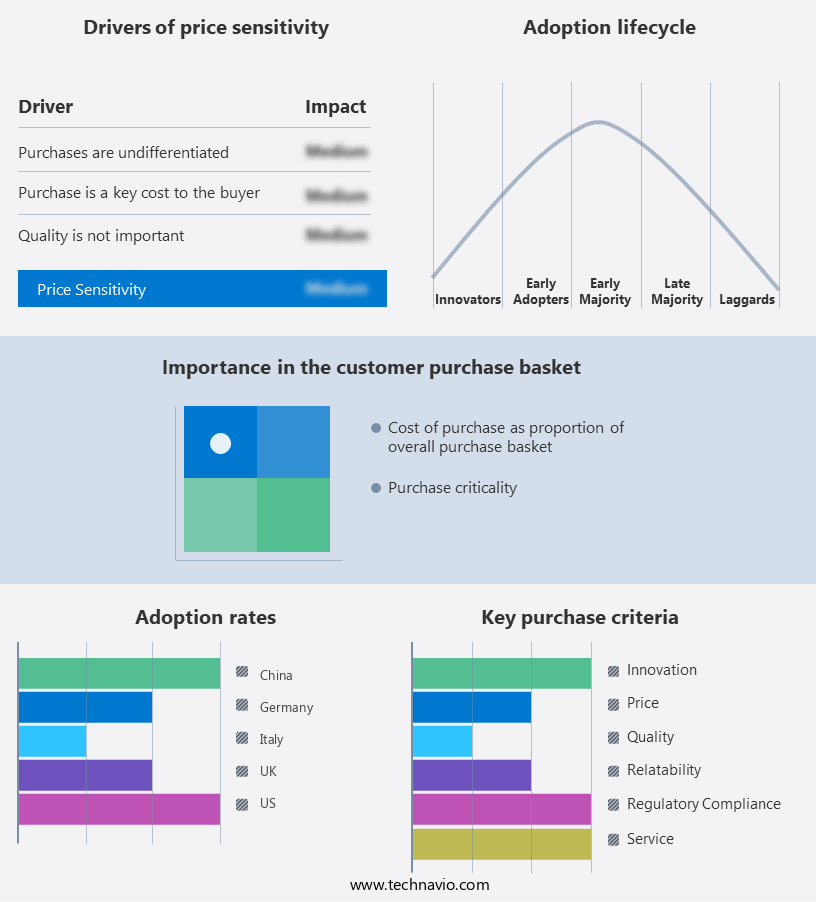
Carbon Credit Trading Platform Market Share by Geography

 Customer Landscape

Key Companies & Market Insights

Companies are implementing various strategies, such as strategic alliances, partnerships, mergers and acquisitions, geographical expansion, and product/service launches, to enhance their presence in the market.

Air Carbon: The company offers a carbon credit trading platform that involves an objective assessment of the authenticity and verification of documents.

The market research and growth report includes detailed analyses of the competitive landscape of the market and information about key companies, including:

  • Anew Climate LLC
  • BetaCarbon Pty Ltd
  • Carbon Credit Capital LLC
  • Carbon Trade Exchange
  • Carbonex Ltd.
  • Carbonplace
  • Climate Impact X PTE LTD.
  • Climatetrade
  • ClimeCo LLC
  • Deutsche Borse AG
  • Finyear
  • Flow Carbon Inc.
  • Moss Earth
  • Nasdaq Inc.
  • Pathzero Pty Ltd.
  • Planetly
  • South Pole
  • Toucan Protocol
  • Xpansiv

Qualitative and quantitative analysis of companies has been conducted to help clients understand the wider business environment as well as the strengths and weaknesses of key market players. Data is qualitatively analyzed to categorize companies as pure play, category-focused, industry-focused, and diversified; it is quantitatively analyzed to categorize companies as dominant, leading, strong, tentative, and weak.

Research Analyst Overview

The market is witnessing significant growth due to the increasing focus on climate change and the adoption of renewable energy. Net zero goals and economic transition are driving the demand for innovative tools such as carbon credits, which enable enterprises to offset their carbon emissions and demonstrate environmental responsibility. The industrial segment, including utilities and power companies, is a major consumer of carbon credits. Carbon capture technologies and renewable energy projects are key sources of carbon credits. However, the market faces challenges such as fraudulent activities and cybersecurity concerns. The regulatory landscape plays a crucial role in market stability, with both voluntary and regulated carbon markets, including cap and trade systems, providing opportunities for emission reduction projects.

Consequently, compliance markets, such as those driven by international sustainability initiatives, are a significant contributor to the market's growth. The use of blockchain technology, smart contracts, and artificial intelligence in carbon trading platforms enhances market regularity, uniformity, and transparency. Sustainability-focused investors are increasingly interested in carbon credits as a financial tool for meeting emission reduction targets and reducing their carbon footprint. The aviation, industrials, energy, petrochemical sectors are major consumers of carbon credits. Carbon trade exchanges and ecosecurities provide a platform for selling and trading carbon credits. The regulatory landscape continues to evolve, with new environmental rules and awareness driving the demand for carbon credits and carbon offsets. The market is expected to grow further as enterprises adopt sustainable practices and transition to a low-carbon economy.

Market Scope

Report Coverage

Details

Page number

150

Base year

2023

Historic period

2018-2022

Forecast period

2024-2028

Growth momentum & CAGR

Accelerate at a CAGR of 27.77%

Market growth 2024-2028

USD 313.8 million

Market structure

Fragmented

YoY growth 2023-2024(%)

22.76

Regional analysis

Europe, APAC, North America, South America, and Middle East and Africa

Performing market contribution

Europe at 80%

Key countries

Germany, UK, Italy, China, and US

Competitive landscape

Leading Companies, Market Positioning of Companies, Competitive Strategies, and Industry Risks

Key companies profiled

Air Carbon, Anew Climate LLC, BetaCarbon Pty Ltd, Carbon Credit Capital LLC, Carbon Trade Exchange, Carbonex Ltd., Carbonplace, Climate Impact X PTE LTD., Climatetrade, ClimeCo LLC, Deutsche Borse AG, Finyear, Flow Carbon Inc., Moss Earth, Nasdaq Inc., Pathzero Pty Ltd., Planetly, South Pole, Toucan Protocol, and Xpansiv

Market dynamics

Parent market analysis, market growth inducers and obstacles, market forecast, fast-growing and slow-growing segment analysis, COVID-19 impact and recovery analysis and future consumer dynamics, market condition analysis for the forecast period

Customization purview

If our market report has not included the data that you are looking for, you can reach out to our analysts and get segments customized.

Request Free Sample

What are the Key Data Covered in this Market Research and Growth Report?

  • CAGR of the market during the forecast period
  • Detailed information on factors that will drive the market growth and forecasting between 2024 and 2028
  • Precise estimation of the size of the market  and its contribution of the market in focus to the parent market
  • Accurate predictions about upcoming market growth and trends and changes in consumer behaviour
  • Growth of the market across Europe, APAC, North America, South America, and Middle East and Africa
  • Thorough analysis of the market's competitive landscape and detailed information about companies
  • Comprehensive analysis of factors that will challenge the growth of market companies

We can help! Our analysts can customize this market research report to meet your requirements. Get in touch

1 Executive Summary

  • 1.1 Market overview
    • Executive Summary - Chart on Market Overview
    • Executive Summary - Data Table on Market Overview
    • Executive Summary - Chart on Global Market Characteristics
    • Executive Summary - Chart on Market by Geography
    • Executive Summary - Chart on Market Segmentation by Type
    • Executive Summary - Chart on Market Segmentation by Service Type
    • Executive Summary - Chart on Incremental Growth
    • Executive Summary - Data Table on Incremental Growth
    • Executive Summary - Chart on Company Market Positioning

2 Market Landscape

  • 2.1 Market ecosystem
    • Parent Market
    • Data Table on - Parent Market
  • 2.2 Market characteristics
    • Market characteristics analysis
  • 2.3 Value chain analysis
    • Value Chain Analysis

3 Market Sizing

  • 3.1 Market definition
    • Offerings of companies included in the market definition
  • 3.2 Market segment analysis
    • Market segments
  • 3.3 Market size 2023
    • 3.4 Market outlook: Forecast for 2023-2028
      • Chart on Global - Market size and forecast 2023-2028 ($ million)
      • Data Table on Global - Market size and forecast 2023-2028 ($ million)
      • Chart on Global Market: Year-over-year growth 2023-2028 (%)
      • Data Table on Global Market: Year-over-year growth 2023-2028 (%)

    4 Historic Market Size

    • 4.1 Global Carbon Credit Trading Platform Market 2018 - 2022
      • Historic Market Size - Data Table on Global Carbon Credit Trading Platform Market 2018 - 2022 ($ million)
    • 4.2 Type segment analysis 2018 - 2022
      • Historic Market Size - Type Segment 2018 - 2022 ($ million)
    • 4.3 Service Type segment analysis 2018 - 2022
      • Historic Market Size - Service Type Segment 2018 - 2022 ($ million)
    • 4.4 Geography segment analysis 2018 - 2022
      • Historic Market Size - Geography Segment 2018 - 2022 ($ million)
    • 4.5 Country segment analysis 2018 - 2022
      • Historic Market Size - Country Segment 2018 - 2022 ($ million)

    5 Five Forces Analysis

    • 5.1 Five forces summary
      • Five forces analysis - Comparison between 2023 and 2028
    • 5.2 Bargaining power of buyers
      • Bargaining power of buyers - Impact of key factors 2023 and 2028
    • 5.3 Bargaining power of suppliers
      • Bargaining power of suppliers - Impact of key factors in 2023 and 2028
    • 5.4 Threat of new entrants
      • Threat of new entrants - Impact of key factors in 2023 and 2028
    • 5.5 Threat of substitutes
      • Threat of substitutes - Impact of key factors in 2023 and 2028
    • 5.6 Threat of rivalry
      • Threat of rivalry - Impact of key factors in 2023 and 2028
    • 5.7 Market condition
      • Chart on Market condition - Five forces 2023 and 2028

    6 Market Segmentation by Type

    • 6.1 Market segments
      • Chart on Type - Market share 2023-2028 (%)
      • Data Table on Type - Market share 2023-2028 (%)
    • 6.2 Comparison by Type
      • Chart on Comparison by Type
      • Data Table on Comparison by Type
    • 6.3 Voluntary carbon market - Market size and forecast 2023-2028
      • Chart on Voluntary carbon market - Market size and forecast 2023-2028 ($ million)
      • Data Table on Voluntary carbon market - Market size and forecast 2023-2028 ($ million)
      • Chart on Voluntary carbon market - Year-over-year growth 2023-2028 (%)
      • Data Table on Voluntary carbon market - Year-over-year growth 2023-2028 (%)
    • 6.4 Regulated carbon market - Market size and forecast 2023-2028
      • Chart on Regulated carbon market - Market size and forecast 2023-2028 ($ million)
      • Data Table on Regulated carbon market - Market size and forecast 2023-2028 ($ million)
      • Chart on Regulated carbon market - Year-over-year growth 2023-2028 (%)
      • Data Table on Regulated carbon market - Year-over-year growth 2023-2028 (%)
    • 6.5 Market opportunity by Type
      • Market opportunity by Type ($ million)
      • Data Table on Market opportunity by Type ($ million)

    7 Market Segmentation by Service Type

    • 7.1 Market segments
      • Chart on Service Type - Market share 2023-2028 (%)
      • Data Table on Service Type - Market share 2023-2028 (%)
    • 7.2 Comparison by Service Type
      • Chart on Comparison by Service Type
      • Data Table on Comparison by Service Type
    • 7.3 Cap and trade - Market size and forecast 2023-2028
      • Chart on Cap and trade - Market size and forecast 2023-2028 ($ million)
      • Data Table on Cap and trade - Market size and forecast 2023-2028 ($ million)
      • Chart on Cap and trade - Year-over-year growth 2023-2028 (%)
      • Data Table on Cap and trade - Year-over-year growth 2023-2028 (%)
    • 7.4 Baseline and credit - Market size and forecast 2023-2028
      • Chart on Baseline and credit - Market size and forecast 2023-2028 ($ million)
      • Data Table on Baseline and credit - Market size and forecast 2023-2028 ($ million)
      • Chart on Baseline and credit - Year-over-year growth 2023-2028 (%)
      • Data Table on Baseline and credit - Year-over-year growth 2023-2028 (%)
    • 7.5 Market opportunity by Service Type
      • Market opportunity by Service Type ($ million)
      • Data Table on Market opportunity by Service Type ($ million)

    8 Customer Landscape

    • 8.1 Customer landscape overview
      • Analysis of price sensitivity, lifecycle, customer purchase basket, adoption rates, and purchase criteria

    9 Geographic Landscape

    • 9.1 Geographic segmentation
      • Chart on Market share by geography 2023-2028 (%)
      • Data Table on Market share by geography 2023-2028 (%)
    • 9.2 Geographic comparison
      • Chart on Geographic comparison
      • Data Table on Geographic comparison
    • 9.3 Europe - Market size and forecast 2023-2028
      • Chart on Europe - Market size and forecast 2023-2028 ($ million)
      • Data Table on Europe - Market size and forecast 2023-2028 ($ million)
      • Chart on Europe - Year-over-year growth 2023-2028 (%)
      • Data Table on Europe - Year-over-year growth 2023-2028 (%)
    • 9.4 APAC - Market size and forecast 2023-2028
      • Chart on APAC - Market size and forecast 2023-2028 ($ million)
      • Data Table on APAC - Market size and forecast 2023-2028 ($ million)
      • Chart on APAC - Year-over-year growth 2023-2028 (%)
      • Data Table on APAC - Year-over-year growth 2023-2028 (%)
    • 9.5 North America - Market size and forecast 2023-2028
      • Chart on North America - Market size and forecast 2023-2028 ($ million)
      • Data Table on North America - Market size and forecast 2023-2028 ($ million)
      • Chart on North America - Year-over-year growth 2023-2028 (%)
      • Data Table on North America - Year-over-year growth 2023-2028 (%)
    • 9.6 South America - Market size and forecast 2023-2028
      • Chart on South America - Market size and forecast 2023-2028 ($ million)
      • Data Table on South America - Market size and forecast 2023-2028 ($ million)
      • Chart on South America - Year-over-year growth 2023-2028 (%)
      • Data Table on South America - Year-over-year growth 2023-2028 (%)
    • 9.7 Middle East and Africa - Market size and forecast 2023-2028
      • Chart on Middle East and Africa - Market size and forecast 2023-2028 ($ million)
      • Data Table on Middle East and Africa - Market size and forecast 2023-2028 ($ million)
      • Chart on Middle East and Africa - Year-over-year growth 2023-2028 (%)
      • Data Table on Middle East and Africa - Year-over-year growth 2023-2028 (%)
    • 9.8 Germany - Market size and forecast 2023-2028
      • Chart on Germany - Market size and forecast 2023-2028 ($ million)
      • Data Table on Germany - Market size and forecast 2023-2028 ($ million)
      • Chart on Germany - Year-over-year growth 2023-2028 (%)
      • Data Table on Germany - Year-over-year growth 2023-2028 (%)
    • 9.9 UK - Market size and forecast 2023-2028
      • Chart on UK - Market size and forecast 2023-2028 ($ million)
      • Data Table on UK - Market size and forecast 2023-2028 ($ million)
      • Chart on UK - Year-over-year growth 2023-2028 (%)
      • Data Table on UK - Year-over-year growth 2023-2028 (%)
    • 9.10 Italy - Market size and forecast 2023-2028
      • Chart on Italy - Market size and forecast 2023-2028 ($ million)
      • Data Table on Italy - Market size and forecast 2023-2028 ($ million)
      • Chart on Italy - Year-over-year growth 2023-2028 (%)
      • Data Table on Italy - Year-over-year growth 2023-2028 (%)
    • 9.11 China - Market size and forecast 2023-2028
      • Chart on China - Market size and forecast 2023-2028 ($ million)
      • Data Table on China - Market size and forecast 2023-2028 ($ million)
      • Chart on China - Year-over-year growth 2023-2028 (%)
      • Data Table on China - Year-over-year growth 2023-2028 (%)
    • 9.12 US - Market size and forecast 2023-2028
      • Chart on US - Market size and forecast 2023-2028 ($ million)
      • Data Table on US - Market size and forecast 2023-2028 ($ million)
      • Chart on US - Year-over-year growth 2023-2028 (%)
      • Data Table on US - Year-over-year growth 2023-2028 (%)
    • 9.13 Market opportunity by geography
      • Market opportunity by geography ($ million)
      • Data Tables on Market opportunity by geography ($ million)

    10 Drivers, Challenges, and Opportunity/Restraints

    • 10.1 Market drivers
      • 10.2 Market challenges
        • 10.3 Impact of drivers and challenges
          • Impact of drivers and challenges in 2023 and 2028
        • 10.4 Market opportunities/restraints

          11 Competitive Landscape

          • 11.1 Overview
            • 11.2 Competitive Landscape
              • Overview on criticality of inputs and factors of differentiation
            • 11.3 Landscape disruption
              • Overview on factors of disruption
            • 11.4 Industry risks
              • Impact of key risks on business

            12 Competitive Analysis

            • 12.1 Companies profiled
              • Companies covered
            • 12.2 Market positioning of companies
              • Matrix on companies position and classification
            • 12.3 Air Carbon
              • Air Carbon - Overview
              • Air Carbon - Product / Service
              • Air Carbon - Key offerings
            • 12.4 BetaCarbon Pty Ltd
              • BetaCarbon Pty Ltd - Overview
              • BetaCarbon Pty Ltd - Product / Service
              • BetaCarbon Pty Ltd - Key offerings
            • 12.5 Carbon Credit Capital LLC
              • Carbon Credit Capital LLC - Overview
              • Carbon Credit Capital LLC - Product / Service
              • Carbon Credit Capital LLC - Key offerings
            • 12.6 Carbon Trade Exchange
              • Carbon Trade Exchange - Overview
              • Carbon Trade Exchange - Product / Service
              • Carbon Trade Exchange - Key offerings
            • 12.7 Carbonplace
              • Carbonplace - Overview
              • Carbonplace - Product / Service
              • Carbonplace - Key offerings
            • 12.8 Climate Impact X PTE LTD.
              • Climate Impact X PTE LTD. - Overview
              • Climate Impact X PTE LTD. - Product / Service
              • Climate Impact X PTE LTD. - Key offerings
            • 12.9 Climatetrade
              • Climatetrade - Overview
              • Climatetrade - Product / Service
              • Climatetrade - Key offerings
            • 12.10 Deutsche Borse AG
              • Deutsche Borse AG - Overview
              • Deutsche Borse AG - Business segments
              • Deutsche Borse AG - Key offerings
              • Deutsche Borse AG - Segment focus
            • 12.11 Finyear
              • Finyear - Overview
              • Finyear - Product / Service
              • Finyear - Key offerings
            • 12.12 Flow Carbon Inc.
              • Flow Carbon Inc. - Overview
              • Flow Carbon Inc. - Product / Service
              • Flow Carbon Inc. - Key offerings
            • 12.13 Moss Earth
              • Moss Earth - Overview
              • Moss Earth - Product / Service
              • Moss Earth - Key offerings
            • 12.14 Nasdaq Inc.
              • Nasdaq Inc. - Overview
              • Nasdaq Inc. - Product / Service
              • Nasdaq Inc. - Key offerings
            • 12.15 Planetly
              • Planetly - Overview
              • Planetly - Product / Service
              • Planetly - Key offerings
            • 12.16 Toucan Protocol
              • Toucan Protocol - Overview
              • Toucan Protocol - Product / Service
              • Toucan Protocol - Key offerings
            • 12.17 Xpansiv
              • Xpansiv - Overview
              • Xpansiv - Product / Service
              • Xpansiv - Key offerings

            13 Appendix

            • 13.1 Scope of the report
              • 13.2 Inclusions and exclusions checklist
                • Inclusions checklist
                • Exclusions checklist
              • 13.3 Currency conversion rates for US$
                • Currency conversion rates for US$
              • 13.4 Research methodology
                • Research methodology
              • 13.5 Data procurement
                • Information sources
              • 13.6 Data validation
                • Data validation
              • 13.7 Validation techniques employed for market sizing
                • Validation techniques employed for market sizing
              • 13.8 Data synthesis
                • Data synthesis
              • 13.9 360 degree market analysis
                • 360 degree market analysis
              • 13.10 List of abbreviations
                • List of abbreviations

              Research Methodology

              Technavio presents a detailed picture of the market by way of study, synthesis, and summation of data from multiple sources. The analysts have presented the various facets of the market with a particular focus on identifying the key industry influencers. The data thus presented is comprehensive, reliable, and the result of extensive research, both primary and secondary.

              INFORMATION SOURCES

              Primary sources

              • Manufacturers and suppliers
              • Channel partners
              • Industry experts
              • Strategic decision makers

              Secondary sources

              • Industry journals and periodicals
              • Government data
              • Financial reports of key industry players
              • Historical data
              • Press releases

              DATA ANALYSIS

              Data Synthesis

              • Collation of data
              • Estimation of key figures
              • Analysis of derived insights

              Data Validation

              • Triangulation with data models
              • Reference against proprietary databases
              • Corroboration with industry experts

              REPORT WRITING

              Qualitative

              • Market drivers
              • Market challenges
              • Market trends
              • Five forces analysis

              Quantitative

              • Market size and forecast
              • Market segmentation
              • Geographical insights
              • Competitive landscape

              Interested in this report?

              Get your sample now to see our research methodology and insights!

              Download Now

              Frequently Asked Questions

              Carbon Credit Trading Platform market growth will increase by $ 313.8 mn during 2024-2028 .

              The Carbon Credit Trading Platform market is expected to grow at a CAGR of 27.77% during 2024-2028 .

              Carbon Credit Trading Platform market is segmented by Type( Voluntary carbon market, Regulated carbon market) Service Type( Cap and trade, Baseline and credit, Baseline, credit)

              Air Carbon, Anew Climate LLC, BetaCarbon Pty Ltd, Carbon Credit Capital LLC, Carbon Trade Exchange, Carbonex Ltd., Carbonplace, Climate Impact X PTE LTD., Climatetrade, ClimeCo LLC, Deutsche Borse AG, Finyear, Flow Carbon Inc., Moss Earth, Nasdaq Inc., Pathzero Pty Ltd., Planetly, South Pole, Toucan Protocol, Xpansiv are a few of the key vendors in the Carbon Credit Trading Platform market.

              Europe will register the highest growth rate of 80% among the other regions. Therefore, the Carbon Credit Trading Platform market in Europe is expected to garner significant business opportunities for the vendors during the forecast period.

              Germany, UK, Italy, China, US

              • Increasing adoption of policies on carbon emissionsGovernments around the world are increasingly regulating carbon emissions. These regulations require businesses to track and manage their carbon emissions is the driving factor this market.
              • which is driving demand for carbon credit trading platform. For instance is the driving factor this market.
              • in the US is the driving factor this market.
              • under Section 111 of the Clean Air Act is the driving factor this market.
              • the US EPA regulates greenhouse gas emissions from power plants. This gives the US EPA the flexibility to implement a standard for greenhouse gas emissions is the driving factor this market.
              • including carbon emissions is the driving factor this market.
              • from power plants. Similarly is the driving factor this market.
              • the cap-and-trade policy is the driving factor this market.
              • also known as emissions trading is the driving factor this market.
              • has been adopted in European countries as well as several Chinese cities and provinces. Organizations or companies responsible for emissions need to possess allowances for every ton of greenhouse gas that they emit during a given period. Similarly is the driving factor this market.
              • in India is the driving factor this market.
              • the Energy Conservation (Amendment) Act 2022 is the driving factor this market.
              • effective from January 1 is the driving factor this market.
              • 2023 is the driving factor this market.
              • amends the 2001 Energy Conservation Act and introduces a carbon credit trading scheme aimed at reducing carbon emissions. The Act empowers the central government to mandate a portion of energy consumption from non-fossil sources for designated consumers in the industrial and transport sectors and establishes energy consumption standards for vehicles and ships. This legislative move aligns with COP-26 goals and accelerates the decarbonization of the Indian economy through enforced use of non-fossil energy and carbon trading mechanisms. These regulations have created the need for enterprises to calculate the carbon footprint or greenhouse emissions during a given period. This generated a demand for carbon credit trading platform and solutions across the globe and is expected to drive the growth of the global carbon credit trading platform market during the forecast period. is the driving factor this market.

              The Carbon Credit Trading Platform market vendors should focus on grabbing business opportunities from the Voluntary carbon market segment as it accounted for the largest market share in the base year.