Cardless ATM Market Analysis North America, APAC, Europe, South America, Middle East and Africa - US, China, Germany, UK, India - Size and Forecast 2024-2028

Cardless ATM Market Analysis North America, APAC, Europe, South America, Middle East and Africa - US, China, Germany, UK, India - Size and Forecast 2024-2028

Published: Jul 2024 140 Pages SKU: IRTNTR73891

Market Overview at a Glance

$1.92 B
Market Opportunity
6.36%
CAGR
5.58
YoY growth 2023-2024(%)

Cardless ATM Market Size 2024-2028

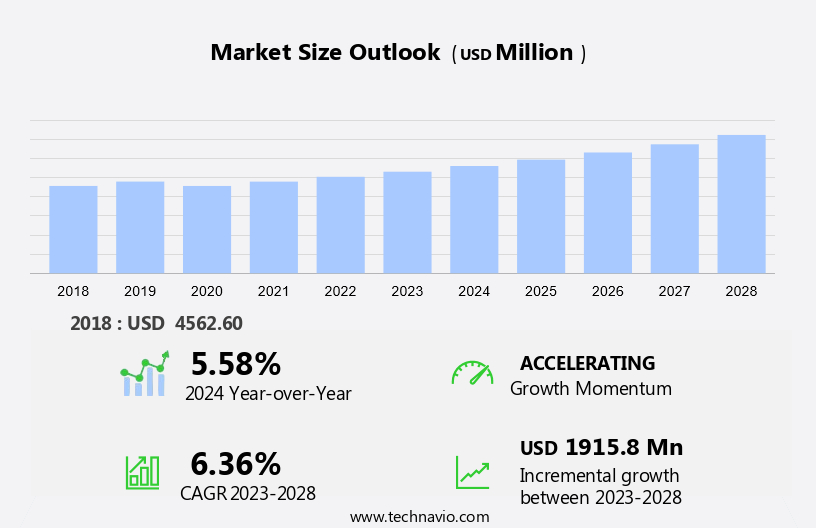
The cardless ATM market size is forecast to increase by USD 1.92 billion at a CAGR of 6.36% between 2023 and 2028.

  • The market is experiencing significant growth, driven by several key trends and factors. The increased penetration of smartphones and the emergence of biometric ATMs are major growth catalysts. Smartphones have become an integral part of our daily lives, and mobile banking applications enable users to perform various transactions, including cash withdrawals, without using traditional debit or credit cards. Biometric ATMs, which use fingerprint or facial recognition technology for authentication, offer enhanced security and convenience, making them increasingly popular. ATMs are no longer just physical machines for cash transactions; they have evolved into digital platforms offering various services through mobile apps. Additionally, regulations on contactless payment transactions are also fueling the market growth. However, challenges such as high implementation costs and security concerns related to biometric data remain. Despite these challenges, the market is expected to continue its upward trajectory, driven by the convenience and security benefits offered by cardless ATMs.

What will be the Size of the Cardless Atm Market During the Forecast Period?

Cardless Atm Market Size

 Request Free Sample

  • The market is witnessing significant growth as more financial institutions and tech companies adopt contactless technology for cash withdrawals and deposits. Transactions at Cardless ATMs can be initiated using biometrics, passcodes, or mobile apps. NFC technology and QR code scanning enable contactless transactions, enhancing user experience. ATM manufacturers, technology providers, and mobile app developers are collaborating to offer innovative solutions. Security is a major concern In the market, with geolocation services and fraud detection systems being implemented to ensure safety.
  • Furthermore, interoperability between different banking apps and ATMs is also crucial for customer convenience. Leading players In the market include NCR Corporation, focusing on enhancing the user experience through advanced technology. Startups are also entering the market, bringing competition and innovation. Banks are integrating Cardless ATMs into their banking apps to offer teller services, cash deposits, and balance checks. Despite the benefits, challenges such as technical complexities and regulatory issues persist. However, the convenience and security offered by Cardless ATMs make them a preferred choice for customers. The market is expected to continue growing, offering opportunities for both established players and new entrants.

How is this Cardless Atm Industry segmented and which is the largest segment?

The cardless atm industry research report provides comprehensive data (region-wise segment analysis), with forecasts and estimates in "USD billion" for the period 2024-2028, as well as historical data from 2018-2022 for the following segments.

  • Type
    • Offsite ATM
    • Onsite ATM
    • Others
  • Geography
    • North America
      • US
    • APAC
      • China
      • India
    • Europe
      • Germany
      • UK
    • South America
    • Middle East and Africa

By Type Insights

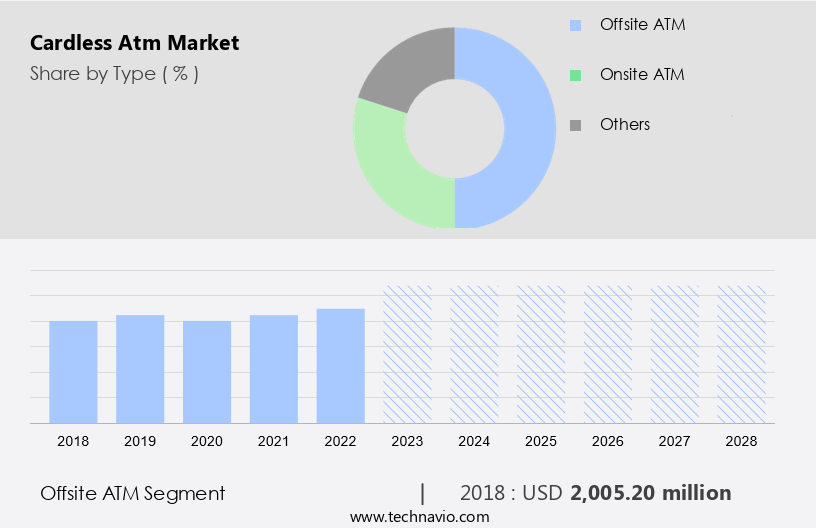
  • The offsite atm segment is estimated to witness significant growth during the forecast period.

The market primarily consists of transactions conducted at offsite Automated Teller Machines (ATMs) that do not require the use of traditional plastic cards. Offsite ATMs, which account for the largest market share, are installed outside the premises of banks and are often situated in high-traffic areas such as transportation hubs, educational institutions, and marketplaces. Users can perform cash withdrawals and deposits, check balances, and initiate contactless transactions through mobile apps or biometric authentication methods, such as passcodes or fingerprint scanning. Technology providers, ATM manufacturers, mobile app developers, and IoT technologies collaborate to offer advanced features, including NFC, QR code scanning, and data analysis tools, to enhance the user experience.

Cardless Atm Market Size

Get a glance at the Cardless Atm Industry report of share of various segments Request Free Sample

The offsite ATM segment was valued at USD 2.01 billion in 2018 and showed a gradual increase during the forecast period.

Regional Analysis

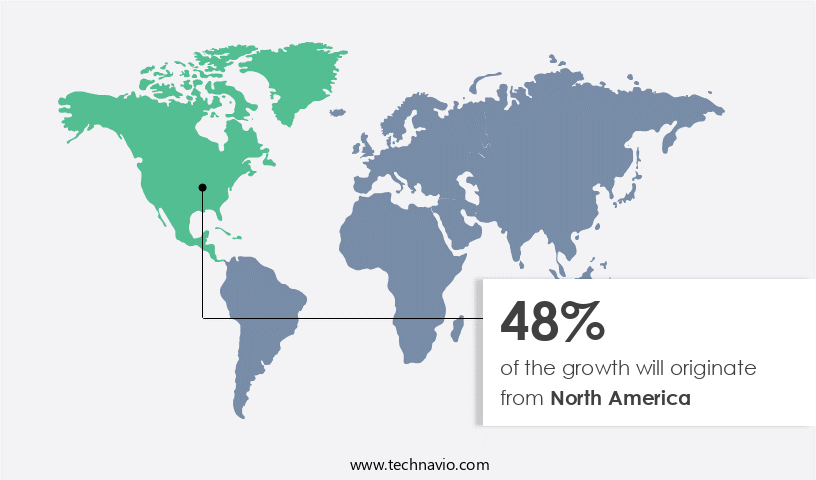
  • North America is estimated to contribute 48% to the growth of the global market during the forecast period.

Technavio's analysts have elaborately explained the regional trends and drivers that shape the market during the forecast period.

Cardless Atm Market Share by Geography

For more insights on the market share of various regions, Request Free Sample

The market is witnessing significant advancements as technology providers, ATM manufacturers, and mobile app developers collaborate to offer seamless transaction experiences. Biometrics, passcodes, and QR code scanning are becoming the new norm for cash withdrawals and deposits, replacing traditional card usage. This shift towards cardless transactions enhances user experience and reduces the risk of skimming and fraud. Startups and banking institutions are investing in NFC and contactless technologies to build interoperable systems, ensuring customers can access their balances and banking services through various channels. Security is a top priority, with data analysis tools and IT infrastructure safeguards to prevent data breaches and data security threats.

Market Dynamics

Our researchers analyzed the data with 2023 as the base year, along with the key drivers, trends, and challenges. A holistic analysis of drivers will help companies refine their marketing strategies to gain a competitive advantage.

What are the key market drivers leading to the rise In the adoption of Cardless Atm Industry?

Increased penetration of smartphones is the key driver of the market.

  • The global market for Cardless ATM transactions is witnessing significant growth, driven by the increasing popularity of smart hardware such as NFC-enabled devices and QR codes. Companies like NEXGO and GUOXIN MICRO are leading this innovation with their advanced solutions. In India, for instance, the Unified Payments Interface (UPI) and various payment systems like Empays Payment and IMT Payment System have facilitated cashless transactions through smartphones. Major financial institutions such as Mastercard are also embracing contactless payment systems to enhance security and convenience. The integration of digital currency, Blockchain, Artificial Intelligence, IoT, and communication technologies like Azure Cognitive Services and facial recognition is further revolutionizing the ATM industry.
  • Moreover, geolocation services and PINless transactions are also gaining traction, aiming to eliminate ATM fraud. Chinese smartphone manufacturers, including Xiaomi Corp., Guangdong Oppo Mobile Telecommunications Corp., Ltd, and OnePlus Technology Co., Ltd, are playing a crucial role in expanding the market by offering affordable smartphones, making digital transactions more accessible to a broader population.

What are the market trends shaping the Cardless Atm Industry?

Emergence of biometric ATM is the upcoming market trend.

  • The market is witnessing significant growth due to the integration of advanced technologies such as NEXGO and GUOXIN MICRO's smart hardware. These innovations enable contactless payment methods like UPI, NFC-enabled smartphones, and QR codes for cashless transactions. Biometric technologies, including facial recognition, are increasingly being used in ATMs for multi-factor authentication. This technology uses single or multiple factors such as finger, iris, and face scanning for secure transactions. However, concerns over hygiene and potential ATM fraud persist, leading to the exploration of alternative authentication methods. For instance, Empays Payment and IMT Payment System are integrating Mastercard's contactless payment solutions to minimize physical contact.
  • Furthermore, the adoption of digital currency, blockchain, artificial intelligence, IoT, and geolocation services is transforming the ATM landscape. Azure Cognitive Services, for example, offer facial recognition capabilities to enhance security, while NAB is testing ATMs with PINless transactions. These advancements aim to provide a seamless, secure, and hygienic banking experience for customers.

What challenges does the Cardless Atm Industry face during its growth?

Regulations on contactless payment transactions is a key challenge affecting the industry growth.

  • Cardless ATMs, facilitated by smart hardware from companies like NEXGO and GUOXIN MICRO, enable contactless transactions using smartphones and NFC-enabled devices. However, there are limitations to these transactions, with most geographical regions imposing a daily maximum limit on cash withdrawals. For instance, HDFC Bank Ltd. Permits a maximum of approximately USD127 per day, while ICICI Bank Ltd. Allows up to USD254. These restrictions are imposed by central banks to prevent fraud, as cardless payment devices are susceptible to unauthorized access when ATMs are in close proximity. Additionally, contactless payment methods such as UPI, Empays Payment, and IMT Payment System, as well as digital currencies, are gaining popularity.
  • In addition, Mastercard and other financial institutions are integrating advanced technologies like blockchain, artificial intelligence, IoT, facial recognition, and geolocation services through Azure Cognitive Services to enhance security and user experience. Despite these advancements, ensuring the security of cardless transactions remains a significant challenge.

Exclusive Customer Landscape

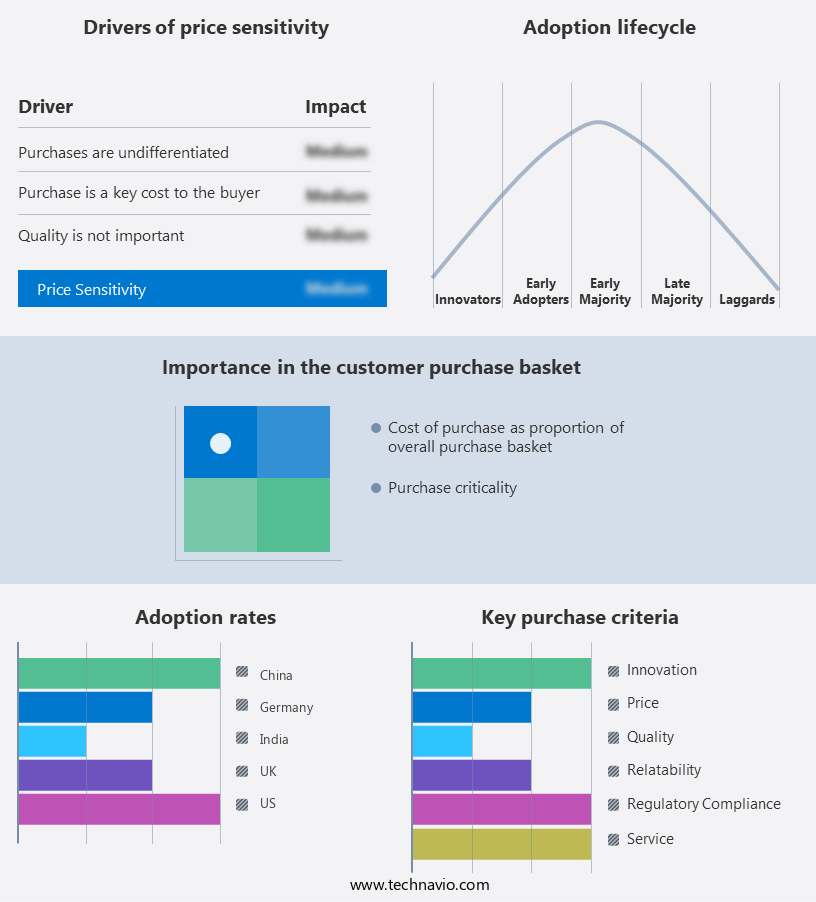
The cardless atm market forecasting report includes the adoption lifecycle of the market, covering from the innovator's stage to the laggard's stage. It focuses on adoption rates in different regions based on penetration. Furthermore, the cardless atm market report also includes key purchase criteria and drivers of price sensitivity to help companies evaluate and develop their market growth analysis strategies.

Cardless Atm Market Share by Geography

 Customer Landscape

Key Companies & Market Insights

Companies are implementing various strategies, such as strategic alliances, cardless ATM market forecast, partnerships, mergers and acquisitions, geographical expansion, and product/service launches, to enhance their presence In the industry.

The industry research and growth report includes detailed analyses of the competitive landscape of the market and information about key companies, including:

  • Banco Santander SA
  • Barclays Bank Plc
  • Citigroup Inc.
  • Commonwealth Bank of Australia
  • Diebold Nixdorf Inc.
  • Fifth Third Bancorp
  • Fujitsu Ltd.
  • GRGBanking
  • HDFC Bank Ltd.
  • HSBC Holdings Plc
  • Hyosung Corp.
  • ICICI Bank Ltd.
  • JPMorgan Chase and Co.
  • Kotak Mahindra Bank Ltd.
  • NCR Voyix Corp.
  • State Bank of India
  • Turk Ekonomi Bank AS
  • Wells Fargo and Co.

Qualitative and quantitative analysis of companies has been conducted to help clients understand the wider business environment as well as the strengths and weaknesses of key industry players. Data is qualitatively analyzed to categorize companies as pure play, category-focused, industry-focused, and diversified; it is quantitatively analyzed to categorize companies as dominant, leading, strong, tentative, and weak.

Research Analyst Overview

The market is revolutionizing the way customers perform cash transactions without the need for traditional plastic cards. This innovative technology enables users to withdraw cash, make deposits, and check balances using biometrics, passcodes, or mobile apps. ATM manufacturers and technology providers collaborate to develop smart ATMs equipped with NFC, contactless transactions, QR code scanning, and IoT technologies. Mobile app developers play a crucial role in creating banking apps that facilitate cardless transactions, enhancing user experience. Security is a top priority In the market, with biometric authentication and data security measures ensuring fraud protection.

In addition, interoperability between various banking apps and ATMs is essential for seamless transactions. Competitors In the market include Huawei Cloud, OEMs, systems integrators, and technology companies. The market growth is driven by increasing mobile banking participation, improved IT infrastructure, and financing from various sources. End-users benefit from the convenience of cardless transactions, faster cash withdrawals, and reduced dependency on teller services. However, data breaches and data security concerns remain challenges for the market.

Market Scope

Report Coverage

Details

Page number

140

Base year

2023

Historic period

2018-2022

Forecast period

2024-2028

Growth momentum & CAGR

Accelerate at a CAGR of 6.36%

Market growth 2024-2028

USD 1.92 billion

Market structure

Fragmented

YoY growth 2023-2024(%)

5.58

Key countries

US, China, Germany, UK, and India

Competitive landscape

Leading Companies, market growth and forecasting, Market Positioning of Companies, Competitive Strategies, and Industry Risks

Request Free Sample

What are the Key Data Covered in this Cardless Atm Market Research and Growth Report?

  • CAGR of the Cardless Atm industry during the forecast period
  • Detailed information on factors that will drive the growth and forecasting between 2024 and 2028
  • Precise estimation of the size of the market and its contribution of the industry in focus to the parent market
  • Accurate predictions about upcoming growth and trends and changes in consumer behaviour
  • Growth of the market across North America, APAC, Europe, South America, and Middle East and Africa
  • Thorough analysis of the market's competitive landscape and detailed information about companies
  • Comprehensive analysis of factors that will challenge the cardless ATM market growth of industry companies

We can help! Our analysts can customize this cardless ATM market research report to meet your requirements.

Get in touch

1 Executive Summary

  • 1.1 Market overview
    • Executive Summary - Chart on Market Overview
    • Executive Summary - Data Table on Market Overview
    • Executive Summary - Chart on Global Market Characteristics
    • Executive Summary - Chart on Market by Geography
    • Executive Summary - Chart on Market Segmentation by Type
    • Executive Summary - Chart on Incremental Growth
    • Executive Summary - Data Table on Incremental Growth
    • Executive Summary - Chart on Company Market Positioning

2 Market Landscape

  • 2.1 Market ecosystem
    • Parent Market
    • Data Table on - Parent Market
  • 2.2 Market characteristics
    • Market characteristics analysis
  • 2.3 Value chain analysis
    • Value Chain Analysis

3 Market Sizing

  • 3.1 Market definition
    • Offerings of companies included in the market definition
  • 3.2 Market segment analysis
    • Market segments
  • 3.3 Market size 2023
    • 3.4 Market outlook: Forecast for 2023-2028
      • Chart on Global - Market size and forecast 2023-2028 ($ million)
      • Data Table on Global - Market size and forecast 2023-2028 ($ million)
      • Chart on Global Market: Year-over-year growth 2023-2028 (%)
      • Data Table on Global Market: Year-over-year growth 2023-2028 (%)

    4 Historic Market Size

    • 4.1 Global Cardless ATM Market 2018 - 2022
      • Historic Market Size - Data Table on Global Cardless ATM Market 2018 - 2022 ($ million)
    • 4.2 Type segment analysis 2018 - 2022
      • Historic Market Size - Type Segment 2018 - 2022 ($ million)
    • 4.3 Geography segment analysis 2018 - 2022
      • Historic Market Size - Geography Segment 2018 - 2022 ($ million)
    • 4.4 Country segment analysis 2018 - 2022
      • Historic Market Size - Country Segment 2018 - 2022 ($ million)

    5 Five Forces Analysis

    • 5.1 Five forces summary
      • Five forces analysis - Comparison between 2023 and 2028
    • 5.2 Bargaining power of buyers
      • Bargaining power of buyers - Impact of key factors 2023 and 2028
    • 5.3 Bargaining power of suppliers
      • Bargaining power of suppliers - Impact of key factors in 2023 and 2028
    • 5.4 Threat of new entrants
      • Threat of new entrants - Impact of key factors in 2023 and 2028
    • 5.5 Threat of substitutes
      • Threat of substitutes - Impact of key factors in 2023 and 2028
    • 5.6 Threat of rivalry
      • Threat of rivalry - Impact of key factors in 2023 and 2028
    • 5.7 Market condition
      • Chart on Market condition - Five forces 2023 and 2028

    6 Market Segmentation by Type

    • 6.1 Market segments
      • Chart on Type - Market share 2023-2028 (%)
      • Data Table on Type - Market share 2023-2028 (%)
    • 6.2 Comparison by Type
      • Chart on Comparison by Type
      • Data Table on Comparison by Type
    • 6.3 Offsite ATM - Market size and forecast 2023-2028
      • Chart on Offsite ATM - Market size and forecast 2023-2028 ($ million)
      • Data Table on Offsite ATM - Market size and forecast 2023-2028 ($ million)
      • Chart on Offsite ATM - Year-over-year growth 2023-2028 (%)
      • Data Table on Offsite ATM - Year-over-year growth 2023-2028 (%)
    • 6.4 Onsite ATM - Market size and forecast 2023-2028
      • Chart on Onsite ATM - Market size and forecast 2023-2028 ($ million)
      • Data Table on Onsite ATM - Market size and forecast 2023-2028 ($ million)
      • Chart on Onsite ATM - Year-over-year growth 2023-2028 (%)
      • Data Table on Onsite ATM - Year-over-year growth 2023-2028 (%)
    • 6.5 Others - Market size and forecast 2023-2028
      • Chart on Others - Market size and forecast 2023-2028 ($ million)
      • Data Table on Others - Market size and forecast 2023-2028 ($ million)
      • Chart on Others - Year-over-year growth 2023-2028 (%)
      • Data Table on Others - Year-over-year growth 2023-2028 (%)
    • 6.6 Market opportunity by Type
      • Market opportunity by Type ($ million)
      • Data Table on Market opportunity by Type ($ million)

    7 Customer Landscape

    • 7.1 Customer landscape overview
      • Analysis of price sensitivity, lifecycle, customer purchase basket, adoption rates, and purchase criteria

    8 Geographic Landscape

    • 8.1 Geographic segmentation
      • Chart on Market share by geography 2023-2028 (%)
      • Data Table on Market share by geography 2023-2028 (%)
    • 8.2 Geographic comparison
      • Chart on Geographic comparison
      • Data Table on Geographic comparison
    • 8.3 North America - Market size and forecast 2023-2028
      • Chart on North America - Market size and forecast 2023-2028 ($ million)
      • Data Table on North America - Market size and forecast 2023-2028 ($ million)
      • Chart on North America - Year-over-year growth 2023-2028 (%)
      • Data Table on North America - Year-over-year growth 2023-2028 (%)
    • 8.4 APAC - Market size and forecast 2023-2028
      • Chart on APAC - Market size and forecast 2023-2028 ($ million)
      • Data Table on APAC - Market size and forecast 2023-2028 ($ million)
      • Chart on APAC - Year-over-year growth 2023-2028 (%)
      • Data Table on APAC - Year-over-year growth 2023-2028 (%)
    • 8.5 Europe - Market size and forecast 2023-2028
      • Chart on Europe - Market size and forecast 2023-2028 ($ million)
      • Data Table on Europe - Market size and forecast 2023-2028 ($ million)
      • Chart on Europe - Year-over-year growth 2023-2028 (%)
      • Data Table on Europe - Year-over-year growth 2023-2028 (%)
    • 8.6 South America - Market size and forecast 2023-2028
      • Chart on South America - Market size and forecast 2023-2028 ($ million)
      • Data Table on South America - Market size and forecast 2023-2028 ($ million)
      • Chart on South America - Year-over-year growth 2023-2028 (%)
      • Data Table on South America - Year-over-year growth 2023-2028 (%)
    • 8.7 Middle East and Africa - Market size and forecast 2023-2028
      • Chart on Middle East and Africa - Market size and forecast 2023-2028 ($ million)
      • Data Table on Middle East and Africa - Market size and forecast 2023-2028 ($ million)
      • Chart on Middle East and Africa - Year-over-year growth 2023-2028 (%)
      • Data Table on Middle East and Africa - Year-over-year growth 2023-2028 (%)
    • 8.8 US - Market size and forecast 2023-2028
      • Chart on US - Market size and forecast 2023-2028 ($ million)
      • Data Table on US - Market size and forecast 2023-2028 ($ million)
      • Chart on US - Year-over-year growth 2023-2028 (%)
      • Data Table on US - Year-over-year growth 2023-2028 (%)
    • 8.9 China - Market size and forecast 2023-2028
      • Chart on China - Market size and forecast 2023-2028 ($ million)
      • Data Table on China - Market size and forecast 2023-2028 ($ million)
      • Chart on China - Year-over-year growth 2023-2028 (%)
      • Data Table on China - Year-over-year growth 2023-2028 (%)
    • 8.10 Germany - Market size and forecast 2023-2028
      • Chart on Germany - Market size and forecast 2023-2028 ($ million)
      • Data Table on Germany - Market size and forecast 2023-2028 ($ million)
      • Chart on Germany - Year-over-year growth 2023-2028 (%)
      • Data Table on Germany - Year-over-year growth 2023-2028 (%)
    • 8.11 UK - Market size and forecast 2023-2028
      • Chart on UK - Market size and forecast 2023-2028 ($ million)
      • Data Table on UK - Market size and forecast 2023-2028 ($ million)
      • Chart on UK - Year-over-year growth 2023-2028 (%)
      • Data Table on UK - Year-over-year growth 2023-2028 (%)
    • 8.12 India - Market size and forecast 2023-2028
      • Chart on India - Market size and forecast 2023-2028 ($ million)
      • Data Table on India - Market size and forecast 2023-2028 ($ million)
      • Chart on India - Year-over-year growth 2023-2028 (%)
      • Data Table on India - Year-over-year growth 2023-2028 (%)
    • 8.13 Market opportunity by geography
      • Market opportunity by geography ($ million)
      • Data Tables on Market opportunity by geography ($ million)

    9 Drivers, Challenges, and Opportunity/Restraints

    • 9.1 Market drivers
      • 9.2 Market challenges
        • 9.3 Impact of drivers and challenges
          • Impact of drivers and challenges in 2023 and 2028
        • 9.4 Market opportunities/restraints

          10 Competitive Landscape

          • 10.1 Overview
            • 10.2 Competitive Landscape
              • Overview on criticality of inputs and factors of differentiation
            • 10.3 Landscape disruption
              • Overview on factors of disruption
            • 10.4 Industry risks
              • Impact of key risks on business

            11 Competitive Analysis

            • 11.1 Companies profiled
              • Companies covered
            • 11.2 Market positioning of companies
              • Matrix on companies position and classification
            • 11.3 Citigroup Inc.
              • Citigroup Inc. - Overview
              • Citigroup Inc. - Business segments
              • Citigroup Inc. - Key news
              • Citigroup Inc. - Key offerings
              • Citigroup Inc. - Segment focus
            • 11.4 Commonwealth Bank of Australia
              • Commonwealth Bank of Australia - Overview
              • Commonwealth Bank of Australia - Business segments
              • Commonwealth Bank of Australia - Key offerings
              • Commonwealth Bank of Australia - Segment focus
            • 11.5 Diebold Nixdorf Inc.
              • Diebold Nixdorf Inc. - Overview
              • Diebold Nixdorf Inc. - Business segments
              • Diebold Nixdorf Inc. - Key news
              • Diebold Nixdorf Inc. - Key offerings
              • Diebold Nixdorf Inc. - Segment focus
            • 11.6 Fujitsu Ltd.
              • Fujitsu Ltd. - Overview
              • Fujitsu Ltd. - Business segments
              • Fujitsu Ltd. - Key news
              • Fujitsu Ltd. - Key offerings
              • Fujitsu Ltd. - Segment focus
            • 11.7 GRGBanking
              • GRGBanking - Overview
              • GRGBanking - Product / Service
              • GRGBanking - Key offerings
            • 11.8 HDFC Bank Ltd.
              • HDFC Bank Ltd. - Overview
              • HDFC Bank Ltd. - Business segments
              • HDFC Bank Ltd. - Key offerings
              • HDFC Bank Ltd. - Segment focus
            • 11.9 HSBC Holdings Plc
              • HSBC Holdings Plc - Overview
              • HSBC Holdings Plc - Business segments
              • HSBC Holdings Plc - Key news
              • HSBC Holdings Plc - Key offerings
              • HSBC Holdings Plc - Segment focus
            • 11.10 Hyosung Corp.
              • Hyosung Corp. - Overview
              • Hyosung Corp. - Product / Service
              • Hyosung Corp. - Key news
              • Hyosung Corp. - Key offerings
            • 11.11 JPMorgan Chase and Co.
              • JPMorgan Chase and Co. - Overview
              • JPMorgan Chase and Co. - Business segments
              • JPMorgan Chase and Co. - Key news
              • JPMorgan Chase and Co. - Key offerings
              • JPMorgan Chase and Co. - Segment focus
            • 11.12 NCR Voyix Corp.
              • NCR Voyix Corp. - Overview
              • NCR Voyix Corp. - Business segments
              • NCR Voyix Corp. - Key news
              • NCR Voyix Corp. - Key offerings
              • NCR Voyix Corp. - Segment focus

            12 Appendix

            • 12.1 Scope of the report
              • 12.2 Inclusions and exclusions checklist
                • Inclusions checklist
                • Exclusions checklist
              • 12.3 Currency conversion rates for US$
                • Currency conversion rates for US$
              • 12.4 Research methodology
                • Research methodology
              • 12.5 Data procurement
                • Information sources
              • 12.6 Data validation
                • Data validation
              • 12.7 Validation techniques employed for market sizing
                • Validation techniques employed for market sizing
              • 12.8 Data synthesis
                • Data synthesis
              • 12.9 360 degree market analysis
                • 360 degree market analysis
              • 12.10 List of abbreviations
                • List of abbreviations

              Research Methodology

              Technavio presents a detailed picture of the market by way of study, synthesis, and summation of data from multiple sources. The analysts have presented the various facets of the market with a particular focus on identifying the key industry influencers. The data thus presented is comprehensive, reliable, and the result of extensive research, both primary and secondary.

              INFORMATION SOURCES

              Primary sources

              • Manufacturers and suppliers
              • Channel partners
              • Industry experts
              • Strategic decision makers

              Secondary sources

              • Industry journals and periodicals
              • Government data
              • Financial reports of key industry players
              • Historical data
              • Press releases

              DATA ANALYSIS

              Data Synthesis

              • Collation of data
              • Estimation of key figures
              • Analysis of derived insights

              Data Validation

              • Triangulation with data models
              • Reference against proprietary databases
              • Corroboration with industry experts

              REPORT WRITING

              Qualitative

              • Market drivers
              • Market challenges
              • Market trends
              • Five forces analysis

              Quantitative

              • Market size and forecast
              • Market segmentation
              • Geographical insights
              • Competitive landscape

              Interested in this report?

              Get your sample now to see our research methodology and insights!

              Download Now

              Frequently Asked Questions

              Cardless Atm market growth will increase by $ 1915.8 mn during 2024-2028.

              The Cardless Atm market is expected to grow at a CAGR of 6.36% during 2024-2028.

              Cardless Atm market is segmented by Type( Offsite ATM, Onsite ATM, Others)

              Banco Santander SA, Barclays Bank Plc, Citigroup Inc., Commonwealth Bank of Australia, Diebold Nixdorf Inc., Fifth Third Bancorp, Fujitsu Ltd., GRGBanking, HDFC Bank Ltd., HSBC Holdings Plc, Hyosung Corp., ICICI Bank Ltd., JPMorgan Chase and Co., Kotak Mahindra Bank Ltd., NCR Voyix Corp., State Bank of India, Turk Ekonomi Bank AS, Wells Fargo and Co. are a few of the key vendors in the Cardless Atm market.

              North America will register the highest growth rate of 48% among the other regions. Therefore, the Cardless Atm market in North America is expected to garner significant business opportunities for the vendors during the forecast period.

              US, China, Germany, UK, India

              • Increased penetration of smartphonesMost of the growth in the global smartphone market is attributed to the rising sales of low-priced smartphones (<$200). The demand for low-cost smartphones is primarily from countries such as India is the driving factor this market.
              • Vietnam is the driving factor this market.
              • the Philippines is the driving factor this market.
              • Sri Lanka is the driving factor this market.
              • and Pakistan in APAC is the driving factor this market.
              • and Spain is the driving factor this market.
              • Greece is the driving factor this market.
              • and Turkey in EMEA. A few of the popular smartphone models that cost below $200 include Nokia 7.1 and Nokia 6.1. Developing countries such as China and India have become high-growth potential markets for low-cost smartphones. Numerous Chinese smartphone manufacturers such as Xiaomi Corp. is the driving factor this market.
              • Guangdong Oppo Mobile Telecommunications Corp. is the driving factor this market.
              • Ltd is the driving factor this market.
              • is the driving factor this market.
              • and OnePlus Technology Co. is the driving factor this market.
              • Ltd. are generating significant profits through the sales of low-cost smartphones. These low-cost smartphones are integrated with several features that are usually available in high-end smartphones. As a result is the driving factor this market.
              • customers in these countries prefer purchasing smartphones belonging to the above-mentioned manufacturers.The increasing demand for smartphones is expected to drive the growth of the market in focus during the forecast period. NFC-enabled smartphones can be used for peer-to-peer communication is the driving factor this market.
              • read/write mode is the driving factor this market.
              • and card emulator applications. In the peer-to-peer communication model is the driving factor this market.
              • NFC chips enable smartphones to connect with other NFC-enabled devices in cardless ATMs for data transferring. On the other hand is the driving factor this market.
              • in QR code verification is the driving factor this market.
              • a smartphone can read QR codes on the ATM screen. Therefore is the driving factor this market.
              • the increasing penetration of smartphones globally is expected to drive the growth of the global cardless ATM market during the forecast period. is the driving factor this market.

              The Cardless Atm market vendors should focus on grabbing business opportunities from the Offsite ATM segment as it accounted for the largest market share in the base year.