
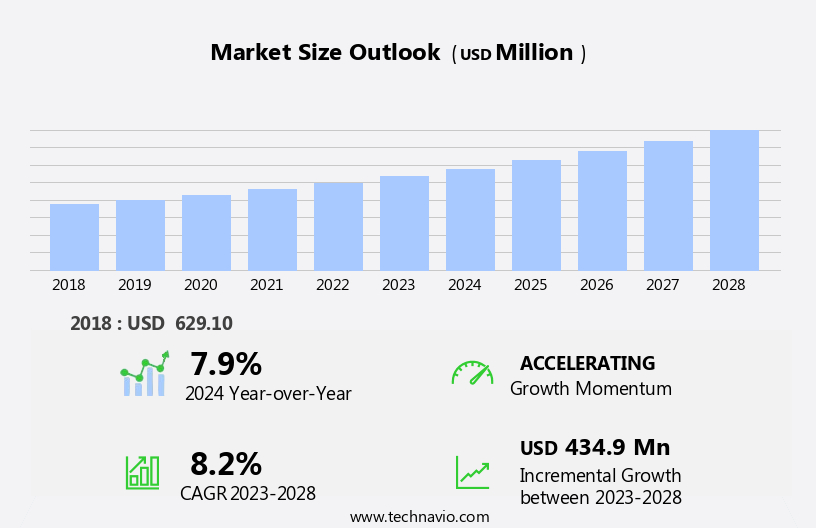
Newborn Screening Market Size 2024-2028
The newborn screening market size is forecast to increase by USD 434.9 million, at a CAGR of 8.2% between 2023 and 2028.
- The market is driven by the high prevalence of congenital disorders that can be identified and treated through early screening. According to the data, these conditions, if left untreated, can lead to severe health complications and even death. The integration of next-generation sequencing technology into newborn screening programs offers significant opportunities for market growth, enabling the detection of a wider range of disorders with greater accuracy and efficiency. However, challenges persist, including limited access to these screening programs, particularly in developing countries and underserved populations. Additionally, the high cost of advanced screening technologies and the need for continuous investment in research and development to stay abreast of emerging technologies pose significant challenges for market participants.
- Companies seeking to capitalize on market opportunities must focus on expanding access to screening programs, collaborating with healthcare providers and governments, and investing in research and development to offer innovative solutions that address these challenges.
What will be the Size of the Newborn Screening Market during the forecast period?
Explore in-depth regional segment analysis with market size data - historical 2018-2022 and forecasts 2024-2028 - in the full report.
Request Free Sample
The market continues to evolve, driven by advancements in technology and the expanding scope of tests offered. Metabolic disorders, such as cystic fibrosis and phenylketonuria, are routinely screened using expanded newborn screening panels. Neonatal screening guidelines dictate follow-up testing procedures, ensuring timely intervention for conditions like congenital hypothyroidism and immunodeficiencies. Blood spot analysis, a crucial component of newborn screening, is enhanced by data interpretation software and laboratory automation, improving efficiency and accuracy. Endocrine disorders, electrolyte imbalances, and even hearing loss can now be detected through these screening programs. Quality assurance metrics and tandem mass spectrometry are essential tools for maintaining the high standards required in newborn screening.
Early intervention programs, clinical decision support, and treatment initiation timing are critical factors in optimizing patient outcomes. Genetic testing methods, including chromosomal microarray analysis and DNA sequencing technologies, are increasingly integrated into newborn screening panels. Population screening programs continue to expand, focusing on biochemical markers to identify conditions that may otherwise go undetected. Despite advancements, challenges persist, including managing false positive and false negative rates. Continuous improvement and innovation are essential to address these challenges and ensure the best possible outcomes for newborns.
How is this Newborn Screening Industry segmented?
The newborn screening industry research report provides comprehensive data (region-wise segment analysis), with forecasts and estimates in "USD million" for the period 2024-2028, as well as historical data from 2018-2022 for the following segments.
- End-user
- Hospitals
- Clinical laboratories
- Product
- Consumables
- Instruments
- Hearing screening instruments
- Pulse oximeters
- Geography
- North America
- US
- Canada
- Europe
- France
- Germany
- Spain
- UK
- APAC
- China
- India
- Japan
- South Korea
- Rest of World (ROW)
- North America
By End-user Insights
The hospitals segment is estimated to witness significant growth during the forecast period.
The market is witnessing significant activity as hospitals prioritize essential health initiatives for newborns. Comprehensive screening programs, such as those implemented by Hospital Colorado, aim to identify various congenital conditions, including congenital hypothyroidism, congenital adrenal hyperplasia, glucose-6-phosphate dehydrogenase deficiency, galactosemia, and biotinidase deficiency. Early detection of these disorders enables timely intervention and effective treatment, leading to improved health outcomes for affected infants. Hospitals' investments in advanced technologies, like tandem mass spectrometry and data interpretation software, facilitate high-throughput screening and accurate diagnosis. Neonatal screening guidelines and follow-up testing procedures ensure standardization and quality in these programs. Laboratory automation and quality assurance metrics contribute to efficient testing processes and reduce false positives and false negatives.
Beyond healthcare benefits, these investments also have broader economic implications. Hospitals and health systems support approximately one out of every nine jobs in the United States, making them significant economic anchors within their communities. Screening programs encompass various tests, such as metabolic disorders testing, cystic fibrosis screening, carrier screening tests, and endocrine disorders screening. Technologies like DNA sequencing and chromosomal microarray analysis expand the scope of newborn screening, enabling the detection of a broader range of disorders. Early intervention programs and clinical decision support systems facilitate effective treatment initiation and improve patient outcomes. Biochemical markers and electrolyte imbalance detection are essential components of these programs, ensuring comprehensive care for newborns.
In conclusion, The market is witnessing substantial growth as hospitals prioritize early detection and effective treatment of congenital conditions. Advanced technologies, standardized guidelines, and economic benefits contribute to the market's evolution and significance in the healthcare landscape.
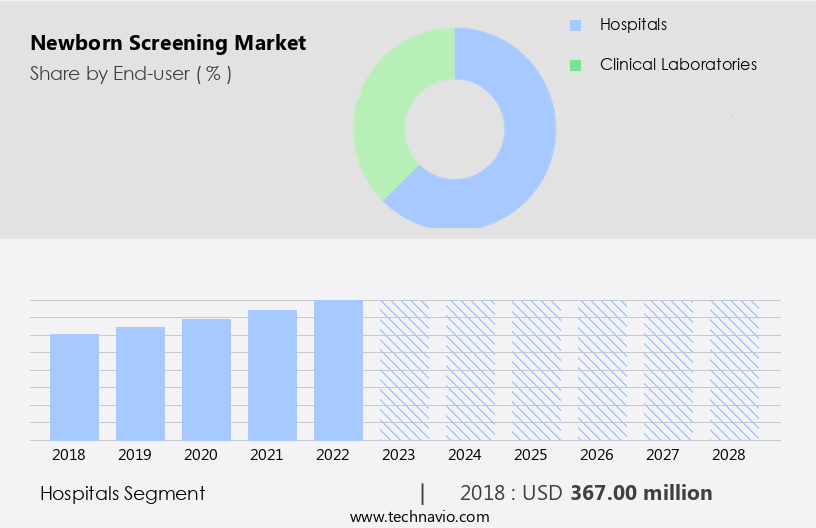
The Hospitals segment was valued at USD 367.00 million in 2018 and showed a gradual increase during the forecast period.
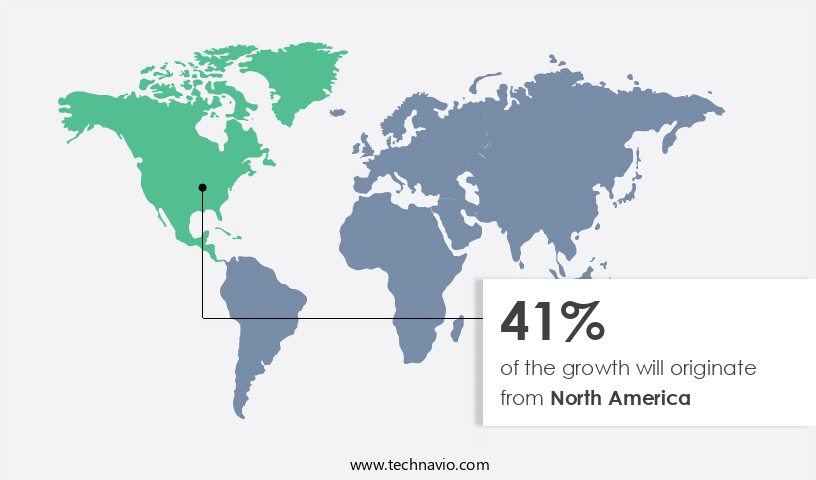
Regional Analysis
North America is estimated to contribute 41% to the growth of the global market during the forecast period.Technavio’s analysts have elaborately explained the regional trends and drivers that shape the market during the forecast period.
The market is experiencing significant growth, particularly in North America, due to the high prevalence of congenital conditions, advanced healthcare infrastructure, and expanding testing capabilities. Metabolic disorders, including cystic fibrosis and phenylketonuria, are among the primary focuses of newborn metabolic screening. Carrier screening tests and congenital hypothyroidism testing are also crucial components of newborn screening programs. Data interpretation software and neonatal screening guidelines facilitate accurate diagnosis and follow-up testing procedures. Blood spot analysis, a common method for newborn screening, enables the detection of various disorders, including immunodeficiencies and endocrine disorders. Tandem mass spectrometry and chromosomal microarray analysis are advanced technologies used for high-throughput screening and detection of biochemical markers.
Early intervention programs play a vital role in improving patient outcomes, emphasizing the importance of accurate and timely screening. False positive and false negative rates are essential quality assurance metrics in the newborn screening process. Endocrine disorders, electrolyte imbalances, and hearing loss are among the various conditions screened for in newborns. Laboratory automation and clinical decision support systems streamline the screening process and facilitate treatment initiation timing. Genetic testing methods, such as DNA sequencing technologies, are increasingly used in newborn screening panels to identify genetic disorders. Population screening programs aim to ensure that all newborns receive essential tests to promote optimal health and development.
Market Dynamics
Our researchers analyzed the data with 2023 as the base year, along with the key drivers, trends, and challenges. A holistic analysis of drivers will help companies refine their marketing strategies to gain a competitive advantage.
What are the key market drivers leading to the rise in the adoption of Newborn Screening Industry?
- The significant incidence of congenital disorders serves as the primary market driver.
- The market is experiencing substantial growth due to the high prevalence of congenital disorders. Approximately 240,000 newborns worldwide do not survive their first month, and an additional 170,000 children aged between one month and five years die from these anomalies each year. Newborn metabolic screening, including tests for cystic fibrosis and congenital hypothyroidism, plays a crucial role in early detection and intervention. Hospitals and healthcare providers are increasingly adopting advanced technologies for newborn screening programs. The demand for these sophisticated diagnostic tools, such as genetic testing and metabolic screening, is escalating as early detection significantly improves treatment outcomes.
- Data interpretation software is also gaining popularity to facilitate accurate and efficient analysis of screening results. The market dynamics are driven by the urgent need to address the high mortality rate associated with congenital disorders and the potential for improved health outcomes through early intervention.
What are the market trends shaping the Newborn Screening Industry?
- Next-generation sequencing integration is an emerging market trend. This technological advancement is mandatory for progressive laboratories and research institutions.
- The market is experiencing significant advancements, with the integration of next-generation sequencing (NGS) gaining momentum. In April 2024, Revvity introduced an innovative NGS panel and workflow, designed to enhance traditional screening methods. This new assay, currently available as a minimum viable product (MVP) for research purposes, aims to incorporate sequencing into existing screening frameworks. The launch of Revvity EONIS Q system represents this trend, offering a faster and more streamlined approach to newborn molecular screening for conditions such as spinal muscular atrophy (SMA) and severe combined immunodeficiency (SCID). Neonatal screening guidelines continue to evolve, emphasizing the importance of follow-up testing procedures and quality assurance metrics.
- Blood spot analysis remains a crucial component of newborn screening, while immunodeficiency screening and endocrine disorders screening remain key areas of focus. Laboratory automation plays a vital role in ensuring efficiency and accuracy, enabling the timely identification and diagnosis of various disorders. Tandem mass spectrometry is another essential technology used in newborn screening, providing high-resolution and accurate mass measurements for biochemical analysis. Overall, these advancements aim to improve the early detection and diagnosis of genetic disorders, ultimately leading to better health outcomes for newborns.
What challenges does the Newborn Screening Industry face during its growth?
- Access to newborn screening programs is a significant challenge limiting the growth of the industry. This issue necessitates a formal and professional approach to ensure every newborn receives essential health screenings.
- The market is driven by the need for early detection and intervention of congenital disorders. Electrolyte imbalance and genetic conditions, such as phenylketonuria, can significantly impact patient outcomes if not identified and treated promptly. High-throughput screening methods using biochemical markers have revolutionized newborn screening, enabling the identification of multiple disorders in a single test. However, access to these screening programs remains a challenge, particularly for low-income families. Inadequate nutrition, maternal infections, and insufficient healthcare services contribute to a higher incidence of congenital disorders in these populations.
- The lack of comprehensive screening programs exacerbates the situation, leading to higher morbidity and mortality rates among affected infants. Early intervention programs, clinical decision support, and genetic testing methods are essential to improving patient outcomes and reducing the burden of congenital disorders.
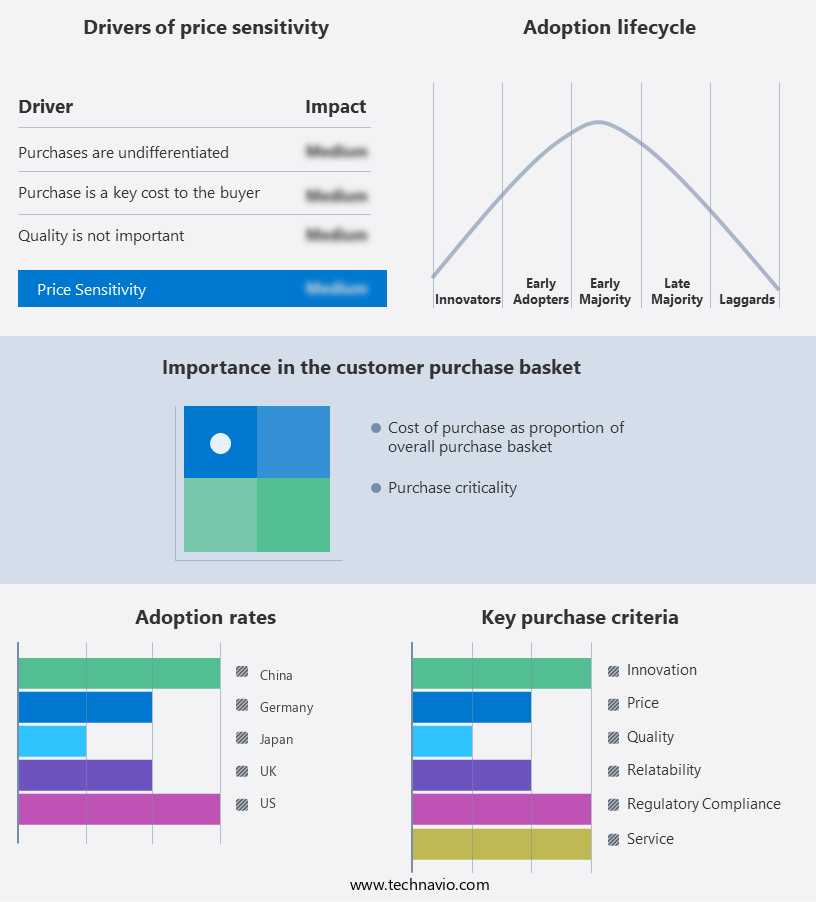
Exclusive Customer Landscape
The newborn screening market forecasting report includes the adoption lifecycle of the market, covering from the innovator’s stage to the laggard’s stage. It focuses on adoption rates in different regions based on penetration. Furthermore, the newborn screening market report also includes key purchase criteria and drivers of price sensitivity to help companies evaluate and develop their market growth analysis strategies.
Customer Landscape
Key Companies & Market Insights
Companies are implementing various strategies, such as strategic alliances, newborn screening market forecast, partnerships, mergers and acquisitions, geographical expansion, and product/service launches, to enhance their presence in the industry.
AB SCIEX LLC - This company specializes in newborn screening, utilizing advanced mass spectrometry technology for the early identification of metabolic disorders. Their innovative approach enhances diagnostic accuracy and improves health outcomes for infants.
The industry research and growth report includes detailed analyses of the competitive landscape of the market and information about key companies, including:
- AB SCIEX LLC
- Agilent Technologies Inc.
- Astra Biotech GmbH
- Baebies Inc.
- Bio Rad Laboratories Inc.
- GE Healthcare Technologies Inc.
- Masimo Corp.
- Medtronic Plc
- MP Biomedicals Inc.
- Natus Medical Inc.
- Novartis AG
- Perkin Elmer Inc.
- Revvity Inc.
- Thermo Fisher Scientific Inc.
- Trivitron Healthcare
- Tulip Diagnostics Pvt. Ltd.
- Waters Corp.
- ZenTech S.A.
Qualitative and quantitative analysis of companies has been conducted to help clients understand the wider business environment as well as the strengths and weaknesses of key industry players. Data is qualitatively analyzed to categorize companies as pure play, category-focused, industry-focused, and diversified; it is quantitatively analyzed to categorize companies as dominant, leading, strong, tentative, and weak.
Recent Development and News in Newborn Screening Market
- In January 2024, F.DA.P. Laboratories, a leading newborn screening solutions provider, announced the launch of its innovative SeqScreener NBS, a next-generation sequencing (NGS) based newborn screening test, expanding its product portfolio and addressing the growing demand for advanced genetic screening methods (F.DA.P. Laboratories Press Release).
- In March 2024, PerkinElmer, a global technology company, entered into a strategic partnership with the National Institute for Biotechnology Development (NIBD) in Suriname to establish a newborn screening center, aiming to improve access to early diagnosis and treatment for genetic disorders in the region (PerkinElmer Press Release).
- In May 2024, Bio-Rad Laboratories, a major diagnostics company, completed the acquisition of Seegene's newborn screening business, significantly expanding its presence in The market and adding Seegene's innovative multiplex PCR technology to its offerings (Bio-Rad Laboratories Press Release).
- In April 2025, the European Union approved the use of Illumina's NextGenSeq 500 System for newborn screening, marking a significant regulatory milestone and enabling the implementation of NGS technology in EU member states' newborn screening programs (Illumina Press Release).
Research Analyst Overview
- The market is characterized by a focus on enhancing diagnostic accuracy and ensuring regulatory compliance. Method comparison studies are crucial in evaluating the effectiveness of various screening methods, including immunological assays and enzyme activity assays. Health equity concerns persist, with efforts underway to address disparities in access to newborn screening and genetic counseling services. Cost-effectiveness analysis and health economic models are essential tools in determining the population health impact and screening program costs. Laboratory accreditation standards and healthcare provider training are key to maintaining diagnostic accuracy and ensuring data privacy concerns are addressed. Biomarker discovery and genetic mutation detection continue to drive innovation in the field, with test validation studies and quality control procedures ensuring sensitivity and specificity.
- Disease prevalence rates and data security measures are critical factors in disease incidence tracking and registry management. Ethics of screening and parental information materials are also important considerations in the newborn screening landscape.
Dive into Technavio’s robust research methodology, blending expert interviews, extensive data synthesis, and validated models for unparalleled Newborn Screening Market insights. See full methodology.
|
Market Scope |
|
|
Report Coverage |
Details |
|
Page number |
203 |
|
Base year |
2023 |
|
Historic period |
2018-2022 |
|
Forecast period |
2024-2028 |
|
Growth momentum & CAGR |
Accelerate at a CAGR of 8.2% |
|
Market growth 2024-2028 |
USD 434.9 million |
|
Market structure |
Fragmented |
|
YoY growth 2023-2024(%) |
7.9 |
|
Key countries |
US, China, Japan, Germany, UK, India, France, Canada, South Korea, and Spain |
|
Competitive landscape |
Leading Companies, Market Positioning of Companies, Competitive Strategies, and Industry Risks |
What are the Key Data Covered in this Newborn Screening Market Research and Growth Report?
- CAGR of the Newborn Screening industry during the forecast period
- Detailed information on factors that will drive the growth and forecasting between 2024 and 2028
- Precise estimation of the size of the market and its contribution of the industry in focus to the parent market
- Accurate predictions about upcoming growth and trends and changes in consumer behaviour
- Growth of the market across North America, Europe, Asia, and Rest of World (ROW)
- Thorough analysis of the market’s competitive landscape and detailed information about companies
- Comprehensive analysis of factors that will challenge the newborn screening market growth of industry companies
We can help! Our analysts can customize this newborn screening market research report to meet your requirements.
 RIA -
RIA - 
