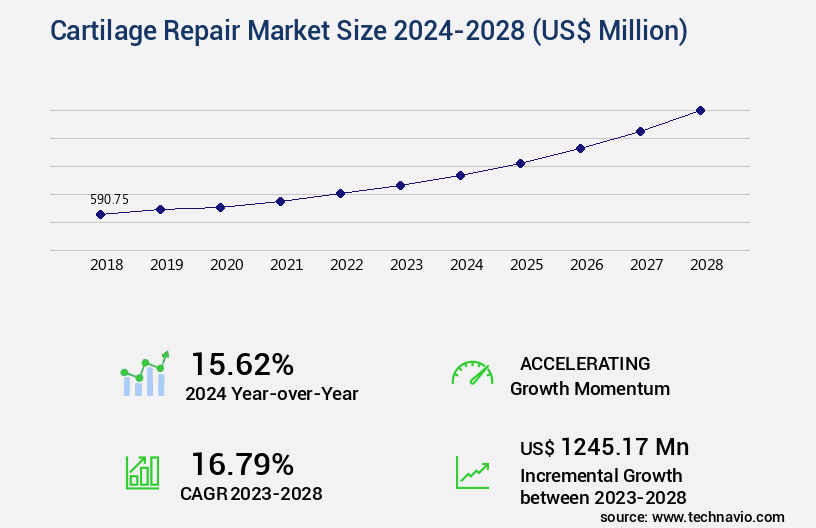
Cartilage Repair Market Size 2024-2028
The cartilage repair market size is valued to increase USD 1.25 billion, at a CAGR of 16.79% from 2023 to 2028. Increasing incidence of Osteoarthritis will drive the cartilage repair market.
Major Market Trends & Insights
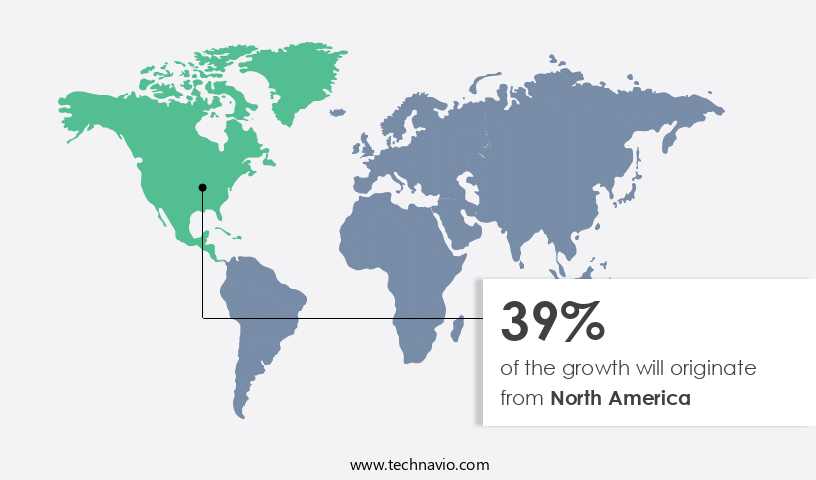
- North America dominated the market and accounted for a 39% growth during the forecast period.
- By Product - Cell-based segment was valued at USD 339.21 billion in 2022
- By End-user - Hospitals and clinics segment accounted for the largest market revenue share in 2022
Market Size & Forecast
- Market Opportunities: USD 290.49 million
- Market Future Opportunities: USD 1245.17 million
- CAGR : 16.79%
- North America: Largest market in 2022
Market Summary
- The market encompasses the development, production, and distribution of technologies, products, and services aimed at repairing or replacing damaged cartilage in various joints. This market is driven by the increasing incidence of osteoarthritis, a degenerative joint disease affecting millions worldwide. According to the Centers for Disease Control and Prevention (CDC), approximately 27 million Americans have osteoarthritis, making it the most common form of arthritis. Core technologies in the market include tissue engineering, autologous chondrocyte implantation, and matrix-induced autologous chondrocyte implantation. Applications span from articular cartilage repair in the knee, hip, and ankle joints to the repair of costal and nasal cartilage.
- Service types range from surgical procedures to regenerative therapies. Despite advancements, challenges persist, including the high cost of cartilage repair surgery and the need for long-term efficacy and safety data. However, public and private sector funding for clinical trials of cartilage repair technologies continues to grow, offering opportunities for market expansion and innovation. For instance, a recent study published in the Journal of Orthopaedic Research reported a 90% success rate for a novel cartilage repair technique using a 3D-printed scaffold. This underscores the evolving nature of the market and the potential for significant advancements in the future.
What will be the Size of the Cartilage Repair Market during the forecast period?
Get Key Insights on Market Forecast (PDF) Request Free Sample
How is the Cartilage Repair Market Segmented and what are the key trends of market segmentation?
The cartilage repair industry research report provides comprehensive data (region-wise segment analysis), with forecasts and estimates in "USD million" for the period 2024-2028, as well as historical data from 2018-2022 for the following segments.
- Product
- Cell-based
- Non-cell based
- End-user
- Hospitals and clinics
- ASCs
- Physicians office
- Application
- Hyaline Cartilage
- Fibrocartilage
- Application Site
- Knee
- Hip
- Ankle and Foot
- Spine
- Others
- Treatment Type
- Palliative
- Intrinsic Repair Stimulus
- Geography
- North America
- US
- Canada
- Europe
- Germany
- UK
- APAC
- China
- Rest of World (ROW)
- North America
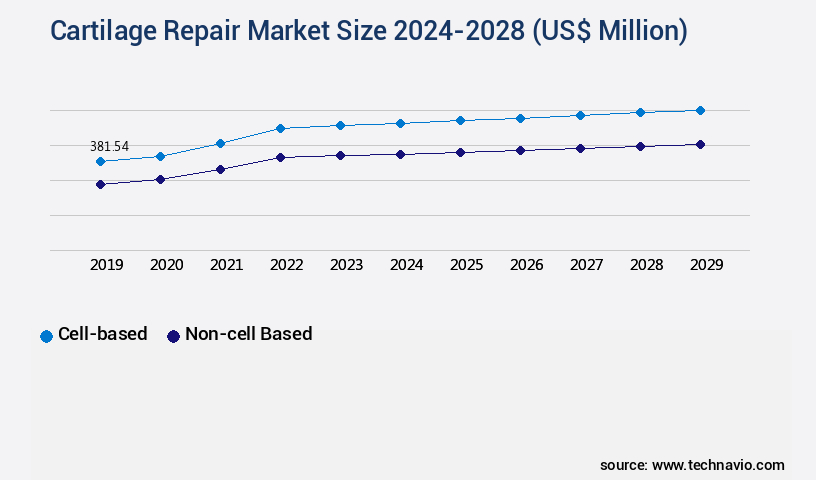
By Product Insights
The cell-based segment is estimated to witness significant growth during the forecast period.
In the realm of regenerative medicine, cartilage repair has emerged as a significant area of focus due to the high prevalence of articular cartilage defects. According to recent studies, approximately 2.5 million Americans experience symptoms of osteoarthritis, a condition often associated with cartilage damage. This number is projected to increase by 49% by 2030. Biomechanical testing plays a crucial role in assessing the efficacy of cartilage repair techniques. For instance, shear modulus testing helps evaluate the mechanical properties of repaired cartilage. Biomaterial scaffolds, such as hyaluronic acid and collagen-based materials, serve as essential tools in cartilage regeneration.
These scaffolds facilitate tissue integration and chondrocyte transplantation, enhancing the overall success of the repair process. Cell viability assays and patient-reported outcomes are essential indicators of treatment effectiveness. For instance, compressive strength testing and histological analysis provide valuable insights into the structural integrity of the repaired cartilage. Surgical techniques like arthroscopic cartilage repair, osteochondral allograft transplantation, and microfracture procedures have shown promising results. Functional outcomes assessment, including meniscus tear repair and rehabilitation protocols, are crucial components of the overall treatment process. Inflammation markers and synovial fluid analysis are essential in monitoring the healing process and identifying potential complications.
Hyaluronic acid injections and cell-based therapies, such as autologous chondrocyte implantation and chondrogenic differentiation, are increasingly popular treatment options. Tissue engineering approaches, including tissue integration and scaffold materials biocompatibility, are driving innovation in the field of cartilage repair. Growth factor stimulation and autologous chondrocyte implantation are some of the advanced techniques being explored to enhance the efficacy of cartilage repair. The global market for cartilage repair is expected to grow substantially, with an estimated 15% of the population in developed countries suffering from cartilage-related conditions. Additionally, the increasing prevalence of obesity and an aging population are further fueling the demand for cartilage repair solutions.
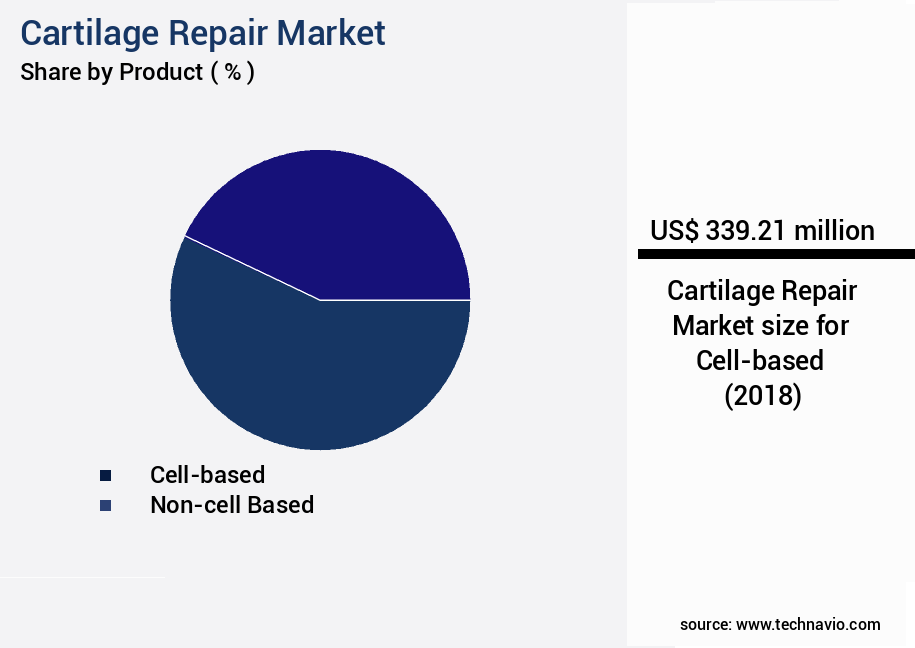
The Cell-based segment was valued at USD 339.21 billion in 2018 and showed a gradual increase during the forecast period.
Regional Analysis
North America is estimated to contribute 39% to the growth of the global market during the forecast period.Technavio's analysts have elaborately explained the regional trends and drivers that shape the market during the forecast period.
See How Cartilage Repair Market Demand is Rising in North America Request Free Sample
The market in North America is experiencing significant growth, with the United States and Canada being the major revenue contributors. This expansion is attributed to several factors, including the enhancement of healthcare infrastructure, an increasing number of orthopedic surgeries, and the rising prevalence of obesity and its associated risks. Moreover, the increasing awareness of Osteoarthritis and the favorable reimbursement for cartilage repair surgeries are further fueling market growth.
Additionally, initiatives by governments and non-profit organizations to create awareness about cartilage damage and its consequences are also contributing to the market's expansion. Furthermore, the growing number of hospitals and Ambulatory Surgery Centers (ASCs) is facilitating an increase in the number of cartilage repair procedures, thereby propelling the market forward.
Market Dynamics
Our researchers analyzed the data with 2023 as the base year, along with the key drivers, trends, and challenges. A holistic analysis of drivers will help companies refine their marketing strategies to gain a competitive advantage.
The market encompasses various treatments and technologies aimed at restoring articular cartilage damage, primarily in joints such as the knee. Autologous chondrocyte implantation (ACI) and matrix-induced autologous chondrocyte implantation (MACI) are two prominent techniques. ACI's efficacy in restoring damaged cartilage is well-established, but complications like donor site morbidity and chondrocyte dedifferentiation remain challenges. MACI, an improvement over ACI, utilizes a scaffold to facilitate chondrocyte attachment and integration, reducing complications. Hyaluronic acid injections, another treatment, offer short-term symptomatic relief for cartilage defects. Long-term results, however, are less promising due to the lack of tissue regeneration. Microfracture procedures, a minimally invasive technique, have shown success rates of up to 80%, but limitations include potential joint damage and limited applicability for large defects.
Osteochondral autograft transfer and osteochondral allograft transplantation are alternative options with rejection rates being a significant concern for the former and donor site availability for the latter. Biomaterial selection criteria, growth factor stimulation dosage optimization, and tissue engineering scaffold design parameters are crucial considerations in cartilage repair. Cell-based therapies, including mesenchymal stem cells, show promise due to their safety profile and potential for tissue regeneration. Biomaterial scaffold biodegradation rates and inflammatory response during tissue integration are essential factors in their development. Arthroscopic cartilage repair surgical techniques, such as arthroscopic drilling and abrasion arthroplasty, are increasingly popular due to their minimally invasive nature.
Classification systems for cartilage defects, cost-effectiveness, and MRI cartilage assessment image interpretation are essential for effective treatment planning. Biomechanical properties of cartilage, particularly age-related changes, and chondrogenic differentiation cell culture methods are critical areas of research in cartilage repair. Understanding the histological analysis cartilage scoring systems and biomechanical testing cartilage fatigue resistance is essential for assessing treatment efficacy and long-term outcomes. In comparison, the academic and industrial sectors invest significantly different resources into cartilage repair research. Over 70% of new product developments originate from the industrial sector, reflecting the growing commercial interest in this field.
What are the key market drivers leading to the rise in the adoption of Cartilage Repair Industry?
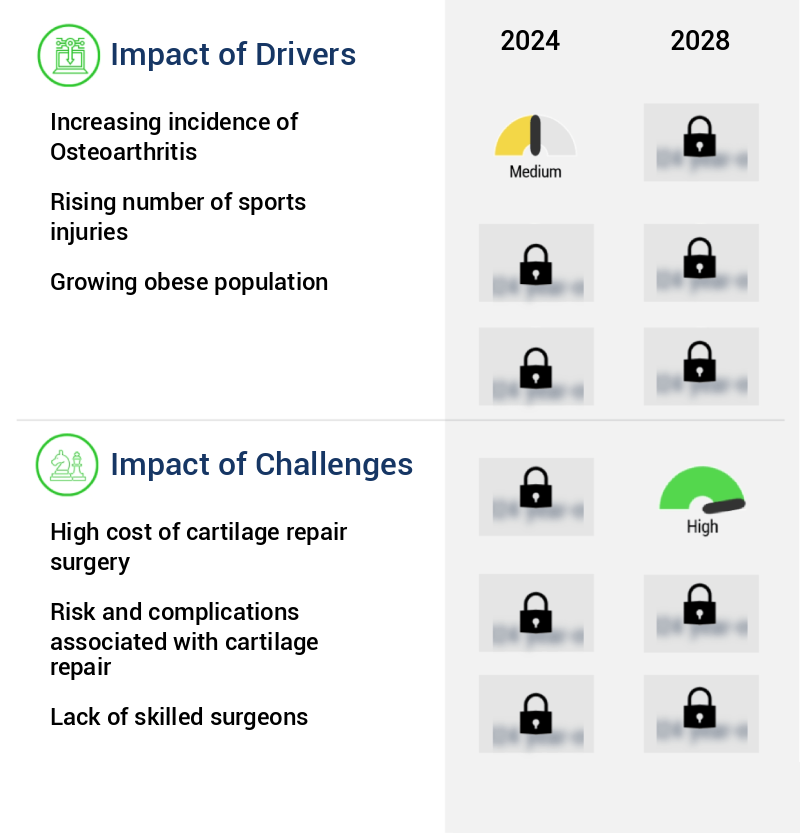
- The rising prevalence of osteoarthritis serves as the primary market driver, significantly contributing to its growth.
- Osteoarthritis, characterized by cartilage damage and resulting chondrocyte activation, protease expression, and growth factor release, affects over 10% of the global population. In the United States, the Centers for Disease Control and Prevention (CDC) reports that over 30 million adults currently live with this degenerative joint disorder. The escalating prevalence of Osteoarthritis is influenced by risk factors such as aging and obesity, which disrupt the balance between catabolic and anabolic activities in the joint, leading to cartilage degeneration. The global population's aging trend and the rising obesity rates in both developed and developing regions underscore the importance of ongoing research and innovation in managing Osteoarthritis.
- This includes the development of advanced therapies, such as stem cell treatments, and the exploration of novel diagnostic tools, like biomarker-based tests, to improve patient outcomes and quality of life.
What are the market trends shaping the Cartilage Repair Industry?
- In the realm of clinical trials for cartilage repair, both public and private sectors are increasingly investing significant funds. This emerging market trend underscores the growing importance of advancements in this field.
- The market experiences significant investment and growth, fueled by funding from various sources. The increasing prevalence of cartilage damage, driven by the rise in sports participation, aging population, and escalating incidence of arthritis and osteoporosis, necessitates innovative solutions. Numerous small companies and startups are securing financing for clinical trials. For example, Orthox Ltd., a clinical-stage company specializing in medical implants for repairing damaged knee articular cartilage, recently completed an additional USD4.3 million in its USD12.5 million Series A financing round in February 2022.
- This funding influx underscores the market's potential and the commitment to addressing the unmet medical needs in cartilage repair.
What challenges does the Cartilage Repair Industry face during its growth?
- The escalating costs associated with cartilage repair surgery pose a significant challenge and hinder the growth of the industry.
- The high cost of cartilage repair procedures poses a significant barrier to their widespread adoption in both developed and developing countries. In the US, the cost of cartilage repair surgery varies significantly, ranging from USD18,000 to USD23,000 on average. This cost can increase substantially depending on the type of surgery, hospitalization fees, additional procedures, and the country where the procedure is performed. Hospitals face limited bargaining power when purchasing cartilage repair products due to their relatively small quantity purchases from manufacturers.
- Furthermore, many healthcare facilities and company contracts include non-disclosure agreements regarding prices, preventing transparency and price comparison. Despite these challenges, ongoing research and development in the market continue to yield advancements, including the use of biomimetic scaffolds, tissue engineering, and stem cell therapies. These innovations offer potential cost savings and improved outcomes, making cartilage repair an evolving and dynamic market to watch.
Exclusive Technavio Analysis on Customer Landscape
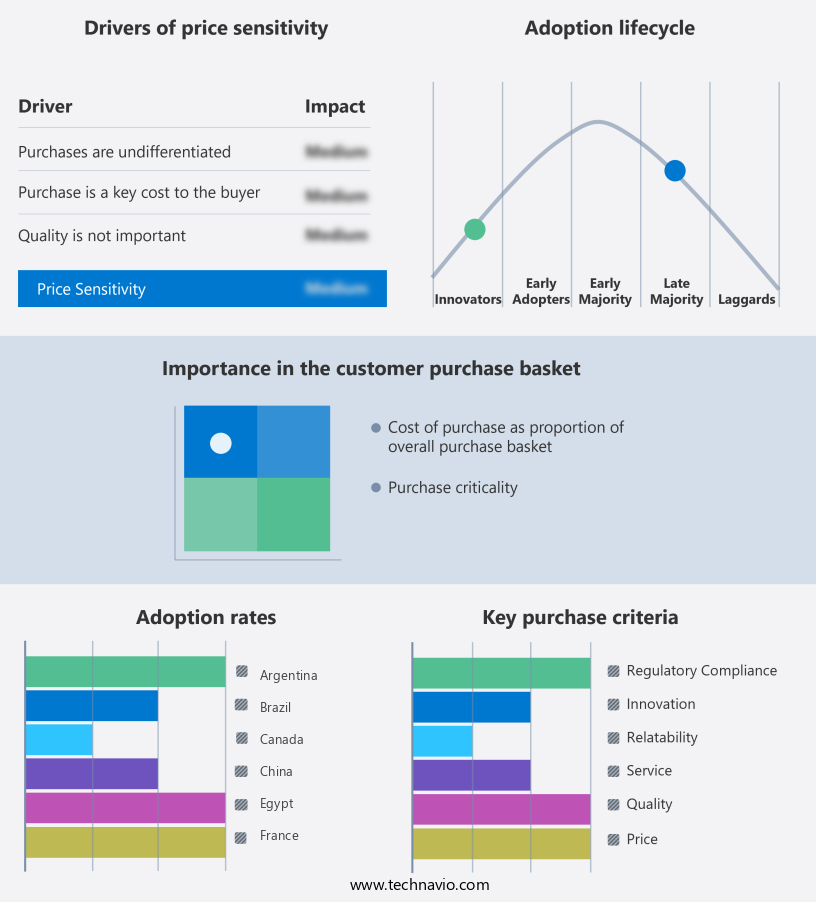
The cartilage repair market forecasting report includes the adoption lifecycle of the market, covering from the innovator's stage to the laggard's stage. It focuses on adoption rates in different regions based on penetration. Furthermore, the cartilage repair market report also includes key purchase criteria and drivers of price sensitivity to help companies evaluate and develop their market growth analysis strategies.
Customer Landscape of Cartilage Repair Industry
Competitive Landscape
Companies are implementing various strategies, such as strategic alliances, cartilage repair market forecast, partnerships, mergers and acquisitions, geographical expansion, and product/service launches, to enhance their presence in the industry.
3M Co. - This research focuses on Acelity, a subsidiary of a leading company, providing advanced cartilage repair solutions. Notably, their FISTULA device showcases innovative technology in addressing chronic wounds and fistulas.
The industry research and growth report includes detailed analyses of the competitive landscape of the market and information about key companies, including:
- 3M Co.
- AlloSource
- Arthrex Inc.
- B.Braun SE
- Bioventus LLC
- Geistlich Pharma AG
- Hy2Care
- Johnson and Johnson
- Medtronic Plc
- Orteq Sports Medicine Ltd.
- Orthox Ltd.
- Regentis Biomaterials Ltd.
- Rosens Diversified Inc.
- RTI Surgical Inc.
- Sartorius AG
- Smith and Nephew plc
- Stryker Corp.
- TissueTech Inc.
- Vericel Corp.
- Xintela AB
- Xtant Medical Holdings Inc.
- Zimmer Biomet Holdings Inc.
Qualitative and quantitative analysis of companies has been conducted to help clients understand the wider business environment as well as the strengths and weaknesses of key industry players. Data is qualitatively analyzed to categorize companies as pure play, category-focused, industry-focused, and diversified; it is quantitatively analyzed to categorize companies as dominant, leading, strong, tentative, and weak.
Recent Development and News in Cartilage Repair Market
- In January 2024, Tissue Regenix Group PLC, a leading regenerative medical products company, announced the receipt of CE Mark approval for its Novo-Cart IL product for the repair and regeneration of cartilage lesions in the knee. This marks a significant milestone in the market, expanding the company's product portfolio (Tissue Regenix Press Release, 2024).
- In March 2024, Medtronic plc, a global healthcare solutions company, entered into a strategic partnership with Arthrosurface, Inc., a leading cartilage repair and regeneration company. This collaboration aimed to integrate Arthrosurface's cartilage repair solutions into Medtronic's orthopedic portfolio, broadening their offerings and enhancing their market presence (Medtronic Press Release, 2024).
- In May 2024, Verallia, a leading glass packaging manufacturer, announced a €100 million investment in its Bordeaux, France, site to produce bioreactors for the production of cartilage tissue for regenerative medicine applications. This substantial investment underscores the growing demand and potential of the market (Verallia Press Release, 2024).
- In April 2025, FDA granted 510(k) clearance to Arthrex, Inc. For its new Osteocel MarrowMend Plus allograft, a cartilage repair product. This clearance expands Arthrex's product offerings and strengthens its position in the competitive the market (Arthrex Press Release, 2025).
Dive into Technavio's robust research methodology, blending expert interviews, extensive data synthesis, and validated models for unparalleled Cartilage Repair Market insights. See full methodology.
|
Market Scope |
|
|
Report Coverage |
Details |
|
Page number |
162 |
|
Base year |
2023 |
|
Historic period |
2018-2022 |
|
Forecast period |
2024-2028 |
|
Growth momentum & CAGR |
Accelerate at a CAGR of 16.79% |
|
Market growth 2024-2028 |
USD 1245.17 million |
|
Market structure |
Fragmented |
|
YoY growth 2023-2024(%) |
15.62 |
|
Key countries |
US, Canada, Germany, UK, and China |
|
Competitive landscape |
Leading Companies, Market Positioning of Companies, Competitive Strategies, and Industry Risks |
Research Analyst Overview
- The market is a dynamic and evolving field, driven by advancements in biomaterials, surgical techniques, and regenerative medicine. MRI cartilage assessment plays a crucial role in diagnosing articular cartilage defects, providing valuable information for the selection of appropriate treatment methods. Biomaterial scaffolds, such as collagen, hyaluronic acid, and polyglycolic acid, are increasingly used in cartilage regeneration techniques. Their biocompatibility and ability to mimic the native cartilage's biomechanical properties are essential for successful tissue integration. Biomechanical testing, including shear modulus and compressive strength assessments, helps evaluate the effectiveness of these scaffolds. Patient reported outcomes and histological analysis are essential in assessing the functional outcomes of cartilage repair procedures.
- Surgical techniques, including osteochondral autograft transfer, chondrocyte transplantation, and osteochondral allograft transplantation, continue to evolve, with a focus on minimally invasive arthroscopic procedures. Cell viability assays and inflammation marker analysis in synovial fluid are essential in evaluating the efficacy of cell-based therapies, such as chondrogenic differentiation and tissue engineering approaches. Growth factor stimulation and rehabilitation protocols are also crucial components of the cartilage repair process. Meniscus tear repair and microfracture procedures are common treatments for cartilage defects. The market is continually innovating, with ongoing research into new scaffold materials, surgical techniques, and regenerative medicine strategies.
- The focus is on improving patient outcomes and reducing the need for cartilage repair surgery. Comparative studies highlight the differences in adoption rates, market activity, and effectiveness of various cartilage repair techniques. These insights provide valuable information for healthcare professionals and patients alike, helping to guide decision-making in the treatment of articular cartilage defects.
What are the Key Data Covered in this Cartilage Repair Market Research and Growth Report?
-
What is the expected growth of the Cartilage Repair Market between 2024 and 2028?
-
USD 1.25 billion, at a CAGR of 16.79%
-
-
What segmentation does the market report cover?
-
The report is segmented by Product (Cell-based and Non-cell based), End-user (Hospitals and clinics, ASCs, and Physicians office), Geography (North America, Europe, Asia, and Rest of World (ROW)), Application (Hyaline Cartilage, Fibrocartilage, Hyaline Cartilage, and Fibrocartilage), Application Site (Knee, Hip, Ankle and Foot, Spine, Others, Knee, Hip, Ankle and Foot, Spine, and Others), and Treatment Type (Palliative, Intrinsic Repair Stimulus, Palliative, and Intrinsic Repair Stimulus)
-
-
Which regions are analyzed in the report?
-
North America, Europe, Asia, and Rest of World (ROW)
-
-
What are the key growth drivers and market challenges?
-
Increasing incidence of Osteoarthritis, High cost of cartilage repair surgery
-
-
Who are the major players in the Cartilage Repair Market?
-
3M Co., AlloSource, Arthrex Inc., B.Braun SE, Bioventus LLC, Geistlich Pharma AG, Hy2Care, Johnson and Johnson, Medtronic Plc, Orteq Sports Medicine Ltd., Orthox Ltd., Regentis Biomaterials Ltd., Rosens Diversified Inc., RTI Surgical Inc., Sartorius AG, Smith and Nephew plc, Stryker Corp., TissueTech Inc., Vericel Corp., Xintela AB, Xtant Medical Holdings Inc., and Zimmer Biomet Holdings Inc.
-
Market Research Insights
- The market encompasses innovative technologies and approaches aimed at addressing the structural degradation and functional loss of articular cartilage. Two significant areas of focus include gene therapy and bone marrow stimulation. According to industry estimates, the global gene therapy the market is projected to reach USD1.5 billion by 2026, growing at a compound annual growth rate (CAGR) of 12.5%. In contrast, the bone marrow stimulation segment is expected to expand at a CAGR of 9.2%, reaching USD1.2 billion by the same year. Patient satisfaction plays a crucial role in the success of cartilage repair interventions. Effective post-operative management, including physical therapy and proper cartilage tissue regeneration, contributes significantly to improved patient outcomes.
- Biological scaffolds, implant integration, and range of motion are essential factors in the long-term success of these procedures. Complications, such as chondrocyte apoptosis and inflammatory cytokines, can impact the efficacy of cartilage repair techniques. Advancements in surgical instrumentation, drug delivery systems, and image-guided surgery enable more precise and effective interventions, enhancing overall patient care.
We can help! Our analysts can customize this cartilage repair market research report to meet your requirements.
 RIA -
RIA - 
