Casino Market Analysis, Size, and Forecast 2026-2030: North America (US, Canada, and Mexico), APAC (China, India, and Australia), Europe (Italy, UK, and France), South America (Brazil and Argentina), Middle East and Africa (Turkey, South Africa, and UAE), and Rest of World (ROW)

Casino Market Analysis, Size, and Forecast 2026-2030:
North America (US, Canada, and Mexico), APAC (China, India, and Australia), Europe (Italy, UK, and France), South America (Brazil and Argentina), Middle East and Africa (Turkey, South Africa, and UAE), and Rest of World (ROW)

Published: Dec 2025 294 Pages SKU: IRTNTR72082

Market Overview at a Glance

$34.20 B
Market Opportunity
3.4%
CAGR 2025 - 2030
41.4%
North America Growth
$59.77 B
Poker segment 2024

Casino Market Size 2026-2030

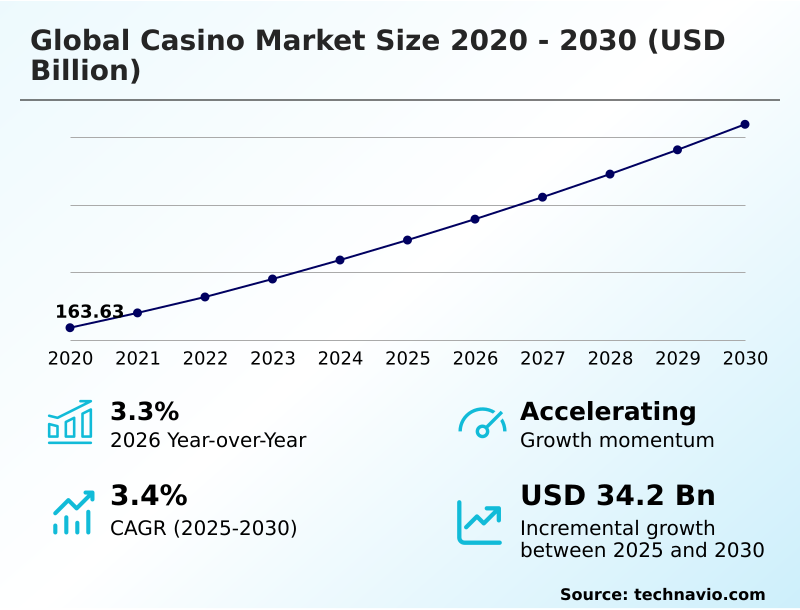
The casino market size is valued to increase by USD 34.20 billion, at a CAGR of 3.4% from 2025 to 2030. Expansion of regulated jurisdictions and licensing liberalization will drive the casino market.

Major Market Trends & Insights

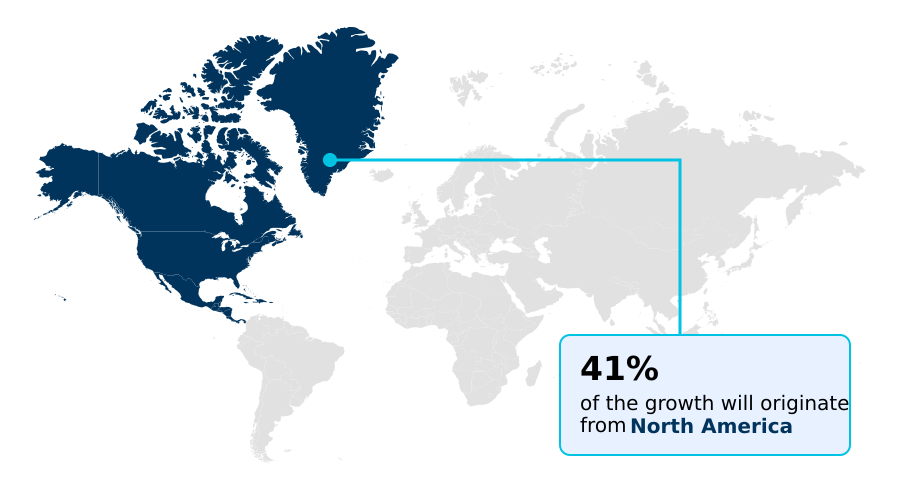
  • North America dominated the market and accounted for a 41.4% growth during the forecast period.
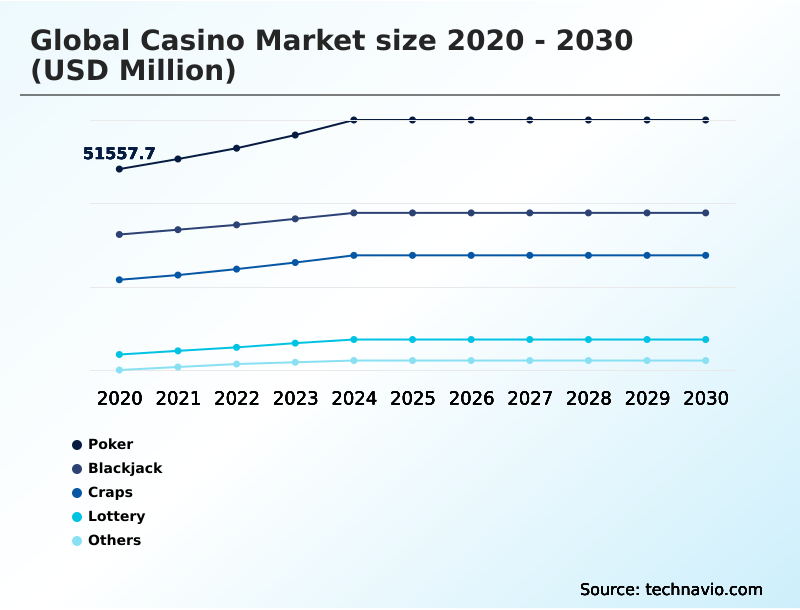
  • By Type - Poker segment was valued at USD 59.77 billion in 2024
  • By Product Type - Land-based casino segment accounted for the largest market revenue share in 2024

Market Size & Forecast

  • Market Opportunities: USD 60.10 billion
  • Market Future Opportunities: USD 34.20 billion
  • CAGR from 2025 to 2030 : 3.4%

Market Summary

  • The casino market is undergoing a significant transformation, moving beyond traditional gaming floors to embrace a holistic entertainment model. Central to this evolution is the integrated resort model, which combines high-end hospitality, MICE facilities, and retail with sophisticated gaming operations. This strategic shift is designed to capture diverse revenue streams and enhance customer retention strategies.
  • Technologically, the industry is driven by the adoption of omnichannel gaming platforms, enabling a seamless omnichannel player experience between land-based and iGaming platforms. The integration of cashless payment systems and biometric security measures is becoming standard, improving both operational efficiency and player security. For instance, operators are implementing predictive analytics to personalize marketing and promotions, which can improve cross-platform engagement.
  • However, the industry navigates a complex regulatory landscape, where obtaining a commercial gaming license and adhering to strict anti-money laundering (AML) protocols and KYC verification processes are paramount for sustainable operations in both established and emerging jurisdictions.

What will be the Size of the Casino Market during the forecast period?

Get Key Insights on Market Forecast (PDF) Request Free Sample

How is the Casino Market Segmented?

The casino industry research report provides comprehensive data (region-wise segment analysis), with forecasts and estimates in "USD million" for the period 2026-2030, as well as historical data from 2020-2024 for the following segments.

  • Type
    • Poker
    • Blackjack
    • Craps
    • Lottery
    • Others
  • Product type
    • Land-based casino
    • Online casino
  • End-user
    • Gambling enthusiasts
    • Dabblers
    • Lottery loyalists
    • Unengaged audience
  • Geography
    • North America
      • US
      • Canada
      • Mexico
    • APAC
      • China
      • India
      • Australia
    • Europe
      • Italy
      • UK
      • France
    • South America
      • Brazil
      • Argentina
    • Middle East and Africa
      • Turkey
      • South Africa
      • UAE
    • Rest of World (ROW)

By Type Insights

The poker segment is estimated to witness significant growth during the forecast period.

The poker segment is evolving through a sophisticated interplay between high-profile live tournaments and robust digital platforms. The market is defined by omnichannel strategies that leverage loyalty program integration to foster a unified player journey.

Operators utilize online satellite events, which contribute to over 35% of participants in major live tournaments, to funnel players toward premier land-based events. This synergistic model enhances brand loyalty and expands the player base beyond traditional enthusiasts.

A key focus is the use of responsible gaming tools and advanced player tracking systems to ensure a secure environment.

The segment's trajectory is shaped by a pivot toward experiential entertainment, combining the strategic elements of poker with the allure of destination resorts and their associated non-gaming amenities.

Request Free Sample

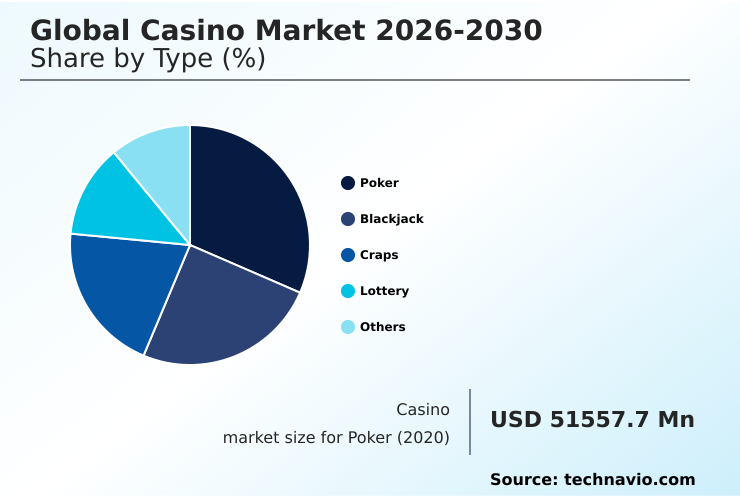
The Poker segment was valued at USD 59.77 billion in 2024 and showed a gradual increase during the forecast period.

Request Free Sample

Regional Analysis

North America is estimated to contribute 41.4% to the growth of the global market during the forecast period.Technavio’s analysts have elaborately explained the regional trends and drivers that shape the market during the forecast period.

See How Casino Market Demand is Rising in North America Request Free Sample

The geographic landscape is characterized by a dual dynamic: maturation in established regions and rapid expansion in emerging jurisdictions.

North America remains a dominant force, accounting for over 41% of market activity, driven by the expansion of online casino legalization and tribal gaming operations.

Meanwhile, APAC is the epicenter of new capital investment in integrated resort development, with projects in new markets projected to create a 200% increase in local employment within the first operational year.

The liberalization of licensing and regulation in previously untapped regions is creating high-value market entry strategy opportunities. Operators are focused on gaming floor optimization and sports betting operations to cater to regional preferences.

The Middle East and Africa, though smaller, represents a frontier for long-term economic diversification through luxury tourism and entertainment complex development.

Market Dynamics

Our researchers analyzed the data with 2025 as the base year, along with the key drivers, trends, and challenges. A holistic analysis of drivers will help companies refine their marketing strategies to gain a competitive advantage.

  • Strategic decision-making in the casino market is increasingly focused on future-proofing operations and enhancing player engagement. The impact of AI on player personalization is a central theme, as operators seek to create unique, tailored experiences. A parallel technological push involves exploring blockchain technology for transparent betting, which addresses consumer demand for fairness and security.
  • The role of VR in immersive casino experiences is being evaluated to attract new demographics, complementing the widespread cashless gaming adoption in land-based casinos. Core to business strategy are omnichannel strategies for customer retention, which are essential for bridging the physical and digital divide.
  • However, operators face significant headwinds, including managing AML compliance costs for online operators and navigating the regulatory challenges in online sports betting. The future of live dealer casino games depends on innovation to maintain engagement. Operationally, success hinges on integrating non-gaming revenue streams effectively and leveraging the impact of 5G on mobile casino gaming.
  • Cybersecurity threats in online casinos require constant vigilance, while the evolution of skill-based slot machines caters to a new generation of players. Firms leveraging big data for responsible gaming report a 15% lower rate of high-risk player incidents than those without such systems.
  • Looking ahead, the focus is on optimizing gaming floor layout with data, implementing robust mobile-first design for iGaming platforms, and merging loyalty programs across channels. The challenges of tribal vs commercial gaming and the complexity of the licensing process for new casino jurisdictions continue to shape expansion strategies.

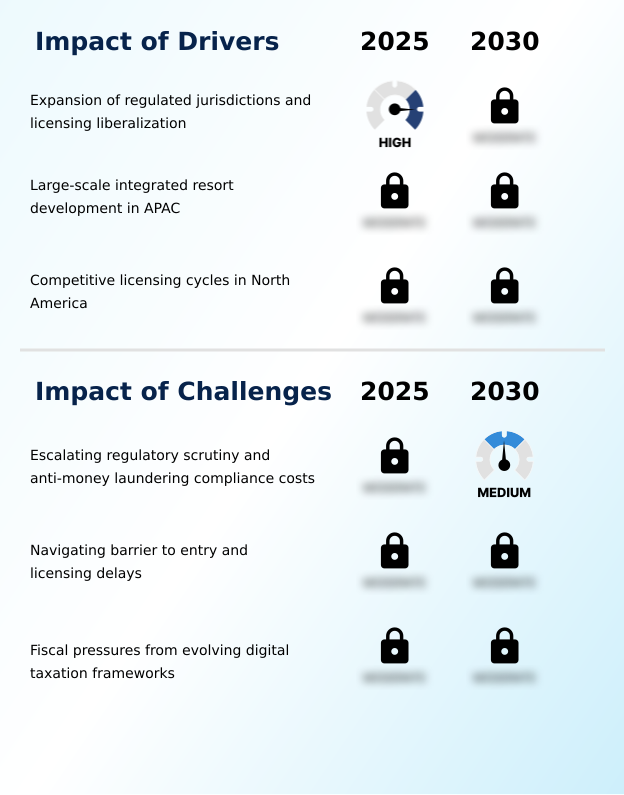
What are the key market drivers leading to the rise in the adoption of Casino Industry?

  • The expansion into newly regulated jurisdictions, facilitated by licensing liberalization, serves as a primary driver for market growth and investment.

  • Market growth is fundamentally driven by regulatory shifts and economic development goals. The primary driver is online casino legalization in new jurisdictions, a move that can increase a region's tax revenue generation by over 30% in the initial years.
  • This legislative momentum facilitates a clear market entry strategy for operators and fuels substantial capital investment in infrastructure. The pursuit of economic diversification is another key driver, with governments promoting entertainment complex development anchored by casinos to boost tourism.
  • This approach has been shown to increase international visitor arrivals by as much as 20%.
  • Consequently, the focus on integrated resort development, which combines gaming with extensive non-gaming amenities and sophisticated tourism and hospitality integration, continues to expand the industry's global footprint.

What are the market trends shaping the Casino Industry?

  • The acceleration of digital convergence, driven by artificial intelligence integration, is a defining market trend. This shift fosters seamless, personalized player experiences across both physical and online platforms.

  • Market trends are centered on technological convergence, with operators adopting an omnichannel player experience to unify physical and digital interactions. The integration of AI-driven predictive analytics is a key trend, allowing for deep customer segmentation that has been shown to improve the effectiveness of marketing campaigns by over 25%.
  • This leads to enhanced brand loyalty and higher player acquisition cost efficiency. The development of augmented reality casino and virtual reality gaming applications is creating new forms of experiential entertainment, attracting a younger demographic. These innovations are supported by a widespread digital wallet integration, which enhances transaction speed and security.
  • Adopting these advanced systems has reduced fraudulent transaction rates by up to 40% for early adopters.

What challenges does the Casino Industry face during its growth?

  • Escalating regulatory scrutiny and the associated high costs of anti-money laundering compliance represent a significant challenge impacting operational strategies and profitability.

  • The primary challenge facing the market is the increasingly stringent regulatory landscape, which heightens operational complexity and costs. Adherence to evolving cross-jurisdictional licensing and regulation mandates has increased compliance department budgets by an average of 30% for multinational operators.
  • The focus on player protection has led to the mandatory implementation of responsible gaming tools, which, while crucial, require significant investment in technology and personnel. Furthermore, the reliance on customer relationship management (CRM) systems to manage player data introduces significant cybersecurity risks.
  • A single data breach can lead to fines and reputational damage far exceeding the initial technology investment, making data security a critical operational hurdle.

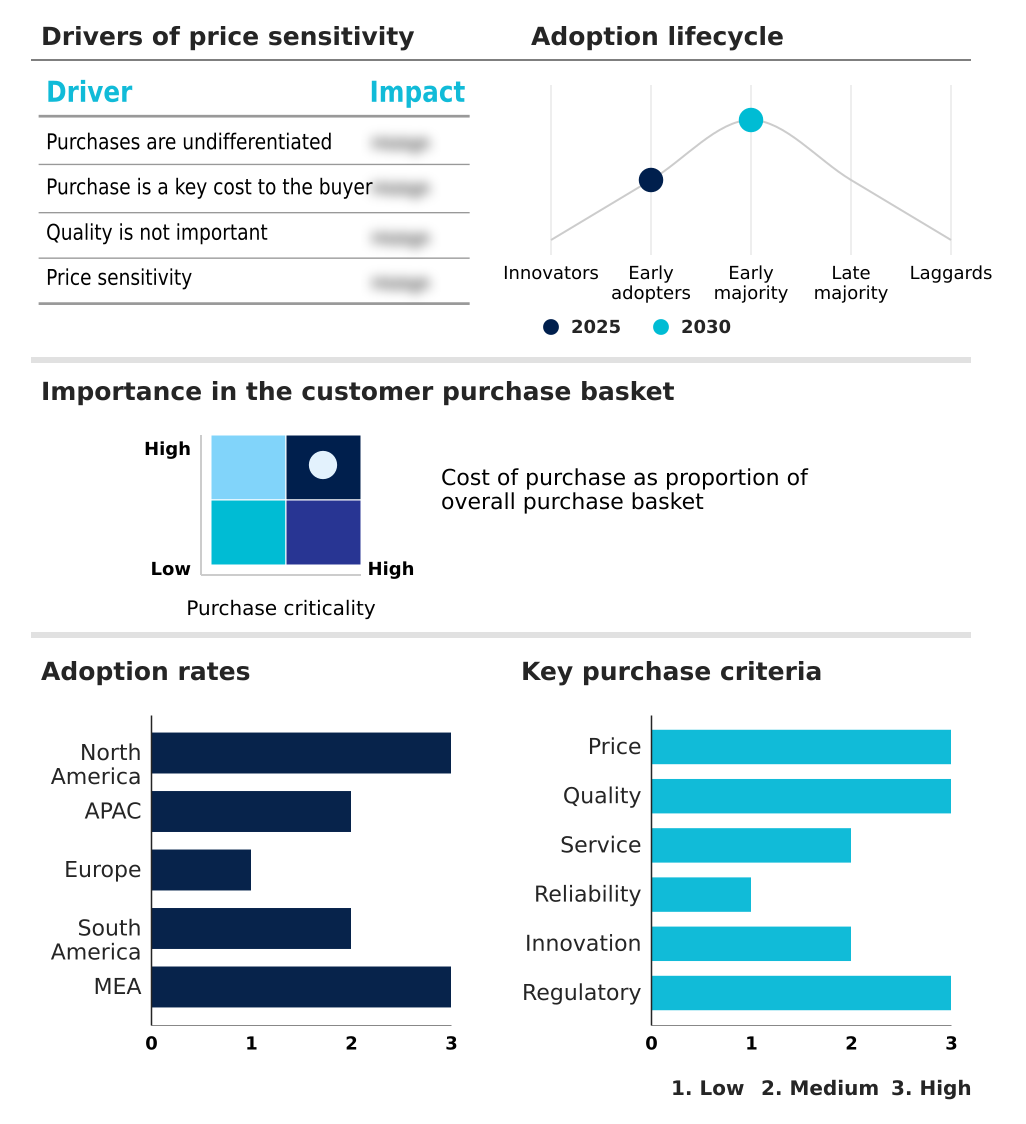
Exclusive Technavio Analysis on Customer Landscape

The casino market forecasting report includes the adoption lifecycle of the market, covering from the innovator’s stage to the laggard’s stage. It focuses on adoption rates in different regions based on penetration. Furthermore, the casino market report also includes key purchase criteria and drivers of price sensitivity to help companies evaluate and develop their market growth analysis strategies.

Customer Landscape of Casino Industry

Competitive Landscape

Companies are implementing various strategies, such as strategic alliances, casino market forecast, partnerships, mergers and acquisitions, geographical expansion, and product/service launches, to enhance their presence in the industry.

Ballys Corp. - Operations focus on delivering integrated casino resort experiences, combining premier gaming facilities with comprehensive hospitality services to drive customer engagement and loyalty.

The industry research and growth report includes detailed analyses of the competitive landscape of the market and information about key companies, including:

  • Ballys Corp.
  • Betsson Group
  • Caesars Entertainment Inc.
  • Casino Del Sol
  • Delta Corp.
  • Entain Plc
  • evoke plc
  • Evolution AB
  • Fantasy Springs Resort Casino
  • Flutter Entertainment Plc
  • Galaxy Entertainment Grp. Ltd.
  • Genting Berhad
  • Golden Entertainment Inc.
  • Las Vegas Sands Corp.
  • MGM Resorts International
  • PENN Entertainment Inc.
  • Rank Group PLC
  • SJM Holdings Ltd.
  • Station Casinos LLC

Qualitative and quantitative analysis of companies has been conducted to help clients understand the wider business environment as well as the strengths and weaknesses of key industry players. Data is qualitatively analyzed to categorize companies as pure play, category-focused, industry-focused, and diversified; it is quantitatively analyzed to categorize companies as dominant, leading, strong, tentative, and weak.

Recent Development and News in Casino market

  • In September 2024, Wynn Las Vegas entered a non-prosecution agreement and forfeited approximately $130 million to settle allegations related to unlicensed money transfer operations, highlighting increased regulatory enforcement.
  • In October 2024, the UAE's General Commercial Gaming Regulatory Authority issued the first commercial gaming license to Wynn Resorts for its Al Marjan Island project, marking the formal entry of the casino industry into the Middle East.
  • In January 2025, Thailand's Cabinet approved a parliamentary committee's study that recommended the legalization of casinos within large entertainment complexes, signaling a major policy shift in Southeast Asia.
  • In April 2025, the consortium led by MGM Resorts International and Orix Corporation officially began the main construction phase of the MGM Osaka integrated resort, a key development in Japan's emerging casino market.

Dive into Technavio’s robust research methodology, blending expert interviews, extensive data synthesis, and validated models for unparalleled Casino Market insights. See full methodology.

Market Scope
Page number 294
Base year 2025
Historic period 2020-2024
Forecast period 2026-2030
Growth momentum & CAGR Accelerate at a CAGR of 3.4%
Market growth 2026-2030 USD 34201.4 million
Market structure Fragmented
YoY growth 2025-2026(%) 3.3%
Key countries US, Canada, Mexico, China, India, Australia, South Korea, Japan, Indonesia, Italy, UK, France, Germany, Spain, The Netherlands, Brazil, Argentina, Chile, Turkey, South Africa, UAE, Israel and Saudi Arabia
Competitive landscape Leading Companies, Market Positioning of Companies, Competitive Strategies, and Industry Risks

Request Free Sample

Research Analyst Overview

  • The casino market is advancing through technological integration and strategic expansion, redefining the consumer entertainment landscape. The integrated resort model has become the industry standard, compelling boardroom decisions on significant capital investment into non-gaming revenue streams and MICE facilities to create destination resorts.
  • At the core of modern operations is the omnichannel gaming platform, which unifies player tracking systems and loyalty program integration across both land-based and iGaming platforms. This is enabled by a robust cloud-based gaming infrastructure supporting mobile-first innovations, sports betting operations, and live dealer platforms.
  • Security and compliance are paramount, with operators deploying biometric security measures, advanced video surveillance systems with RFID chip integration, and sophisticated regulatory compliance software to manage strict anti-money laundering (AML) protocols and KYC verification processes. The use of geofencing technology ensures jurisdictional adherence for online activities.
  • On the floor, the industry is transitioning with cashless payment systems, electronic gaming machines featuring certified random number generator (RNG) technology, and the introduction of table game automation and skill-based gaming. Operators are also addressing responsible gaming with tools for real-time problem gambling identification, which have been shown to reduce high-risk play by over 15%.
  • This holistic approach extends to managing both mass-market gaming and exclusive VIP gaming services within high-limit lounges, all managed through comprehensive casino management systems, while navigating the complexities of junket operations, tribal gaming operations, and securing a commercial gaming license.

What are the Key Data Covered in this Casino Market Research and Growth Report?

  • What is the expected growth of the Casino Market between 2026 and 2030?

    • USD 34.20 billion, at a CAGR of 3.4%

  • What segmentation does the market report cover?

    • The report is segmented by Type (Poker, Blackjack, Craps, Lottery, and Others), Product Type (Land-based casino, and Online casino), End-user (Gambling enthusiasts, Dabblers, Lottery loyalists, and Unengaged audience) and Geography (North America, APAC, Europe, South America, Middle East and Africa)

  • Which regions are analyzed in the report?

    • North America, APAC, Europe, South America and Middle East and Africa

  • What are the key growth drivers and market challenges?

    • Expansion of regulated jurisdictions and licensing liberalization, Escalating regulatory scrutiny and anti-money laundering compliance costs

  • Who are the major players in the Casino Market?

    • Ballys Corp., Betsson Group, Caesars Entertainment Inc., Casino Del Sol, Delta Corp., Entain Plc, evoke plc, Evolution AB, Fantasy Springs Resort Casino, Flutter Entertainment Plc, Galaxy Entertainment Grp. Ltd., Genting Berhad, Golden Entertainment Inc., Las Vegas Sands Corp., MGM Resorts International, PENN Entertainment Inc., Rank Group PLC, SJM Holdings Ltd. and Station Casinos LLC

Market Research Insights

  • The market's dynamics are increasingly shaped by sophisticated customer retention strategies and a focus on maximizing player lifetime value. Operators leveraging advanced customer segmentation and predictive analytics report improvements in marketing ROI by over 15%, tailoring offerings to specific player behaviors.
  • The drive for operational efficiency is compelling investment in technologies that streamline processes, with some properties achieving a 10% reduction in labor costs through automation. Furthermore, successful tourism and hospitality integration within a destination resort is directly correlated with higher non-gaming spend, with top-tier integrated resorts seeing non-gaming revenue contribute up to 60% of their total gross gaming revenue (GGR).
  • These data-driven approaches are fundamental to navigating the competitive landscape.

We can help! Our analysts can customize this casino market research report to meet your requirements.

Get in touch

1. Executive Summary

1.1 Market overview

Executive Summary - Chart on Market Overview
Executive Summary - Data Table on Market Overview
Executive Summary - Chart on Global Market Characteristics
Executive Summary - Chart on Market by Geography
Executive Summary - Chart on Market Segmentation by Type
Executive Summary - Chart on Market Segmentation by Product Type
Executive Summary - Chart on Market Segmentation by End-user
Executive Summary - Chart on Incremental Growth
Executive Summary - Data Table on Incremental Growth
Executive Summary - Chart on Company Market Positioning

2. Technavio Analysis

2.1 Analysis of price sensitivity, lifecycle, customer purchase basket, adoption rates, and purchase criteria

2.2 Criticality of inputs and Factors of differentiation

Chart on Overview on criticality of inputs and factors of differentiation

2.3 Factors of disruption

Chart on Overview on factors of disruption

2.4 Impact of drivers and challenges

Chart on Impact of drivers and challenges in 2025 and 2030

3. Market Landscape

3.1 Market ecosystem

Chart on Parent Market
Data Table on - Parent Market

3.2 Market characteristics

Chart on Market characteristics analysis

3.3 Value chain analysis

Chart on Value chain analysis

4. Market Sizing

4.1 Market definition

Data Table on Offerings of companies included in the market definition

4.2 Market segment analysis

Market segments

4.3 Market size 2025

4.4 Market outlook: Forecast for 2025-2030

Chart on Global - Market size and forecast 2025-2030 ($ million)
Data Table on Global - Market size and forecast 2025-2030 ($ million)
Chart on Global Market: Year-over-year growth 2025-2030 (%)
Data Table on Global Market: Year-over-year growth 2025-2030 (%)

5. Historic Market Size

5.1 Global Casino Market 2020 - 2024

Historic Market Size - Data Table on Global Casino Market 2020 - 2024 ($ million)

5.2 Type segment analysis 2020 - 2024

Historic Market Size - Type Segment 2020 - 2024 ($ million)

5.3 Product Type segment analysis 2020 - 2024

Historic Market Size - Product Type Segment 2020 - 2024 ($ million)

5.4 End-user segment analysis 2020 - 2024

Historic Market Size - End-user Segment 2020 - 2024 ($ million)

5.5 Geography segment analysis 2020 - 2024

Historic Market Size - Geography Segment 2020 - 2024 ($ million)

5.6 Country segment analysis 2020 - 2024

Historic Market Size - Country Segment 2020 - 2024 ($ million)

6. Qualitative Analysis

6.1 The AI impact on Global Casino Market

7. Five Forces Analysis

7.1 Five forces summary

Five forces analysis - Comparison between 2025 and 2030

7.2 Bargaining power of buyers

Bargaining power of buyers - Impact of key factors 2025 and 2030

7.3 Bargaining power of suppliers

Bargaining power of suppliers - Impact of key factors in 2025 and 2030

7.4 Threat of new entrants

Threat of new entrants - Impact of key factors in 2025 and 2030

7.5 Threat of substitutes

Threat of substitutes - Impact of key factors in 2025 and 2030

7.6 Threat of rivalry

Threat of rivalry - Impact of key factors in 2025 and 2030

7.7 Market condition

Chart on Market condition - Five forces 2025 and 2030

8. Market Segmentation by Type

8.1 Market segments

Chart on Type - Market share 2025-2030 (%)
Data Table on Type - Market share 2025-2030 (%)

8.2 Comparison by Type

Chart on Comparison by Type
Data Table on Comparison by Type

8.3 Poker - Market size and forecast 2025-2030

Chart on Poker - Market size and forecast 2025-2030 ($ million)
Data Table on Poker - Market size and forecast 2025-2030 ($ million)
Chart on Poker - Year-over-year growth 2025-2030 (%)
Data Table on Poker - Year-over-year growth 2025-2030 (%)

8.4 Blackjack - Market size and forecast 2025-2030

Chart on Blackjack - Market size and forecast 2025-2030 ($ million)
Data Table on Blackjack - Market size and forecast 2025-2030 ($ million)
Chart on Blackjack - Year-over-year growth 2025-2030 (%)
Data Table on Blackjack - Year-over-year growth 2025-2030 (%)

8.5 Craps - Market size and forecast 2025-2030

Chart on Craps - Market size and forecast 2025-2030 ($ million)
Data Table on Craps - Market size and forecast 2025-2030 ($ million)
Chart on Craps - Year-over-year growth 2025-2030 (%)
Data Table on Craps - Year-over-year growth 2025-2030 (%)

8.6 Lottery - Market size and forecast 2025-2030

Chart on Lottery - Market size and forecast 2025-2030 ($ million)
Data Table on Lottery - Market size and forecast 2025-2030 ($ million)
Chart on Lottery - Year-over-year growth 2025-2030 (%)
Data Table on Lottery - Year-over-year growth 2025-2030 (%)

8.7 Others - Market size and forecast 2025-2030

Chart on Others - Market size and forecast 2025-2030 ($ million)
Data Table on Others - Market size and forecast 2025-2030 ($ million)
Chart on Others - Year-over-year growth 2025-2030 (%)
Data Table on Others - Year-over-year growth 2025-2030 (%)

8.8 Market opportunity by Type

Market opportunity by Type ($ million)
Data Table on Market opportunity by Type ($ million)

9. Market Segmentation by Product Type

9.1 Market segments

Chart on Product Type - Market share 2025-2030 (%)
Data Table on Product Type - Market share 2025-2030 (%)

9.2 Comparison by Product Type

Chart on Comparison by Product Type
Data Table on Comparison by Product Type

9.3 Land-based casino - Market size and forecast 2025-2030

Chart on Land-based casino - Market size and forecast 2025-2030 ($ million)
Data Table on Land-based casino - Market size and forecast 2025-2030 ($ million)
Chart on Land-based casino - Year-over-year growth 2025-2030 (%)
Data Table on Land-based casino - Year-over-year growth 2025-2030 (%)

9.4 Online casino - Market size and forecast 2025-2030

Chart on Online casino - Market size and forecast 2025-2030 ($ million)
Data Table on Online casino - Market size and forecast 2025-2030 ($ million)
Chart on Online casino - Year-over-year growth 2025-2030 (%)
Data Table on Online casino - Year-over-year growth 2025-2030 (%)

9.5 Market opportunity by Product Type

Market opportunity by Product Type ($ million)
Data Table on Market opportunity by Product Type ($ million)

10. Market Segmentation by End-user

10.1 Market segments

Chart on End-user - Market share 2025-2030 (%)
Data Table on End-user - Market share 2025-2030 (%)

10.2 Comparison by End-user

Chart on Comparison by End-user
Data Table on Comparison by End-user

10.3 Gambling enthusiasts - Market size and forecast 2025-2030

Chart on Gambling enthusiasts - Market size and forecast 2025-2030 ($ million)
Data Table on Gambling enthusiasts - Market size and forecast 2025-2030 ($ million)
Chart on Gambling enthusiasts - Year-over-year growth 2025-2030 (%)
Data Table on Gambling enthusiasts - Year-over-year growth 2025-2030 (%)

10.4 Dabblers - Market size and forecast 2025-2030

Chart on Dabblers - Market size and forecast 2025-2030 ($ million)
Data Table on Dabblers - Market size and forecast 2025-2030 ($ million)
Chart on Dabblers - Year-over-year growth 2025-2030 (%)
Data Table on Dabblers - Year-over-year growth 2025-2030 (%)

10.5 Lottery loyalists - Market size and forecast 2025-2030

Chart on Lottery loyalists - Market size and forecast 2025-2030 ($ million)
Data Table on Lottery loyalists - Market size and forecast 2025-2030 ($ million)
Chart on Lottery loyalists - Year-over-year growth 2025-2030 (%)
Data Table on Lottery loyalists - Year-over-year growth 2025-2030 (%)

10.6 Unengaged audience - Market size and forecast 2025-2030

Chart on Unengaged audience - Market size and forecast 2025-2030 ($ million)
Data Table on Unengaged audience - Market size and forecast 2025-2030 ($ million)
Chart on Unengaged audience - Year-over-year growth 2025-2030 (%)
Data Table on Unengaged audience - Year-over-year growth 2025-2030 (%)

10.7 Market opportunity by End-user

Market opportunity by End-user ($ million)
Data Table on Market opportunity by End-user ($ million)

11. Customer Landscape

11.1 Customer landscape overview

Analysis of price sensitivity, lifecycle, customer purchase basket, adoption rates, and purchase criteria

12. Geographic Landscape

12.1 Geographic segmentation

Chart on Market share by geography 2025-2030 (%)
Data Table on Market share by geography 2025-2030 (%)

12.2 Geographic comparison

Chart on Geographic comparison
Data Table on Geographic comparison

12.3 North America - Market size and forecast 2025-2030

Chart on North America - Market size and forecast 2025-2030 ($ million)
Data Table on North America - Market size and forecast 2025-2030 ($ million)
Chart on North America - Year-over-year growth 2025-2030 (%)
Data Table on North America - Year-over-year growth 2025-2030 (%)
Chart on Regional Comparison - North America
Data Table on Regional Comparison - North America

12.3.1 US - Market size and forecast 2025-2030

Chart on US - Market size and forecast 2025-2030 ($ million)
Data Table on US - Market size and forecast 2025-2030 ($ million)
Chart on US - Year-over-year growth 2025-2030 (%)
Data Table on US - Year-over-year growth 2025-2030 (%)

12.3.2 Canada - Market size and forecast 2025-2030

Chart on Canada - Market size and forecast 2025-2030 ($ million)
Data Table on Canada - Market size and forecast 2025-2030 ($ million)
Chart on Canada - Year-over-year growth 2025-2030 (%)
Data Table on Canada - Year-over-year growth 2025-2030 (%)

12.3.3 Mexico - Market size and forecast 2025-2030

Chart on Mexico - Market size and forecast 2025-2030 ($ million)
Data Table on Mexico - Market size and forecast 2025-2030 ($ million)
Chart on Mexico - Year-over-year growth 2025-2030 (%)
Data Table on Mexico - Year-over-year growth 2025-2030 (%)

12.4 APAC - Market size and forecast 2025-2030

Chart on APAC - Market size and forecast 2025-2030 ($ million)
Data Table on APAC - Market size and forecast 2025-2030 ($ million)
Chart on APAC - Year-over-year growth 2025-2030 (%)
Data Table on APAC - Year-over-year growth 2025-2030 (%)
Chart on Regional Comparison - APAC
Data Table on Regional Comparison - APAC

12.4.1 China - Market size and forecast 2025-2030

Chart on China - Market size and forecast 2025-2030 ($ million)
Data Table on China - Market size and forecast 2025-2030 ($ million)
Chart on China - Year-over-year growth 2025-2030 (%)
Data Table on China - Year-over-year growth 2025-2030 (%)

12.4.2 India - Market size and forecast 2025-2030

Chart on India - Market size and forecast 2025-2030 ($ million)
Data Table on India - Market size and forecast 2025-2030 ($ million)
Chart on India - Year-over-year growth 2025-2030 (%)
Data Table on India - Year-over-year growth 2025-2030 (%)

12.4.3 Australia - Market size and forecast 2025-2030

Chart on Australia - Market size and forecast 2025-2030 ($ million)
Data Table on Australia - Market size and forecast 2025-2030 ($ million)
Chart on Australia - Year-over-year growth 2025-2030 (%)
Data Table on Australia - Year-over-year growth 2025-2030 (%)

12.4.4 South Korea - Market size and forecast 2025-2030

Chart on South Korea - Market size and forecast 2025-2030 ($ million)
Data Table on South Korea - Market size and forecast 2025-2030 ($ million)
Chart on South Korea - Year-over-year growth 2025-2030 (%)
Data Table on South Korea - Year-over-year growth 2025-2030 (%)

12.4.5 Japan - Market size and forecast 2025-2030

Chart on Japan - Market size and forecast 2025-2030 ($ million)
Data Table on Japan - Market size and forecast 2025-2030 ($ million)
Chart on Japan - Year-over-year growth 2025-2030 (%)
Data Table on Japan - Year-over-year growth 2025-2030 (%)

12.4.6 Indonesia - Market size and forecast 2025-2030

Chart on Indonesia - Market size and forecast 2025-2030 ($ million)
Data Table on Indonesia - Market size and forecast 2025-2030 ($ million)
Chart on Indonesia - Year-over-year growth 2025-2030 (%)
Data Table on Indonesia - Year-over-year growth 2025-2030 (%)

12.5 Europe - Market size and forecast 2025-2030

Chart on Europe - Market size and forecast 2025-2030 ($ million)
Data Table on Europe - Market size and forecast 2025-2030 ($ million)
Chart on Europe - Year-over-year growth 2025-2030 (%)
Data Table on Europe - Year-over-year growth 2025-2030 (%)
Chart on Regional Comparison - Europe
Data Table on Regional Comparison - Europe

12.5.1 Italy - Market size and forecast 2025-2030

Chart on Italy - Market size and forecast 2025-2030 ($ million)
Data Table on Italy - Market size and forecast 2025-2030 ($ million)
Chart on Italy - Year-over-year growth 2025-2030 (%)
Data Table on Italy - Year-over-year growth 2025-2030 (%)

12.5.2 UK - Market size and forecast 2025-2030

Chart on UK - Market size and forecast 2025-2030 ($ million)
Data Table on UK - Market size and forecast 2025-2030 ($ million)
Chart on UK - Year-over-year growth 2025-2030 (%)
Data Table on UK - Year-over-year growth 2025-2030 (%)

12.5.3 France - Market size and forecast 2025-2030

Chart on France - Market size and forecast 2025-2030 ($ million)
Data Table on France - Market size and forecast 2025-2030 ($ million)
Chart on France - Year-over-year growth 2025-2030 (%)
Data Table on France - Year-over-year growth 2025-2030 (%)

12.5.4 Germany - Market size and forecast 2025-2030

Chart on Germany - Market size and forecast 2025-2030 ($ million)
Data Table on Germany - Market size and forecast 2025-2030 ($ million)
Chart on Germany - Year-over-year growth 2025-2030 (%)
Data Table on Germany - Year-over-year growth 2025-2030 (%)

12.5.5 Spain - Market size and forecast 2025-2030

Chart on Spain - Market size and forecast 2025-2030 ($ million)
Data Table on Spain - Market size and forecast 2025-2030 ($ million)
Chart on Spain - Year-over-year growth 2025-2030 (%)
Data Table on Spain - Year-over-year growth 2025-2030 (%)

12.5.6 The Netherlands - Market size and forecast 2025-2030

Chart on The Netherlands - Market size and forecast 2025-2030 ($ million)
Data Table on The Netherlands - Market size and forecast 2025-2030 ($ million)
Chart on The Netherlands - Year-over-year growth 2025-2030 (%)
Data Table on The Netherlands - Year-over-year growth 2025-2030 (%)

12.6 South America - Market size and forecast 2025-2030

Chart on South America - Market size and forecast 2025-2030 ($ million)
Data Table on South America - Market size and forecast 2025-2030 ($ million)
Chart on South America - Year-over-year growth 2025-2030 (%)
Data Table on South America - Year-over-year growth 2025-2030 (%)
Chart on Regional Comparison - South America
Data Table on Regional Comparison - South America

12.6.1 Brazil - Market size and forecast 2025-2030

Chart on Brazil - Market size and forecast 2025-2030 ($ million)
Data Table on Brazil - Market size and forecast 2025-2030 ($ million)
Chart on Brazil - Year-over-year growth 2025-2030 (%)
Data Table on Brazil - Year-over-year growth 2025-2030 (%)

12.6.2 Argentina - Market size and forecast 2025-2030

Chart on Argentina - Market size and forecast 2025-2030 ($ million)
Data Table on Argentina - Market size and forecast 2025-2030 ($ million)
Chart on Argentina - Year-over-year growth 2025-2030 (%)
Data Table on Argentina - Year-over-year growth 2025-2030 (%)

12.6.3 Chile - Market size and forecast 2025-2030

Chart on Chile - Market size and forecast 2025-2030 ($ million)
Data Table on Chile - Market size and forecast 2025-2030 ($ million)
Chart on Chile - Year-over-year growth 2025-2030 (%)
Data Table on Chile - Year-over-year growth 2025-2030 (%)

12.7 Middle East and Africa - Market size and forecast 2025-2030

Chart on Middle East and Africa - Market size and forecast 2025-2030 ($ million)
Data Table on Middle East and Africa - Market size and forecast 2025-2030 ($ million)
Chart on Middle East and Africa - Year-over-year growth 2025-2030 (%)
Data Table on Middle East and Africa - Year-over-year growth 2025-2030 (%)
Chart on Regional Comparison - Middle East and Africa
Data Table on Regional Comparison - Middle East and Africa

12.7.1 Turkey - Market size and forecast 2025-2030

Chart on Turkey - Market size and forecast 2025-2030 ($ million)
Data Table on Turkey - Market size and forecast 2025-2030 ($ million)
Chart on Turkey - Year-over-year growth 2025-2030 (%)
Data Table on Turkey - Year-over-year growth 2025-2030 (%)

12.7.2 South Africa - Market size and forecast 2025-2030

Chart on South Africa - Market size and forecast 2025-2030 ($ million)
Data Table on South Africa - Market size and forecast 2025-2030 ($ million)
Chart on South Africa - Year-over-year growth 2025-2030 (%)
Data Table on South Africa - Year-over-year growth 2025-2030 (%)

12.7.3 UAE - Market size and forecast 2025-2030

Chart on UAE - Market size and forecast 2025-2030 ($ million)
Data Table on UAE - Market size and forecast 2025-2030 ($ million)
Chart on UAE - Year-over-year growth 2025-2030 (%)
Data Table on UAE - Year-over-year growth 2025-2030 (%)

12.7.4 Israel - Market size and forecast 2025-2030

Chart on Israel - Market size and forecast 2025-2030 ($ million)
Data Table on Israel - Market size and forecast 2025-2030 ($ million)
Chart on Israel - Year-over-year growth 2025-2030 (%)
Data Table on Israel - Year-over-year growth 2025-2030 (%)

12.7.5 Saudi Arabia - Market size and forecast 2025-2030

Chart on Saudi Arabia - Market size and forecast 2025-2030 ($ million)
Data Table on Saudi Arabia - Market size and forecast 2025-2030 ($ million)
Chart on Saudi Arabia - Year-over-year growth 2025-2030 (%)
Data Table on Saudi Arabia - Year-over-year growth 2025-2030 (%)

12.8 Market opportunity by geography

Market opportunity by geography ($ million)
Data Tables on Market opportunity by geography ($ million)

13. Drivers, Challenges, and Opportunity

13.1 Market drivers

Expansion of regulated jurisdictions and licensing liberalization
Large-scale integrated resort development in APAC
Competitive licensing cycles in North America

13.2 Market challenges

Escalating regulatory scrutiny and anti-money laundering compliance costs
Navigating barrier to entry and licensing delays
Fiscal pressures from evolving digital taxation frameworks

13.3 Impact of drivers and challenges

Impact of drivers and challenges in 2025 and 2030

13.4 Market opportunities

Acceleration of digital convergence and AI integration
Regulatory liberalization and expansion in emerging markets
Evolution of integrated resort model and experience economy

14. Competitive Landscape

14.1 Overview

14.2

Overview on criticality of inputs and factors of differentiation

14.3 Landscape disruption

Overview on factors of disruption

14.4 Industry risks

Impact of key risks on business

15. Competitive Analysis

15.1 Companies profiled

Companies covered

15.2 Company ranking index

15.3 Market positioning of companies

Matrix on companies position and classification

15.4 Ballys Corp.

Ballys Corp. - Overview
Ballys Corp. - Business segments
Ballys Corp. - Key offerings
Ballys Corp. - Segment focus
SWOT

15.5 Betsson Group

Betsson Group - Overview
Betsson Group - Product / Service
Betsson Group - Key offerings
SWOT

15.6 Caesars Entertainment Inc.

Caesars Entertainment Inc. - Overview
Caesars Entertainment Inc. - Business segments
Caesars Entertainment Inc. - Key offerings
Caesars Entertainment Inc. - Segment focus
SWOT

15.7 Entain Plc

Entain Plc - Overview
Entain Plc - Business segments
Entain Plc - Key offerings
Entain Plc - Segment focus
SWOT

15.8 evoke plc

evoke plc - Overview
evoke plc - Business segments
evoke plc - Key offerings
evoke plc - Segment focus
SWOT

15.9 Evolution AB

Evolution AB - Overview
Evolution AB - Product / Service
Evolution AB - Key offerings
SWOT

15.10 Flutter Entertainment Plc

Flutter Entertainment Plc - Overview
Flutter Entertainment Plc - Business segments
Flutter Entertainment Plc - Key offerings
Flutter Entertainment Plc - Segment focus
SWOT

15.11 Galaxy Entertainment Grp. Ltd.

Galaxy Entertainment Grp. Ltd. - Overview
Galaxy Entertainment Grp. Ltd. - Product / Service
Galaxy Entertainment Grp. Ltd. - Key offerings
SWOT

15.12 Genting Berhad

Genting Berhad - Overview
Genting Berhad - Product / Service
Genting Berhad - Key offerings
SWOT

15.13 Golden Entertainment Inc.

Golden Entertainment Inc. - Overview
Golden Entertainment Inc. - Business segments
Golden Entertainment Inc. - Key offerings
Golden Entertainment Inc. - Segment focus
SWOT

15.14 Las Vegas Sands Corp.

Las Vegas Sands Corp. - Overview
Las Vegas Sands Corp. - Business segments
Las Vegas Sands Corp. - Key offerings
Las Vegas Sands Corp. - Segment focus
SWOT

15.15 MGM Resorts International

MGM Resorts International - Overview
MGM Resorts International - Business segments
MGM Resorts International - Key offerings
MGM Resorts International - Segment focus
SWOT

15.16 PENN Entertainment Inc.

PENN Entertainment Inc. - Overview
PENN Entertainment Inc. - Business segments
PENN Entertainment Inc. - Key offerings
PENN Entertainment Inc. - Segment focus
SWOT

15.17 Rank Group PLC

Rank Group PLC - Overview
Rank Group PLC - Product / Service
Rank Group PLC - Key offerings
SWOT

15.18 SJM Holdings Ltd.

SJM Holdings Ltd. - Overview
SJM Holdings Ltd. - Business segments
SJM Holdings Ltd. - Key offerings
SJM Holdings Ltd. - Segment focus
SWOT

16. Appendix

16.1 Scope of the report

Market definition
Objectives
Notes and caveats

16.2 Inclusions and exclusions checklist

Inclusions checklist
Exclusions checklist

16.3 Currency conversion rates for US$

16.4 Research methodology

16.5 Data procurement

Information sources

16.6 Data validation

16.7 Validation techniques employed for market sizing

16.8 Data synthesis

16.9 360 degree market analysis

16.10 List of abbreviations

Research Methodology

Technavio presents a detailed picture of the market by way of study, synthesis, and summation of data from multiple sources. The analysts have presented the various facets of the market with a particular focus on identifying the key industry influencers. The data thus presented is comprehensive, reliable, and the result of extensive research, both primary and secondary.

INFORMATION SOURCES

Primary sources

  • Manufacturers and suppliers
  • Channel partners
  • Industry experts
  • Strategic decision makers

Secondary sources

  • Industry journals and periodicals
  • Government data
  • Financial reports of key industry players
  • Historical data
  • Press releases

DATA ANALYSIS

Data Synthesis

  • Collation of data
  • Estimation of key figures
  • Analysis of derived insights

Data Validation

  • Triangulation with data models
  • Reference against proprietary databases
  • Corroboration with industry experts

REPORT WRITING

Qualitative

  • Market drivers
  • Market challenges
  • Market trends
  • Five forces analysis

Quantitative

  • Market size and forecast
  • Market segmentation
  • Geographical insights
  • Competitive landscape

Interested in this report?

Get your sample now to see our research methodology and insights!

Download Now

Frequently Asked Questions

Casino market growth will increase by USD 34201.4 million during 2026-2030 .

The Casino market is expected to grow at a CAGR of 3.4% during 2026-2030 .

Casino market is segmented by Type (Poker, Blackjack, Craps, Lottery, Others) Product type (Land-based casino, Online casino) End-user (Gambling enthusiasts, Dabblers, Lottery loyalists, Unengaged audience)

Ballys Corp., Betsson Group, Caesars Entertainment Inc., Casino Del Sol, Delta Corp., Entain Plc, evoke plc, Evolution AB, Fantasy Springs Resort Casino, Flutter Entertainment Plc, Galaxy Entertainment Grp. Ltd., Genting Berhad, Golden Entertainment Inc., Las Vegas Sands Corp., MGM Resorts International, PENN Entertainment Inc., Rank Group PLC, SJM Holdings Ltd., Station Casinos LLC are a few of the key vendors in the Casino market.

North America will register the highest growth rate of 41.4% among the other regions. Therefore, the Casino market in North America is expected to garner significant business opportunities for the vendors during the forecast period.

US, Canada, Mexico, China, India, Australia, South Korea, Japan, Indonesia, Italy, UK, France, Germany, Spain, The Netherlands, Brazil, Argentina, Chile, Turkey, South Africa, UAE, Israel, Saudi Arabia

  • Expansion of regulated jurisdictions and licensing liberalization is the driving factor this market.

The Casino market vendors should focus on grabbing business opportunities from the Type segment as it accounted for the largest market share in the base year.