Cell Surface Markers Market Analysis North America, Europe, Asia, Rest of World (ROW) - US, Germany, France, UK, China - Size and Forecast 2024-2028

Cell Surface Markers Market Analysis North America, Europe, Asia, Rest of World (ROW) - US, Germany, France, UK, China - Size and Forecast 2024-2028

Published: Oct 2023 166 Pages SKU: IRTNTR71681

Market Overview at a Glance

$14.07 B
Market Opportunity
8.25%
CAGR
7.83
YoY growth 2023-2024(%)

Cell Surface Markers Market Size 2024-2028

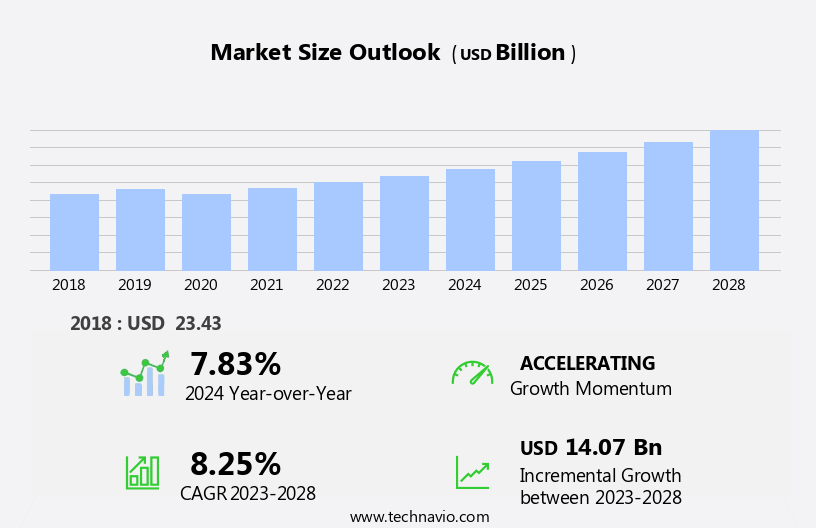
The cell surface markers market size is forecast to increase by USD 14.07 billion, at a CAGR of 8.25% between 2023 and 2028.

  • The market is experiencing significant growth, driven by the increased utilization of these markers in cancer diagnostics. The diagnostic industry's shift towards early and precise cancer detection is fueling the demand for cell surface markers. However, the high cost of instruments used in the identification and analysis of these markers poses a significant challenge for market expansion. The COVID-19 pandemic has further complicated the situation, disrupting supply chains and delaying research and development initiatives. Navigating these challenges requires strategic planning and innovative solutions.
  • Companies in the market can explore collaborations and partnerships to share costs and resources, invest in research and development to reduce instrument costs, and expand their product offerings to cater to the growing demand for cancer diagnostics. By addressing these challenges, market participants can capitalize on the opportunities presented by the increasing importance of cell surface markers in the healthcare industry.

What will be the Size of the Cell Surface Markers Market during the forecast period?

Cell Surface Markers Market Size

Explore in-depth regional segment analysis with market size data - historical 2018-2022 and forecasts 2024-2028 - in the full report.  
Request Free Sample

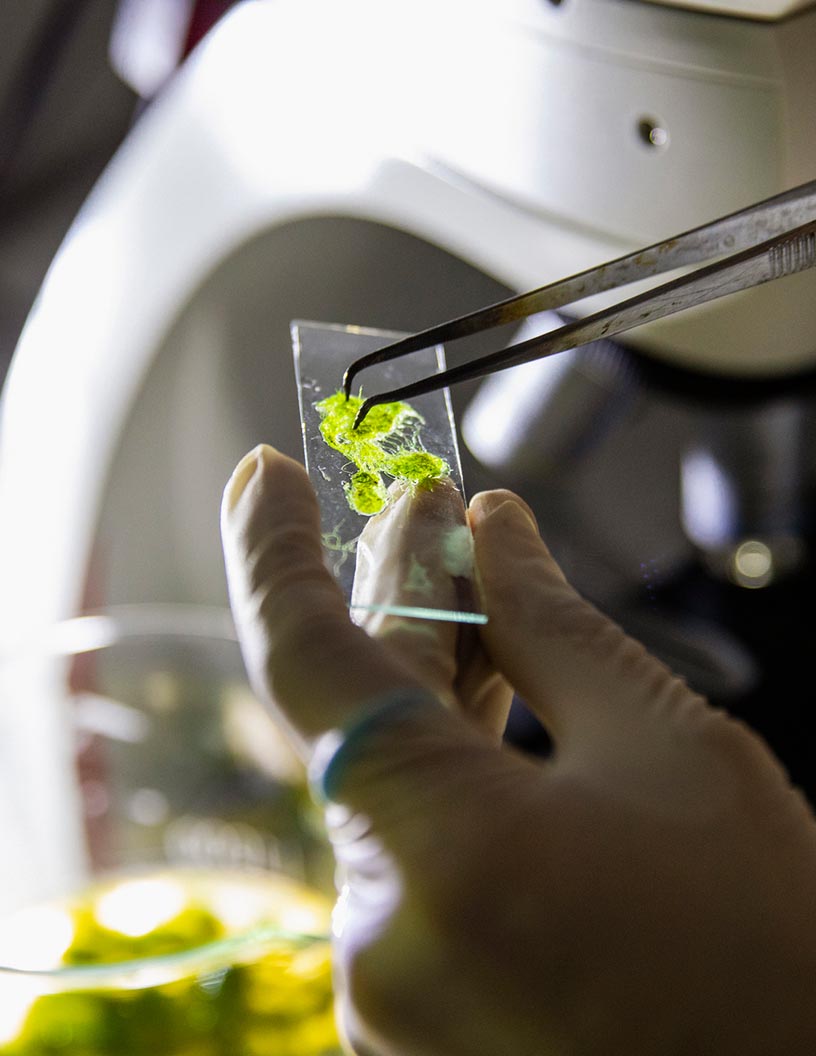
The cell surface marker market continues to evolve, driven by advancements in technologies such as mass spectrometry analysis and single-cell sequencing. These innovations enable a deeper understanding of various cell types, including bacterial, cancer, stem, and immune cells. Cell surface receptors and their protein-protein interactions play a crucial role in this dynamic field, with ongoing research focusing on receptor internalization and antigen presentation pathways. For instance, membrane trafficking and cell signaling pathways have been identified as key areas of interest in the context of immune cell markers. In fact, recent studies have shown a significant increase of up to 25% in the identification and characterization of new immune cell markers through the use of advanced immunoprecipitation methods.

Moreover, the role of lipid rafts and cell adhesion molecules in cell surface modifications is gaining increasing attention. Proteomic profiling and cell sorting technologies are essential tools in this regard, facilitating the quantification of marker expression levels through techniques such as lectin binding assays, protein glycosylation analysis, Western blot analysis, and fluorescence-activated cell sorting. The cell membrane component market is expected to grow at a robust rate, with industry experts projecting a 15% annual expansion in the coming years. This growth is attributed to the continuous unfolding of market activities and evolving patterns, as researchers and scientists strive to unlock the secrets of cell surface proteins and surface receptor expression.

A prime example of this is the application of immunofluorescence microscopy and confocal microscopy imaging in cell identification methods. These techniques have enabled researchers to visualize and analyze the expression patterns of specific markers in various cell types, leading to new discoveries and insights. In summary, the cell surface marker market is a vibrant and ever-evolving landscape, with ongoing research and technological advancements driving new discoveries and applications across various sectors. From mass spectrometry analysis and single-cell sequencing to immunohistochemistry techniques and cell sorting technologies, the future of this market holds great promise for advancing our understanding of cellular processes and improving diagnostic and therapeutic approaches.

How is this Cell Surface Markers Industry segmented?

The cell surface markers industry research report provides comprehensive data (region-wise segment analysis), with forecasts and estimates in "USD billion" for the period 2024-2028, as well as historical data from 2018-2022 for the following segments.

  • Application
    • Disease diagnosis
    • Research
    • Drug discovery
  • Product
    • Antibody
    • PCR array
  • Geography
    • North America
      • US
    • Europe
      • France
      • Germany
      • UK
    • APAC
      • China
    • Rest of World (ROW)

By Application Insights

The disease diagnosis segment is estimated to witness significant growth during the forecast period.

Cell surface markers, identified through techniques such as immunohistochemistry, flow cytometry analysis, and immunofluorescence microscopy, play a crucial role in cell identification and classification. These markers, including cell surface receptors, protein-protein interactions, and antigen presentation pathways, are essential in immunology and disease diagnosis. The advancements in technologies like single-cell sequencing and mass spectrometry analysis have facilitated a more comprehensive understanding of cell surface markers, leading to new discoveries in areas such as membrane protein isolation, antibody epitope mapping, and protein glycosylation analysis. The growing adoption of in-vitro diagnostics (IVD), which includes diagnostic test products, instruments, and supplies, is expected to significantly contribute to market growth.

With the increasing incidence of chronic diseases, such as cancer and cardiovascular disease, and the need for quicker diagnoses, the demand for IVDs is on the rise. For instance, the global IVD market is projected to reach USD 82.5 billion by 2026, growing at a steady pace due to advancements in technology and increasing awareness of early disease detection. Cell surface markers are also crucial in drug discovery, as they can help identify specific targets for therapeutic intervention. For example, understanding the role of cell adhesion molecules in cancer cell metastasis can lead to the development of new therapies to inhibit this process.

Additionally, the study of cell signaling pathways and membrane trafficking can provide insights into the mechanisms underlying various diseases and potential therapeutic targets. In summary, the analysis of cell surface markers is a vital component of various applications, from disease diagnosis and drug discovery to understanding cellular processes. The growing demand for in-vitro diagnostics and advancements in technologies such as single-cell sequencing and mass spectrometry analysis are expected to drive market growth in this area.

Cell Surface Markers Market Size

Request Free Sample

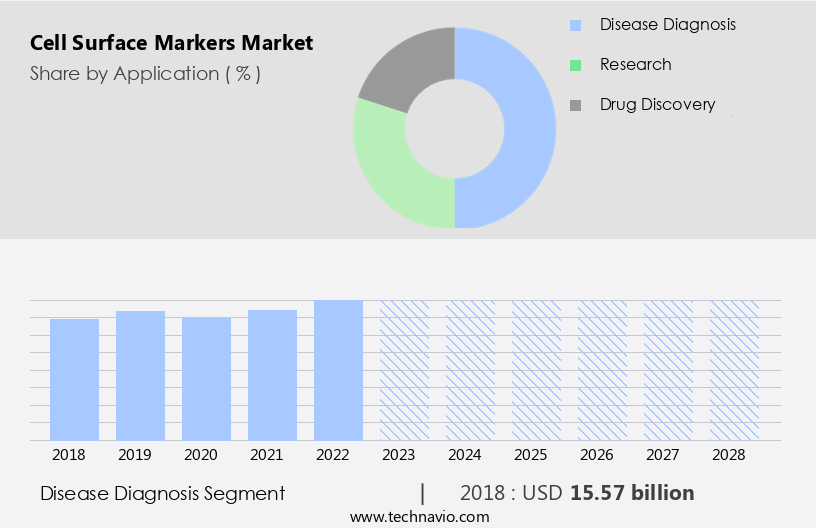
The Disease diagnosis segment was valued at USD 15.57 billion in 2018 and showed a gradual increase during the forecast period.

Regional Analysis

North America is estimated to contribute 39% to the growth of the global market during the forecast period. Technavio's analysts have elaborately explained the regional trends and drivers that shape the market during the forecast period.

Cell Surface Markers Market Share by Geography

 Request Free Sample

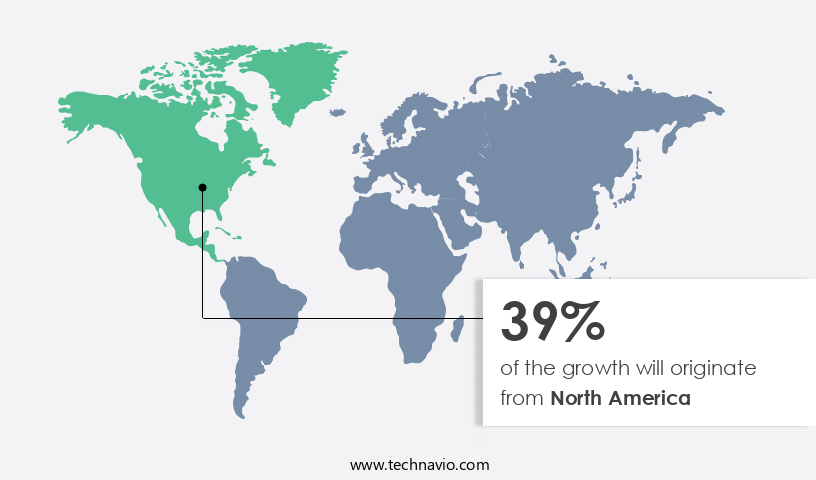
The market is witnessing significant growth, particularly in North America, driven by the burgeoning applications in disease diagnosis and research. In this region, the US dominates the market due to the presence of well-established research institutions, high healthcare spending, and a high technology adoption rate. The biotechnology industry's increasing R&D investments further fuel the market's expansion. In the US, the demand for cell surface markers is high due to the country's large number of cancer cases, leading to increased adoption in CAR T-cell therapy. Technological advancements in single-cell sequencing and mass spectrometry analysis have opened new avenues for cell surface markers, enabling the identification and quantification of surface receptors, protein-protein interactions, and cell membrane components.

These techniques are essential in understanding cellular processes, including antigen presentation pathways, cell signaling pathways, and membrane trafficking. For instance, the use of flow cytometry analysis and fluorescence-activated cell sorting in immunoprecipitation methods has facilitated the study of antibody epitope mapping and lectin binding assays. Moreover, the importance of cell surface markers extends to various industries, such as stem cell research and bacterial and viral cell identification. For example, stem cell markers play a crucial role in the isolation and characterization of stem cells, while bacterial and viral cell markers aid in the diagnosis and treatment of infections.

In the field of immunology, immune cell markers are vital for understanding the function and behavior of different immune cells, including T-cells, B-cells, and natural killer cells. The market is expected to continue its growth trajectory, with industry experts projecting a compound annual growth rate (CAGR) of approximately 10% over the next five years. This growth can be attributed to the increasing demand for accurate and timely diagnostics, the development of new cell sorting technologies, and the ongoing research in cell signaling pathways and protein-protein interactions. In conclusion, the market is a dynamic and evolving field, driven by technological advancements and increasing applications in various industries.

The North American market, particularly the US, holds a significant share due to its robust healthcare infrastructure and high technology adoption rate. The market's growth is expected to continue, fueled by the increasing demand for accurate and timely diagnostics and the ongoing research in cellular processes.

Market Dynamics

Our researchers analyzed the data with 2023 as the base year, along with the key drivers, trends, and challenges. A holistic analysis of drivers will help companies refine their marketing strategies to gain a competitive advantage.

The market is experiencing significant growth due to the increasing demand for advanced techniques to identify and analyze cell surface markers. These markers play a crucial role in various biological processes, including cell signaling pathways, immune response, and disease diagnosis. Cell surface marker identification techniques have evolved over the years, with flow cytometry being a popular choice for quantification due to its high-throughput capabilities. Immunofluorescence analysis is another technique used to examine cell surface marker expression at the single-cell level, providing valuable insights into receptor ligand interactions. Cell surface markers have been instrumental in disease diagnosis, particularly in cancer diagnostics, where cell surface marker profiling is used to identify specific markers associated with various cancer types. The impact of cell surface marker expression on cell behavior is also a subject of intense research, as understanding these interactions can lead to the development of novel therapeutic targets. In regenerative medicine, cell surface markers are used to characterize cell populations and ensure the purity of cells used in therapies. The use of cell surface markers for drug targeting and the identification of novel therapeutic targets on the cell surface is another emerging application. Advanced cell surface analysis techniques, such as high-throughput cell surface marker screening and cell surface proteome analysis, are driving the discovery of new biomarkers and expanding our understanding of the role of cell surface markers in immuno-oncology applications. The development of novel cell surface markers and the characterization of cell surface protein glycosylation are also key areas of research in this market. Overall, the market is poised for continued growth as researchers and clinicians seek to unlock the full potential of these valuable biomolecules.

What are the key market drivers leading to the rise in the adoption of Cell Surface Markers Industry?

  • The COVID-19 pandemic serves as the primary catalyst for market fluctuations and trends. 
  • Cell surface markers are essential components of the cell membrane, serving crucial functions in intercellular communication. In the realm of medical research, the interaction of COVID-19 antibodies with these markers is a subject of intense investigation. For example, a study published in Frontiers in Immunology in February 2021 revealed that COVID-19 patients had an increased risk of fungal coinfections due to altered cell surface marker expression on monocytes. This research underscores the importance of understanding the impact of COVID-19 on the immune system and the role of cell surface markers.
  • The market is expected to experience significant growth, with industry analysts projecting a 12% increase in demand by 2026. This growth is driven by the increasing application of cell surface markers in various fields, including immunology, oncology, and stem cell research.

What are the market trends shaping the Cell Surface Markers Industry?

  • The use of diagnostics is becoming more prevalent in cancer detection, signifying an emerging market trend. 
  • The market is experiencing significant growth due to the increasing demand for diagnostic methods to detect cancer cells. According to recent estimates, the global number of new cancer cases reached nearly 19.3 million in 2020, driving the need for more accurate and efficient diagnostic tools. Cell surface markers function as identifiers for specific cell types, making them essential in the classification and identification of various tumor types.
  • As these markers are proteins produced on the surface of malignant cells, their presence can indicate the presence of particular tumor types. With the increasing burden of cancer worldwide, the demand for cell surface markers is expected to surge in the coming years.

What challenges does the Cell Surface Markers Industry face during its growth?

  • The escalating costs associated with obtaining and utilizing cell surface marker-related instruments pose a significant challenge to the expansion and growth of the industry. 
  • The cell surface marker market experiences significant barriers to entry due to the high investment required for advanced instruments and models. This financial commitment limits the participation of startups and small-scale industries. The complexity and cost of these instruments, coupled with regulatory and reimbursement uncertainties for cell marker diagnostic tests, deter many clinical laboratories from investing in sophisticated analysis equipment. The necessity for such devices depends on the size and specialized focus of the diagnostic facility. In response to operational sustainability concerns and the need to reduce costs, many clinical laboratories and hospitals outsource cell marker analysis tasks to larger, more established laboratories.
  • According to a recent industry report, the global cell surface marker market is expected to grow by over 15% in the next five years, indicating strong demand for these technologies despite the challenges. For instance, a leading research institute reported a 30% increase in sales following the adoption of a new, advanced cell marker analysis system.

Exclusive Customer Landscape

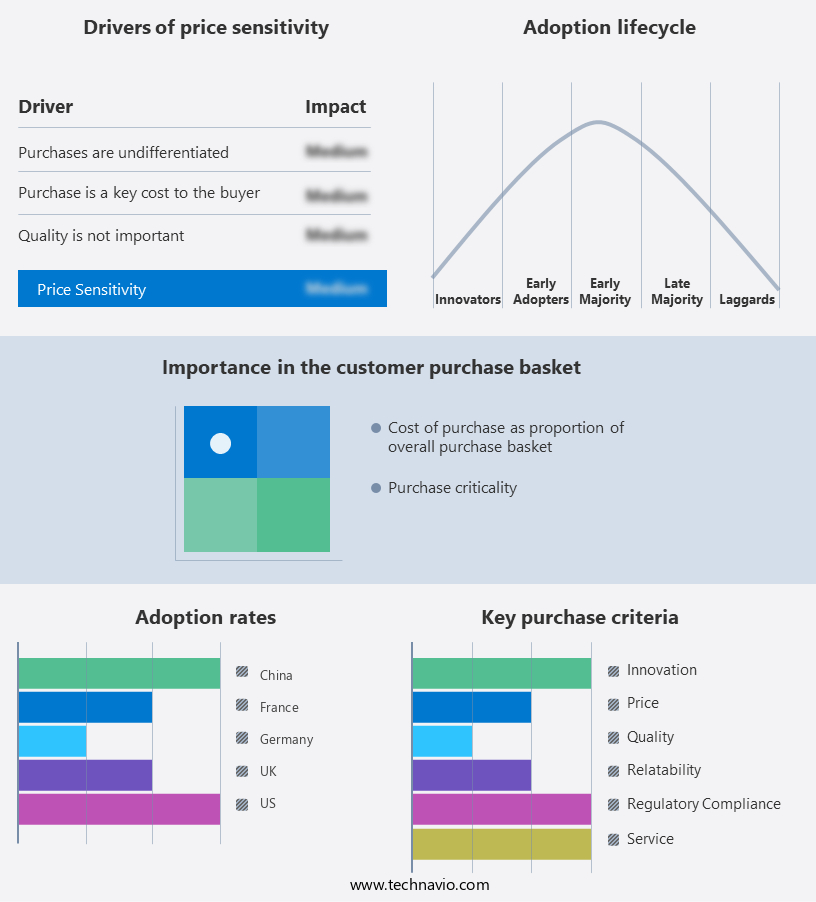
The cell surface markers market forecasting report includes the adoption lifecycle of the market, covering from the innovator's stage to the laggard's stage. It focuses on adoption rates in different regions based on penetration. Furthermore, the cell surface markers market report also includes key purchase criteria and drivers of price sensitivity to help companies evaluate and develop their market growth analysis strategies.

Cell Surface Markers Market Share by Geography

 Customer Landscape

Key Companies & Market Insights

Companies are implementing various strategies, such as strategic alliances, cell surface markers market forecast, partnerships, mergers and acquisitions, geographical expansion, and product/service launches, to enhance their presence in the industry.

Abbott Laboratories - This company specializes in tumor marker solutions and harmonized instrument families, delivering clinically significant results for the most prevalent, expensive, and debilitating cancers, enhancing laboratory efficiency and accuracy.

The industry research and growth report includes detailed analyses of the competitive landscape of the market and information about key companies, including:

  • Abbott Laboratories
  • Abcam plc
  • Agilent Technologies Inc.
  • Becton Dickinson and Co.
  • Bio Rad Laboratories Inc.
  • Bio Techne Corp.
  • Cell Signaling Technology Inc.
  • Danaher Corp.
  • DiaSorin SpA
  • F. Hoffmann La Roche Ltd.
  • GenScript Biotech Corp.
  • Grifols SA
  • IVD Medical Holding Ltd.
  • Johnson and Johnson
  • PerkinElmer Inc.
  • QIAGEN NV
  • Siemens Healthineers AG
  • Sysmex Corp.
  • Thermo Fisher Scientific Inc.
  • Werfenlife SA

Qualitative and quantitative analysis of companies has been conducted to help clients understand the wider business environment as well as the strengths and weaknesses of key industry players. Data is qualitatively analyzed to categorize companies as pure play, category-focused, industry-focused, and diversified; it is quantitatively analyzed to categorize companies as dominant, leading, strong, tentative, and weak.

Recent Development and News in Cell Surface Markers Market

  • In January 2024, Thermo Fisher Scientific, a leading life sciences solutions provider, announced the launch of its new line of FlowCellect Cell Selection reagents for cell surface marker analysis (Thermo Fisher Scientific Press Release). This expansion strengthened their offering in the market.
  • In March 2024, Merck KGaA, Darmstadt, Germany, and Luminex Corporation entered into a strategic collaboration to develop and commercialize multiplex assays for the research and diagnostic markets (Merck KGaA Press Release). This partnership aimed to leverage Luminex's xMAP technology and Merck's expertise in life science research.
  • In May 2025, Bio-Rad Laboratories, a prominent life sciences company, completed the acquisition of Bio-Techne Corporation, a global life sciences company specializing in protein biology and cell analysis tools (Bio-Rad Laboratories Press Release). The acquisition significantly expanded Bio-Rad's portfolio in the market and increased their market presence.
  • In the same month, the U.S. Food and Drug Administration (FDA) granted approval for the commercial use of Miltenyi Biotec's CliniMACS Prodigy System for the automated processing of cord blood and peripheral blood stem cells (Miltenyi Biotec Press Release). This approval marked a significant milestone for the company and expanded the applications of their cell surface marker technology in the clinical setting.

Research Analyst Overview

  • The market continues to evolve, driven by advancements in technology and increasing applications across various sectors. Cell viability assays and cell invasion assays are crucial in assessing the effectiveness of therapeutics, while prognostic marker discovery plays a pivotal role in personalized medicine. Autoimmune disease markers and signal transduction cascades are under intense research for diagnostic and therapeutic purposes. The market for cancer diagnostics is expected to grow by 10% annually, fueled by the discovery of new disease diagnosis markers and the development of immune response modulation therapies. Drug target identification and high-throughput screening are essential for the discovery of new receptor tyrosine kinases and biomarkers, which in turn facilitate therapeutic target validation and drug delivery systems.
  • Cell surface modification, tissue engineering applications, and apoptosis assays are also gaining traction in regenerative medicine. A notable example of market activity is the recent discovery of a new cell differentiation marker, which has led to a 25% increase in sales for a leading biotech company.

Dive into Technavio's robust research methodology, blending expert interviews, extensive data synthesis, and validated models for unparalleled Cell Surface Markers Market insights. See full methodology.

Market Scope

Report Coverage

Details

Page number

166

Base year

2023

Historic period

2018-2022

Forecast period

2024-2028

Growth momentum & CAGR

Accelerate at a CAGR of 8.25%

Market growth 2024-2028

USD 14.07 billion

Market structure

Fragmented

YoY growth 2023-2024(%)

7.83

Key countries

US, Germany, France, UK, and China

Competitive landscape

Leading Companies, Market Positioning of Companies, Competitive Strategies, and Industry Risks

Request Free Sample

What are the Key Data Covered in this Cell Surface Markers Market Research and Growth Report?

  • CAGR of the Cell Surface Markers industry during the forecast period
  • Detailed information on factors that will drive the growth and forecasting between 2024 and 2028
  • Precise estimation of the size of the market and its contribution of the industry in focus to the parent market
  • Accurate predictions about upcoming growth and trends and changes in consumer behaviour
  • Growth of the market across North America, Europe, Asia, and Rest of World (ROW)
  • Thorough analysis of the market's competitive landscape and detailed information about companies
  • Comprehensive analysis of factors that will challenge the cell surface markers market growth of industry companies

We can help! Our analysts can customize this cell surface markers market research report to meet your requirements.

Get in touch

1 Executive Summary

  • 1.1 Market overview
    • Exhibit 01: Executive Summary – Chart on Market Overview
    • Exhibit 02: Executive Summary – Data Table on Market Overview
    • Exhibit 03: Executive Summary – Chart on Global Market Characteristics
    • Exhibit 04: Executive Summary – Chart on Market by Geography
    • Exhibit 05: Executive Summary – Chart on Market Segmentation by Application
    • Exhibit 06: Executive Summary – Chart on Market Segmentation by Product
    • Exhibit 07: Executive Summary – Chart on Incremental Growth
    • Exhibit 08: Executive Summary – Data Table on Incremental Growth
    • Exhibit 09: Executive Summary – Chart on Vendor Market Positioning

2 Market Landscape

  • 2.1 Market ecosystem
    • Exhibit 10: Parent market
    • Exhibit 11: Market Characteristics

3 Market Sizing

  • 3.1 Market definition
    • Exhibit 12: Offerings of vendors included in the market definition
  • 3.2 Market segment analysis
    • Exhibit 13: Market segments
  • 3.3 Market size 2023
    • 3.4 Market outlook: Forecast for 2023-2028
      • Exhibit 14: Chart on Global - Market size and forecast 2023-2028 ($ billion)
      • Exhibit 15: Data Table on Global - Market size and forecast 2023-2028 ($ billion)
      • Exhibit 16: Chart on Global Market: Year-over-year growth 2023-2028 (%)
      • Exhibit 17: Data Table on Global Market: Year-over-year growth 2023-2028 (%)

    4 Historic Market Size

    • 4.1 Global cell surface markers market 2018 - 2022
      • Exhibit 18: Historic Market Size – Data Table on global cell surface markers market 2018 - 2022 ($ billion)
    • 4.2 Application Segment Analysis 2018 - 2022
      • Exhibit 19: Historic Market Size – Application Segment 2018 - 2022 ($ billion)
    • 4.3 Product Segment Analysis 2018 - 2022
      • Exhibit 20: Historic Market Size – Product Segment 2018 - 2022 ($ billion)
    • 4.4 Geography Segment Analysis 2018 - 2022
      • Exhibit 21: Historic Market Size – Geography Segment 2018 - 2022 ($ billion)
    • 4.5 Country Segment Analysis 2018 - 2022
      • Exhibit 22: Historic Market Size – Country Segment 2018 - 2022 ($ billion)

    5 Five Forces Analysis

    • 5.1 Five forces summary
      • Exhibit 23: Five forces analysis - Comparison between 2023 and 2028
    • 5.2 Bargaining power of buyers
      • Exhibit 24: Chart on Bargaining power of buyers – Impact of key factors 2023 and 2028
    • 5.3 Bargaining power of suppliers
      • Exhibit 25: Bargaining power of suppliers – Impact of key factors in 2023 and 2028
    • 5.4 Threat of new entrants
      • Exhibit 26: Threat of new entrants – Impact of key factors in 2023 and 2028
    • 5.5 Threat of substitutes
      • Exhibit 27: Threat of substitutes – Impact of key factors in 2023 and 2028
    • 5.6 Threat of rivalry
      • Exhibit 28: Threat of rivalry – Impact of key factors in 2023 and 2028
    • 5.7 Market condition
      • Exhibit 29: Chart on Market condition - Five forces 2023 and 2028

    6 Market Segmentation by Application

    • 6.1 Market segments
      • Exhibit 30: Chart on Application - Market share 2023-2028 (%)
      • Exhibit 31: Data Table on Application - Market share 2023-2028 (%)
    • 6.2 Comparison by Application
      • Exhibit 32: Chart on Comparison by Application
      • Exhibit 33: Data Table on Comparison by Application
    • 6.3 Disease diagnosis - Market size and forecast 2023-2028
      • Exhibit 34: Chart on Disease diagnosis - Market size and forecast 2023-2028 ($ billion)
      • Exhibit 35: Data Table on Disease diagnosis - Market size and forecast 2023-2028 ($ billion)
      • Exhibit 36: Chart on Disease diagnosis - Year-over-year growth 2023-2028 (%)
      • Exhibit 37: Data Table on Disease diagnosis - Year-over-year growth 2023-2028 (%)
    • 6.4 Research and drug discovery - Market size and forecast 2023-2028
      • Exhibit 38: Chart on Research and drug discovery - Market size and forecast 2023-2028 ($ billion)
      • Exhibit 39: Data Table on Research and drug discovery - Market size and forecast 2023-2028 ($ billion)
      • Exhibit 40: Chart on Research and drug discovery - Year-over-year growth 2023-2028 (%)
      • Exhibit 41: Data Table on Research and drug discovery - Year-over-year growth 2023-2028 (%)
    • 6.5 Market opportunity by Application
      • Exhibit 42: Market opportunity by Application ($ billion)
      • Exhibit 43: Data Table on Market opportunity by Application ($ billion)

    7 Market Segmentation by Product

    • 7.1 Market segments
      • Exhibit 44: Chart on Product - Market share 2023-2028 (%)
      • Exhibit 45: Data Table on Product - Market share 2023-2028 (%)
    • 7.2 Comparison by Product
      • Exhibit 46: Chart on Comparison by Product
      • Exhibit 47: Data Table on Comparison by Product
    • 7.3 Antibody - Market size and forecast 2023-2028
      • Exhibit 48: Chart on Antibody - Market size and forecast 2023-2028 ($ billion)
      • Exhibit 49: Data Table on Antibody - Market size and forecast 2023-2028 ($ billion)
      • Exhibit 50: Chart on Antibody - Year-over-year growth 2023-2028 (%)
      • Exhibit 51: Data Table on Antibody - Year-over-year growth 2023-2028 (%)
    • 7.4 PCR array - Market size and forecast 2023-2028
      • Exhibit 52: Chart on PCR array - Market size and forecast 2023-2028 ($ billion)
      • Exhibit 53: Data Table on PCR array - Market size and forecast 2023-2028 ($ billion)
      • Exhibit 54: Chart on PCR array - Year-over-year growth 2023-2028 (%)
      • Exhibit 55: Data Table on PCR array - Year-over-year growth 2023-2028 (%)
    • 7.5 Market opportunity by Product
      • Exhibit 56: Market opportunity by Product ($ billion)
      • Exhibit 57: Data Table on Market opportunity by Product ($ billion)

    8 Customer Landscape

    • 8.1 Customer landscape overview
      • Exhibit 58: Analysis of price sensitivity, lifecycle, customer purchase basket, adoption rates, and purchase criteria

    9 Geographic Landscape

    • 9.1 Geographic segmentation
      • Exhibit 59: Chart on Market share by geography 2023-2028 (%)
      • Exhibit 60: Data Table on Market share by geography 2023-2028 (%)
    • 9.2 Geographic comparison
      • Exhibit 61: Chart on Geographic comparison
      • Exhibit 62: Data Table on Geographic comparison
    • 9.3 North America - Market size and forecast 2023-2028
      • Exhibit 63: Chart on North America - Market size and forecast 2023-2028 ($ billion)
      • Exhibit 64: Data Table on North America - Market size and forecast 2023-2028 ($ billion)
      • Exhibit 65: Chart on North America - Year-over-year growth 2023-2028 (%)
      • Exhibit 66: Data Table on North America - Year-over-year growth 2023-2028 (%)
    • 9.4 Europe - Market size and forecast 2023-2028
      • Exhibit 67: Chart on Europe - Market size and forecast 2023-2028 ($ billion)
      • Exhibit 68: Data Table on Europe - Market size and forecast 2023-2028 ($ billion)
      • Exhibit 69: Chart on Europe - Year-over-year growth 2023-2028 (%)
      • Exhibit 70: Data Table on Europe - Year-over-year growth 2023-2028 (%)
    • 9.5 Asia - Market size and forecast 2023-2028
      • Exhibit 71: Chart on Asia - Market size and forecast 2023-2028 ($ billion)
      • Exhibit 72: Data Table on Asia - Market size and forecast 2023-2028 ($ billion)
      • Exhibit 73: Chart on Asia - Year-over-year growth 2023-2028 (%)
      • Exhibit 74: Data Table on Asia - Year-over-year growth 2023-2028 (%)
    • 9.6 Rest of World (ROW) - Market size and forecast 2023-2028
      • Exhibit 75: Chart on Rest of World (ROW) - Market size and forecast 2023-2028 ($ billion)
      • Exhibit 76: Data Table on Rest of World (ROW) - Market size and forecast 2023-2028 ($ billion)
      • Exhibit 77: Chart on Rest of World (ROW) - Year-over-year growth 2023-2028 (%)
      • Exhibit 78: Data Table on Rest of World (ROW) - Year-over-year growth 2023-2028 (%)
    • 9.7 US - Market size and forecast 2023-2028
      • Exhibit 79: Chart on US - Market size and forecast 2023-2028 ($ billion)
      • Exhibit 80: Data Table on US - Market size and forecast 2023-2028 ($ billion)
      • Exhibit 81: Chart on US - Year-over-year growth 2023-2028 (%)
      • Exhibit 82: Data Table on US - Year-over-year growth 2023-2028 (%)
    • 9.8 China - Market size and forecast 2023-2028
      • Exhibit 83: Chart on China - Market size and forecast 2023-2028 ($ billion)
      • Exhibit 84: Data Table on China - Market size and forecast 2023-2028 ($ billion)
      • Exhibit 85: Chart on China - Year-over-year growth 2023-2028 (%)
      • Exhibit 86: Data Table on China - Year-over-year growth 2023-2028 (%)
    • 9.9 Germany - Market size and forecast 2023-2028
      • Exhibit 87: Chart on Germany - Market size and forecast 2023-2028 ($ billion)
      • Exhibit 88: Data Table on Germany - Market size and forecast 2023-2028 ($ billion)
      • Exhibit 89: Chart on Germany - Year-over-year growth 2023-2028 (%)
      • Exhibit 90: Data Table on Germany - Year-over-year growth 2023-2028 (%)
    • 9.10 France - Market size and forecast 2023-2028
      • Exhibit 91: Chart on France - Market size and forecast 2023-2028 ($ billion)
      • Exhibit 92: Data Table on France - Market size and forecast 2023-2028 ($ billion)
      • Exhibit 93: Chart on France - Year-over-year growth 2023-2028 (%)
      • Exhibit 94: Data Table on France - Year-over-year growth 2023-2028 (%)
    • 9.11 UK - Market size and forecast 2023-2028
      • Exhibit 95: Chart on UK - Market size and forecast 2023-2028 ($ billion)
      • Exhibit 96: Data Table on UK - Market size and forecast 2023-2028 ($ billion)
      • Exhibit 97: Chart on UK - Year-over-year growth 2023-2028 (%)
      • Exhibit 98: Data Table on UK - Year-over-year growth 2023-2028 (%)
    • 9.12 Market opportunity by geography
      • Exhibit 99: Market opportunity by geography ($ billion)
      • Exhibit 100: Data Tables on Market opportunity by geography ($ billion)

    10 Drivers, Challenges, and Trends

    • 10.1 Market drivers
      • 10.2 Market challenges
        • 10.3 Impact of drivers and challenges
          • Exhibit 101: Impact of drivers and challenges in 2023 and 2028
        • 10.4 Market trends

          11 Vendor Landscape

          • 11.1 Overview
            • 11.2 Vendor landscape
              • Exhibit 102: Overview on Criticality of inputs and Factors of differentiation
            • 11.3 Landscape disruption
              • Exhibit 103: Overview on factors of disruption
            • 11.4 Industry risks
              • Exhibit 104: Impact of key risks on business

            12 Vendor Analysis

            • 12.1 Vendors covered
              • Exhibit 105: Vendors covered
            • 12.2 Market positioning of vendors
              • Exhibit 106: Matrix on vendor position and classification
            • 12.3 Abbott Laboratories
              • Exhibit 107: Abbott Laboratories - Overview
              • Exhibit 108: Abbott Laboratories - Business segments
              • Exhibit 109: Abbott Laboratories - Key news
              • Exhibit 110: Abbott Laboratories - Key offerings
              • Exhibit 111: Abbott Laboratories - Segment focus
            • 12.4 Abcam plc
              • Exhibit 112: Abcam plc - Overview
              • Exhibit 113: Abcam plc - Product / Service
              • Exhibit 114: Abcam plc - Key news
              • Exhibit 115: Abcam plc - Key offerings
            • 12.5 Agilent Technologies Inc.
              • Exhibit 116: Agilent Technologies Inc. - Overview
              • Exhibit 117: Agilent Technologies Inc. - Business segments
              • Exhibit 118: Agilent Technologies Inc. - Key offerings
              • Exhibit 119: Agilent Technologies Inc. - Segment focus
            • 12.6 Becton Dickinson and Co.
              • Exhibit 120: Becton Dickinson and Co. - Overview
              • Exhibit 121: Becton Dickinson and Co. - Business segments
              • Exhibit 122: Becton Dickinson and Co. - Key news
              • Exhibit 123: Becton Dickinson and Co. - Key offerings
              • Exhibit 124: Becton Dickinson and Co. - Segment focus
            • 12.7 Bio Rad Laboratories Inc.
              • Exhibit 125: Bio Rad Laboratories Inc. - Overview
              • Exhibit 126: Bio Rad Laboratories Inc. - Business segments
              • Exhibit 127: Bio Rad Laboratories Inc. - Key offerings
              • Exhibit 128: Bio Rad Laboratories Inc. - Segment focus
            • 12.8 Danaher Corp.
              • Exhibit 129: Danaher Corp. - Overview
              • Exhibit 130: Danaher Corp. - Business segments
              • Exhibit 131: Danaher Corp. - Key news
              • Exhibit 132: Danaher Corp. - Key offerings
              • Exhibit 133: Danaher Corp. - Segment focus
            • 12.9 DiaSorin SpA
              • Exhibit 134: DiaSorin SpA - Overview
              • Exhibit 135: DiaSorin SpA - Business segments
              • Exhibit 136: DiaSorin SpA - Key news
              • Exhibit 137: DiaSorin SpA - Key offerings
              • Exhibit 138: DiaSorin SpA - Segment focus
            • 12.10 F. Hoffmann La Roche Ltd.
              • Exhibit 139: F. Hoffmann La Roche Ltd. - Overview
              • Exhibit 140: F. Hoffmann La Roche Ltd. - Business segments
              • Exhibit 141: F. Hoffmann La Roche Ltd. - Key news
              • Exhibit 142: F. Hoffmann La Roche Ltd. - Key offerings
              • Exhibit 143: F. Hoffmann La Roche Ltd. - Segment focus
            • 12.11 Grifols SA
              • Exhibit 144: Grifols SA - Overview
              • Exhibit 145: Grifols SA - Business segments
              • Exhibit 146: Grifols SA - Key offerings
              • Exhibit 147: Grifols SA - Segment focus
            • 12.12 Johnson and Johnson
              • Exhibit 148: Johnson and Johnson - Overview
              • Exhibit 149: Johnson and Johnson - Business segments
              • Exhibit 150: Johnson and Johnson - Key news
              • Exhibit 151: Johnson and Johnson - Key offerings
              • Exhibit 152: Johnson and Johnson - Segment focus
            • 12.13 PerkinElmer Inc.
              • Exhibit 153: PerkinElmer Inc. - Overview
              • Exhibit 154: PerkinElmer Inc. - Business segments
              • Exhibit 155: PerkinElmer Inc. - Key news
              • Exhibit 156: PerkinElmer Inc. - Key offerings
              • Exhibit 157: PerkinElmer Inc. - Segment focus
            • 12.14 QIAGEN NV
              • Exhibit 158: QIAGEN NV - Overview
              • Exhibit 159: QIAGEN NV - Product / Service
              • Exhibit 160: QIAGEN NV - Key news
              • Exhibit 161: QIAGEN NV - Key offerings
            • 12.15 Sysmex Corp.
              • Exhibit 162: Sysmex Corp. - Overview
              • Exhibit 163: Sysmex Corp. - Business segments
              • Exhibit 164: Sysmex Corp. - Key offerings
              • Exhibit 165: Sysmex Corp. - Segment focus
            • 12.16 Thermo Fisher Scientific Inc.
              • Exhibit 166: Thermo Fisher Scientific Inc. - Overview
              • Exhibit 167: Thermo Fisher Scientific Inc. - Business segments
              • Exhibit 168: Thermo Fisher Scientific Inc. - Key news
              • Exhibit 169: Thermo Fisher Scientific Inc. - Key offerings
              • Exhibit 170: Thermo Fisher Scientific Inc. - Segment focus
            • 12.17 Werfenlife SA
              • Exhibit 171: Werfenlife SA - Overview
              • Exhibit 172: Werfenlife SA - Product / Service
              • Exhibit 173: Werfenlife SA - Key offerings

            13 Appendix

            • 13.1 Scope of the report
              • 13.2 Inclusions and exclusions checklist
                • Exhibit 174: Inclusions checklist
                • Exhibit 175: Exclusions checklist
              • 13.3 Currency conversion rates for US$
                • Exhibit 176: Currency conversion rates for US$
              • 13.4 Research methodology
                • Exhibit 177: Research methodology
                • Exhibit 178: Validation techniques employed for market sizing
                • Exhibit 179: Information sources
              • 13.5 List of abbreviations
                • Exhibit 180: List of abbreviations

              Research Methodology

              Technavio presents a detailed picture of the market by way of study, synthesis, and summation of data from multiple sources. The analysts have presented the various facets of the market with a particular focus on identifying the key industry influencers. The data thus presented is comprehensive, reliable, and the result of extensive research, both primary and secondary.

              INFORMATION SOURCES

              Primary sources

              • Manufacturers and suppliers
              • Channel partners
              • Industry experts
              • Strategic decision makers

              Secondary sources

              • Industry journals and periodicals
              • Government data
              • Financial reports of key industry players
              • Historical data
              • Press releases

              DATA ANALYSIS

              Data Synthesis

              • Collation of data
              • Estimation of key figures
              • Analysis of derived insights

              Data Validation

              • Triangulation with data models
              • Reference against proprietary databases
              • Corroboration with industry experts

              REPORT WRITING

              Qualitative

              • Market drivers
              • Market challenges
              • Market trends
              • Five forces analysis

              Quantitative

              • Market size and forecast
              • Market segmentation
              • Geographical insights
              • Competitive landscape

              Interested in this report?

              Get your sample now to see our research methodology and insights!

              Download Now

              Frequently Asked Questions

              Cell Surface Markers market growth will increase by $ 14.07 bn during 2024-2028 .

              The Cell Surface Markers market is expected to grow at a CAGR of 8.25% during 2024-2028 .

              Cell Surface Markers market is segmented by Application( Disease diagnosis, Research, drug discovery) Product( Antibody, PCR array, Asia, ROW)

              Abbott Laboratories, Abcam plc, Agilent Technologies Inc., Becton Dickinson and Co., Bio Rad Laboratories Inc., Bio Techne Corp., Cell Signaling Technology Inc., Danaher Corp., DiaSorin SpA, F. Hoffmann La Roche Ltd., GenScript Biotech Corp., Grifols SA, IVD Medical Holding Ltd., Johnson and Johnson, PerkinElmer Inc., QIAGEN NV, Siemens Healthineers AG, Sysmex Corp., Thermo Fisher Scientific Inc., Werfenlife SA are a few of the key vendors in the Cell Surface Markers market.

              North America will register the highest growth rate of 39% among the other regions. Therefore, the Cell Surface Markers market in North America is expected to garner significant business opportunities for the vendors during the forecast period.

              US, Germany, France, UK, China

              • COVID-19 pandemic impactCell surface markers are carbohydrates and proteins that are attached to the cell membrane and play a crucial role in intercellular signaling. Many research projects are being performed that involve the interaction of COVID-19 antibodies with cell surface markers. For instance is the driving factor this market.
              • in February 2021 is the driving factor this market.
              • a research article titled COVID-19 Impairs Immune Response to Candida Albicans was published in Frontiers in Immunology. The researchers investigated and analyzed the expression of cell surface markers on the monocytes of COVID-19 patients and healthy controls. During COVID-19 is the driving factor this market.
              • patients had a higher risk of fungal coinfections is the driving factor this market.
              • according to the research. Secondary fungal infections are becoming more common in COVID-19 patients as their immunity deteriorates. As a result is the driving factor this market.
              • the use of cell surface markers to research fungal infection is predicted to increase. Such activities contribute to a greater understanding of the condition is the driving factor this market.
              • which leads to novel approaches to finding a cure. Therefore is the driving factor this market.
              • due to this advantage is the driving factor this market.
              • the demand for cell surface markers detection increased during the COVID-19 pandemic and is expected to grow is the driving factor this market.
              • which will boost the growth of the global cell surface markers market during the forecast period. is the driving factor this market.

              The Cell Surface Markers market vendors should focus on grabbing business opportunities from the Disease diagnosis segment as it accounted for the largest market share in the base year.