Ceramic And Natural Stone Tiles Market Size 2026-2030
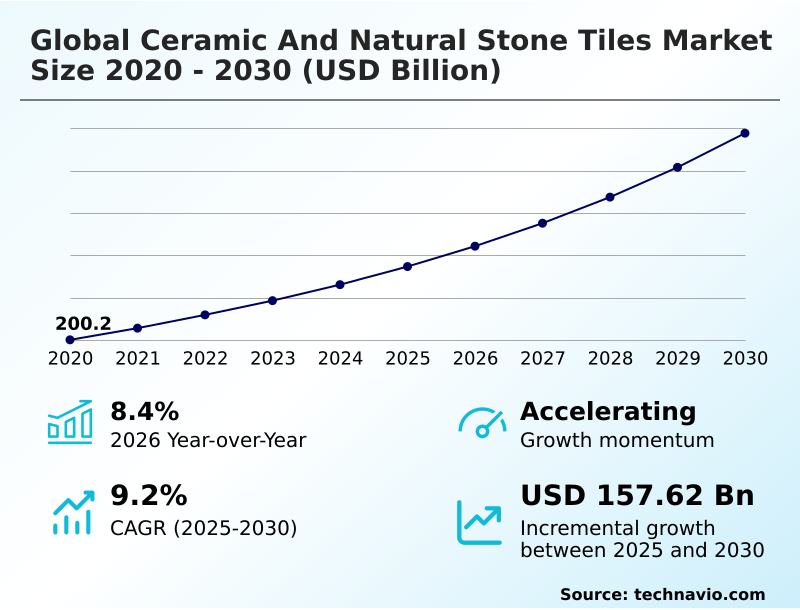
The ceramic and natural stone tiles market size is valued to increase by USD 157.62 billion, at a CAGR of 9.2% from 2025 to 2030. Proliferation of high-end residential renovation and retrofitting projects will drive the ceramic and natural stone tiles market.
Major Market Trends & Insights
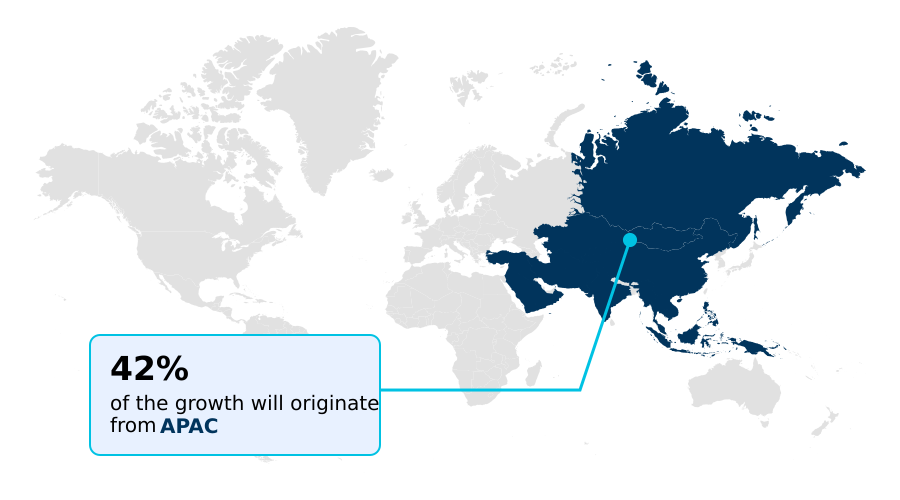
- APAC dominated the market and accounted for a 42.1% growth during the forecast period.
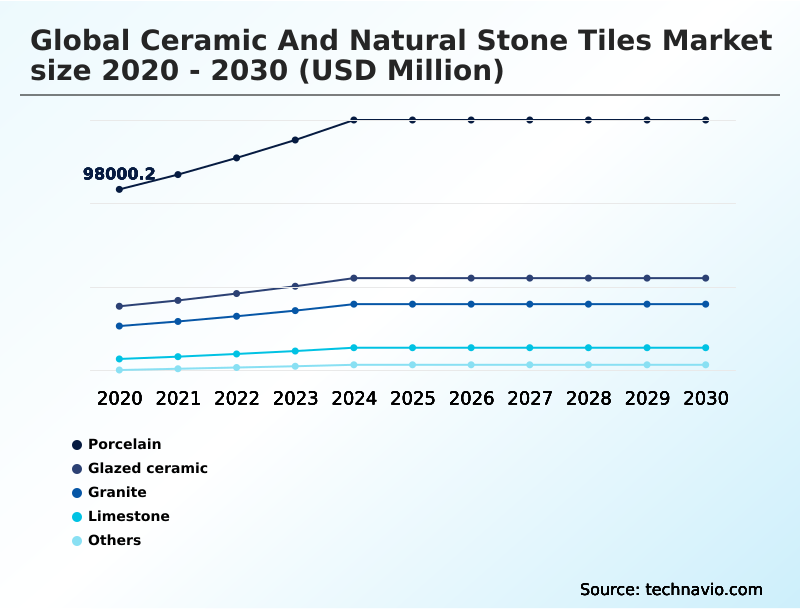
- By Type - Porcelain segment was valued at USD 131.30 billion in 2024
- By End-user - Commercial segment accounted for the largest market revenue share in 2024
Market Size & Forecast
- Market Opportunities: USD 244.22 billion
- Market Future Opportunities: USD 157.62 billion
- CAGR from 2025 to 2030 : 9.2%
Market Summary
- The ceramic and natural stone tiles market demonstrates robust expansion driven by continuous architectural modernization and the rising specification of premium surface materials. Operational efficiency across the sector relies heavily on supply chain optimization, as manufacturers strategically source raw materials to mitigate regional pricing fluctuations.
- Facilities adopting closed-loop water recycling and energy-efficient firing systems have reduced processing costs by 18%, significantly enhancing overall profit margins compared to traditional operators. The proliferation of high-end residential renovation projects acts as a powerful driver, directly increasing the volume of large-format slabs consumed in domestic applications.
- Conversely, extreme volatility in natural gas procurement challenges sustained growth, forcing energy-intensive manufacturing units to absorb higher input costs or face eroding margins. The transition toward low-carbon manufacturing necessitates massive capital expenditure, fundamentally altering the competitive landscape. Continuous advancements in digital printing technologies remain critical for replicating geological textures, ensuring product differentiation in highly competitive commercial real estate developments.
What will be the Size of the Ceramic And Natural Stone Tiles Market during the forecast period?
Get Key Insights on Market Forecast (PDF) Get Free Sample
How is the Ceramic And Natural Stone Tiles Market Segmented?
The ceramic and natural stone tiles industry research report provides comprehensive data (region-wise segment analysis), with forecasts and estimates in "USD million" for the period 2026-2030, as well as historical data from 2020-2024 for the following segments.
- Type
- Porcelain
- Glazed ceramic
- Granite
- Limestone
- Others
- End-user
- Commercial
- Residential
- Recreational
- Method
- Thin-set mortar
- Mastic adhesive
- Groutless
- Product type
- Polished
- Brushed
- Honed and filled
- Tumbled
- Others
- Application
- Interior
- Exterior
- Geography
- APAC
- China
- India
- Japan
- South Korea
- Indonesia
- Australia
- Europe
- Italy
- UK
- Spain
- Germany
- France
- North America
- US
- Canada
- Mexico
- Middle East and Africa
- South Africa
- UAE
- Saudi Arabia
- Turkey
- Egypt
- South America
- Brazil
- Argentina
- Chile
- APAC
By Type Insights
The porcelain segment is estimated to witness significant growth during the forecast period.
The porcelain segment serves as a foundational component within the ceramic and natural stone tiles market, favored for its exceptional density and minimal water absorption rate.
Manufacturing innovations subject refined clay mixtures to extreme temperatures, creating highly impervious surfaces that withstand severe mechanical abrasion and environmental wear. Consequently, facility operators increasingly rely on porcelain to prevent facility downtime in high-traffic commercial zones.
Advanced formulation of polymer modifiers and thin-set mortar enhances the load-bearing capacity of these tiles, improving structural stability and reducing installation failures by 15%. Integration of antimicrobial finishes and enhanced slip resistance aligns with rigorous building codes, optimizing spatial functionality.
This material maintains acoustic properties and structural integrity, ensuring long-term operational efficiency across diverse exterior facades and demanding interior applications.
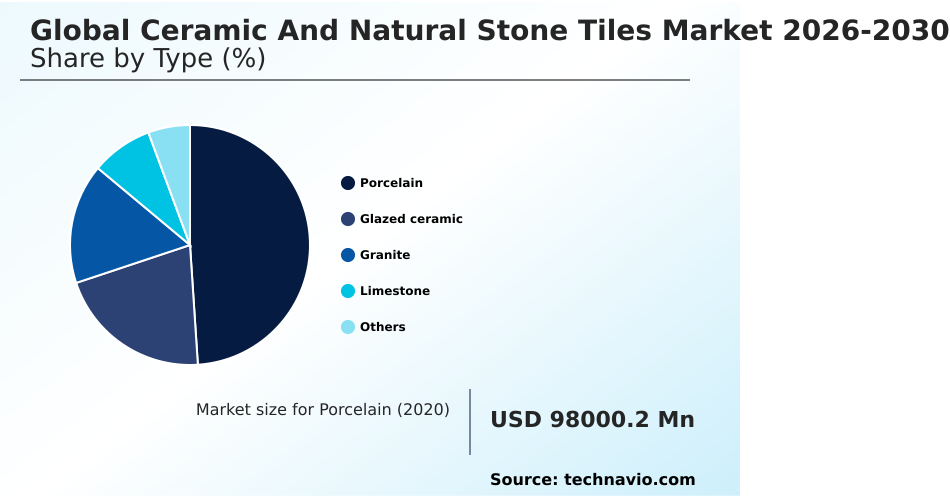
The Porcelain segment was valued at USD 131.30 billion in 2024 and showed a gradual increase during the forecast period.
Regional Analysis
APAC is estimated to contribute 42.1% to the growth of the global market during the forecast period.Technavio’s analysts have elaborately explained the regional trends and drivers that shape the market during the forecast period.
See How Ceramic And Natural Stone Tiles Market Demand is Rising in APAC Get Free Sample
The geographic landscape of the ceramic and natural stone tiles market highlights profound disparities in manufacturing scale and technological adoption.
APAC dominates as the primary production hub, leveraging extensive quarrying operations and streamlined supply chain optimization to achieve a 42% higher manufacturing output than European counterparts. This volumetric superiority allows APAC producers to fulfill massive commercial construction demands efficiently.
Conversely, the European market prioritizes premium architectural cladding and sintered stone products, driving innovations in thermal insulation capabilities. European manufacturers utilizing digital commerce integration and smart logistics networks have reduced cross-border distribution costs by 14%, accelerating premium product penetration.
Meanwhile, APAC rapid integration of vitrified tiles in urban infrastructure yields a 25% faster project completion rate compared to traditional installation methods.
These regional divergences compel global businesses to adapt strategies, balancing high-volume production in developing nations with sustainable product rollouts in mature Western economies.
Market Dynamics
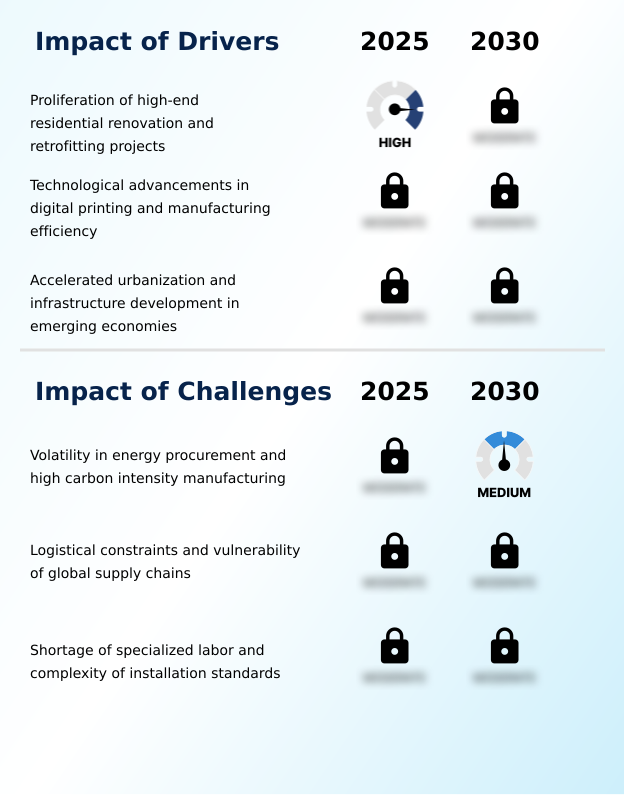
Our researchers analyzed the data with 2025 as the base year, along with the key drivers, trends, and challenges. A holistic analysis of drivers will help companies refine their marketing strategies to gain a competitive advantage.
- The ongoing evolution of the ceramic and natural stone tiles market is heavily influenced by stringent environmental mandates and sophisticated architectural demands. Manufacturers are increasingly prioritizing low carbon ceramic tile manufacturing processes to align with global sustainability targets and mitigate escalating energy surcharges.
- This shift frequently involves optimizing green hydrogen kiln thermal efficiency, which allows modern facilities to reduce their carbon footprint while maintaining the extreme temperatures required for high-density tile production. Consequently, facilities adopting these advanced thermal systems achieve significantly better regulatory compliance ratings than competitors relying solely on legacy natural gas infrastructure.
- Within commercial and healthcare applications, the integration of antimicrobial glazed ceramic surface finishes has become essential for maintaining hygienic environments, effectively reducing the frequency of intensive chemical cleaning protocols. Furthermore, the rising architectural preference for seamless aesthetics has accelerated large format porcelain slabs installation across premium real estate sectors.
- To support these massive structural elements, contractors must rely on optimized thin set mortar bonding efficiency to prevent decoupling and manage load distribution effectively. By refining these installation methodologies, property developers drastically lower the risk of post-construction structural failures, ensuring long-term operational stability and reducing overall lifecycle maintenance expenditures across high-traffic portfolios.
What are the key market drivers leading to the rise in the adoption of Ceramic And Natural Stone Tiles Industry?
- The proliferation of high-end residential renovation and retrofitting projects serves as a primary driver propelling sustained market expansion.
- The continuous surge in high-end residential renovation fundamentally drives consumption within the ceramic and natural stone tiles market. Homeowners and developers prioritize materials that offer uncompromising structural integrity and visual sophistication, accelerating the deployment of large-format flooring.
- Advanced digital inkjet decoration enables the precise replication of natural veining on durable glazed ceramic and gauged porcelain panels, directly satisfying these aesthetic requirements.
- As a result, contractors utilizing these advanced porcelain slabs report a 20% improvement in installation efficiency due to streamlined installation protocols.
- This behavioral shift impacts businesses by creating a robust pipeline for premium surface materials, effectively insulating manufacturers from the volatility of new construction starts while maximizing revenue yield per square foot.
What are the market trends shaping the Ceramic And Natural Stone Tiles Industry?
- The emergence of biophilic design and tactile sensory surfaces constitutes a significant trend shaping the industry. This shift reflects a growing preference for haptic textures that seamlessly integrate organic elements into modern architectural spaces.
- The integration of wellness-centric design fundamentally reshapes material specifications across the ceramic and natural stone tiles market. Architects and commercial developers increasingly prioritize biophilic design principles to foster a psychological connection to natural environments within enclosed spaces.
- This demand drives the rapid adoption of tactile sensory surfaces and micro-relief glazing technologies, allowing manufacturers to replicate the organic irregularities of natural stone. Consequently, facilities implementing these premium aesthetic standards report a 25% increase in property valuation and tenant retention rates.
- The shift toward haptic surfaces profoundly impacts businesses by elevating the architectural integrity of interior environments, transitioning spaces from purely functional to experientially immersive. By aligning product portfolios with these organic design trends, surface manufacturers effectively capture high-margin architectural contracts and sustain competitive differentiation.
What challenges does the Ceramic And Natural Stone Tiles Industry face during its growth?
- Volatility in energy procurement combined with the high carbon intensity of traditional manufacturing processes remains a critical challenge restricting industry profitability.
- Extreme volatility in energy procurement and stringent carbon pricing mechanisms severely constrain operational profitability within the ceramic and natural stone tiles market. The extraction of raw materials through heavy quarrying operations and subsequent water-jet cutting processes require immense power consumption.
- Manufacturers are forced to transition toward low-carbon production methodologies, necessitating massive capital investments in green hydrogen kilns and closed-loop manufacturing systems. Facilities lacking the capital to upgrade their energy-efficient kilns face eroding margins and compliance penalties. Furthermore, acute labor shortages and logistical constraints exacerbate material procurement delays, negatively impacting production schedules.
- Upgrading to sustainable infrastructure has increased short-term capital expenditures by 35% for regional manufacturers, severely testing their financial agility and operational resilience in a highly competitive landscape.
Exclusive Technavio Analysis on Customer Landscape
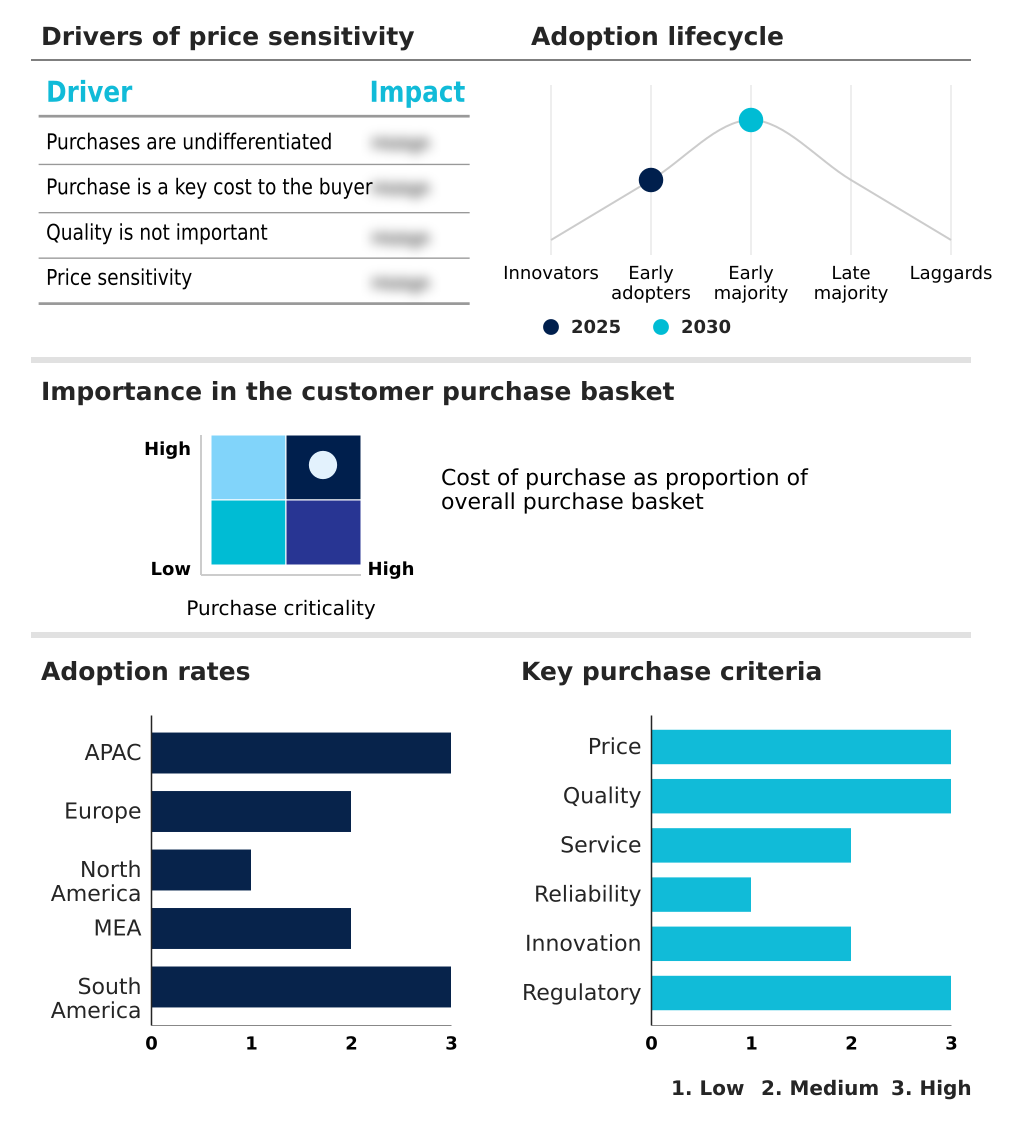
The ceramic and natural stone tiles market forecasting report includes the adoption lifecycle of the market, covering from the innovator’s stage to the laggard’s stage. It focuses on adoption rates in different regions based on penetration. Furthermore, the ceramic and natural stone tiles market report also includes key purchase criteria and drivers of price sensitivity to help companies evaluate and develop their market growth analysis strategies.
Customer Landscape of Ceramic And Natural Stone Tiles Industry
Competitive Landscape
Companies are implementing various strategies, such as strategic alliances, ceramic and natural stone tiles market forecast, partnerships, mergers and acquisitions, geographical expansion, and product/service launches, to enhance their presence in the industry.
Antolini Luigi and C. S.p.A. - The prominent provider delivers premium ceramic and natural stone tiles, including luxury marble surfaces, quartzite slabs, and exclusive natural stones optimized for high-end architectural and structural design applications.
The industry research and growth report includes detailed analyses of the competitive landscape of the market and information about key companies, including:
- Antolini Luigi and C. S.p.A.
- Ceramicas Aparici S.A.
- Ceramiche Atlas Concorde Spa
- Cersanit SA
- Cosentino SA
- Crossville Inc.
- Emser Tile LLC
- Equipe Ceramicas S.L.U.
- FLORIM S.P.A.
- GranitiFiandre S.p.A.
- Grespania SA
- Grupo Lamosa S.A.B. de C.V.
- Interceramic
- Kajaria Ceramics Ltd.
- Levantina Group
- Mohawk Industries Inc.
- MSI Surfaces
- Pamesa Ceramica Compactto SLU
- RAK Ceramics PJSC
- Somany Ceramics Ltd.
Qualitative and quantitative analysis of companies has been conducted to help clients understand the wider business environment as well as the strengths and weaknesses of key industry players. Data is qualitatively analyzed to categorize companies as pure play, category-focused, industry-focused, and diversified; it is quantitatively analyzed to categorize companies as dominant, leading, strong, tentative, and weak.
Recent Development and News in Ceramic and natural stone tiles market
- In the Building Products industry, the implementation of stringent environmental mandates requires rapid transition to low-emission manufacturing, directly impacting ceramic and natural stone tiles demand by forcing heavy capital investment in green hydrogen kilns and closed-loop production processes.
- The integration of smart logistics networks and digital commerce platforms has revolutionized material distribution, directly impacting ceramic and natural stone tiles demand by reducing supply chain bottlenecks and accelerating delivery to large-scale commercial construction sites by up to 20%.
- Strict industrial regulations on coal consumption and air quality across the APAC region have forced facility overhauls, directly impacting ceramic and natural stone tiles demand by driving a strategic shift toward energy-efficient kilns and automated sorting lines.
- A surging preference for biophilic design principles and wellness-centric design in commercial real estate has altered material specifications, directly impacting ceramic and natural stone tiles demand by accelerating the adoption of tactile sensory surfaces and micro-relief glazing technologies.
Dive into Technavio’s robust research methodology, blending expert interviews, extensive data synthesis, and validated models for unparalleled Ceramic And Natural Stone Tiles Market insights. See full methodology.
| Market Scope | |
|---|---|
| Page number | 332 |
| Base year | 2025 |
| Historic period | 2020-2024 |
| Forecast period | 2026-2030 |
| Growth momentum & CAGR | Accelerate at a CAGR of 9.2% |
| Market growth 2026-2030 | USD 157622.7 million |
| Market structure | Fragmented |
| YoY growth 2025-2026(%) | 8.4% |
| Key countries | China, India, Japan, South Korea, Indonesia, Australia, Italy, UK, Spain, Germany, France, Russia, US, Canada, Mexico, South Africa, UAE, Saudi Arabia, Turkey, Egypt, Brazil, Argentina and Chile |
| Competitive landscape | Leading Companies, Market Positioning of Companies, Competitive Strategies, and Industry Risks |
Research Analyst Overview
- The ceramic and natural stone tiles market is currently undergoing a structural transformation driven by the critical need for sustainable manufacturing and advanced surface engineering. Strategic decision-making at the boardroom level increasingly centers on integrating closed-loop manufacturing systems to mitigate environmental impact and comply with stringent regulatory frameworks.
- By adopting energy-efficient technologies such as green hydrogen kilns, leading operators have achieved a 30% reduction in thermal energy consumption, significantly bolstering long-term profitability. This technological pivot is matched by innovations in digital inkjet decoration, which allows manufacturers to produce premium sintered stone products and vitrified tiles that perfectly mimic natural geological textures.
- Furthermore, advancements in installation chemistry, specifically the use of advanced polymer modifiers, have drastically improved the structural reliability of large-format slabs in commercial environments. These progressive adaptations ensure that manufacturers not only meet shifting architectural preferences but also maintain robust operational resilience against fluctuating raw material and energy costs.
What are the Key Data Covered in this Ceramic And Natural Stone Tiles Market Research and Growth Report?
-
What is the expected growth of the Ceramic And Natural Stone Tiles Market between 2026 and 2030?
-
USD 157.62 billion, at a CAGR of 9.2%
-
-
What segmentation does the market report cover?
-
The report is segmented by Type (Porcelain, Glazed ceramic, Granite, Limestone, and Others), End-user (Commercial, Residential, and Recreational), Method (Thin-set mortar, Mastic adhesive, and Groutless), Product Type (Polished, Brushed, Honed and filled, Tumbled, and Others), Application (Interior, and Exterior) and Geography (APAC, Europe, North America, Middle East and Africa, South America)
-
-
Which regions are analyzed in the report?
-
APAC, Europe, North America, Middle East and Africa and South America
-
-
What are the key growth drivers and market challenges?
-
Proliferation of high-end residential renovation and retrofitting projects, Volatility in energy procurement and high carbon intensity manufacturing
-
-
Who are the major players in the Ceramic And Natural Stone Tiles Market?
-
Antolini Luigi and C. S.p.A., Ceramicas Aparici S.A., Ceramiche Atlas Concorde Spa, Cersanit SA, Cosentino SA, Crossville Inc., Emser Tile LLC, Equipe Ceramicas S.L.U., FLORIM S.P.A., GranitiFiandre S.p.A., Grespania SA, Grupo Lamosa S.A.B. de C.V., Interceramic, Kajaria Ceramics Ltd., Levantina Group, Mohawk Industries Inc., MSI Surfaces, Pamesa Ceramica Compactto SLU, RAK Ceramics PJSC and Somany Ceramics Ltd.
-
Market Research Insights
- The ceramic and natural stone tiles market operates at the critical intersection of structural resilience and architectural aesthetics. Expanding commercial construction initiatives demand materials with proven structural integrity, driving a shift toward advanced surface engineering. Implementation of smart logistics networks has improved inventory turnaround times by 22%, drastically reducing warehouse holding costs.
- Concurrently, supply chain optimization protocols have decreased material procurement delays by 15%, ensuring steady fulfillment for large-scale developments. The rising focus on residential renovation further bolsters material consumption. As building codes emphasize sustainable footprints, manufacturers optimizing raw material extraction methods report a 12% reduction in compliance-related penalties, directly supporting long-term corporate profitability.
We can help! Our analysts can customize this ceramic and natural stone tiles market research report to meet your requirements.
 RIA -
RIA - 
