Cladding Market Size 2024-2028
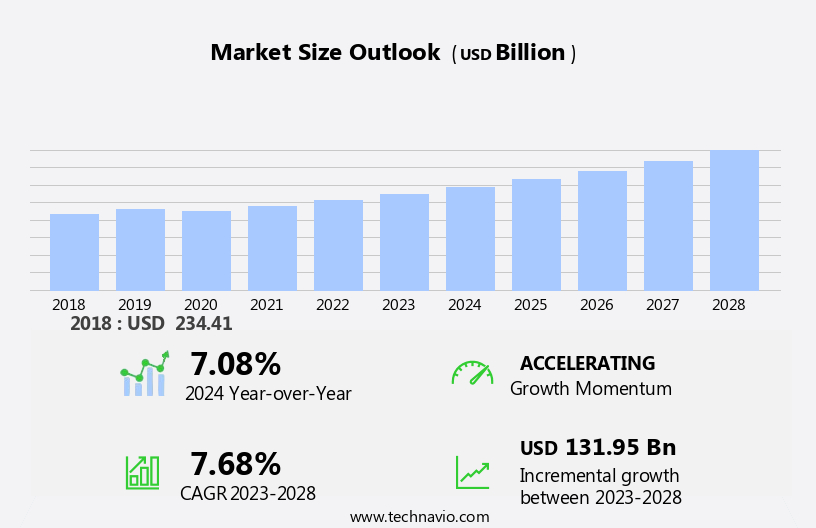
The cladding market size is forecast to increase by USD 131.95 billion at a CAGR of 7.68% between 2023 and 2028.
- North America's market is experiencing robust growth, fueled by a boom in construction and infrastructure development. The rising demand for energy-efficient and sustainable building solutions is accelerating the adoption of advanced cladding technologies. Additionally, the market is seeing a rise in mergers and acquisitions, as industry leaders strive to expand their presence and strengthen their product portfolios.
- However, the market is also faced with the challenge of volatile input costs, particularly for raw materials such as aluminum and steel, which can impact profitability. To mitigate this risk, manufacturers are exploring alternative materials and sourcing strategies to maintain competitiveness. Overall, the market in North America is poised for steady growth, driven by a combination of factors including construction activity, sustainability trends, and strategic M&A.
What will be the Cladding Market Size During the Forecast Period?
- The market continues to evolve, driven by various factors that shape its growth and development. This article provides an insightful exploration of the current market dynamics, focusing on key aspects such as trends, regulations, and innovations. Cladding trends reflect the evolving preferences and demands of the construction industry. Energy efficiency is a significant trend, with manufacturers and architects increasingly focusing on cladding solutions that reduce energy consumption and improve insulation. Sustainability is another trend, as cladding materials derived from renewable resources gain popularity. Fire resistance and durability are also crucial trends, with cladding systems designed to meet stringent safety standards and withstand extreme weather conditions.
- Moreover, the cladding market is a dynamic and innovative industry that offers a wide range of solutions for building exterior design and protection. From energy-efficient terracotta cladding and sleek vinyl cladding to fire-resistant fiber cement cladding and elegant metal cladding, there's a cladding option for every budget and aesthetic preference. Cladding installation and maintenance are crucial aspects of this market, ensuring the longevity and performance of cladding systems. Energy efficiency and compliance with cladding regulations are key considerations, with many suppliers offering warranties for peace of mind. Cladding design is a critical factor, with options like brick cladding, brick-effect cladding, and brick-slip cladding providing a traditional look, while modern cladding innovations offer sleek, contemporary designs. Cladding materials also vary, with options like fiber cement, vinyl, and metal cladding suitable for different climates and building types, including commercial buildings, historic buildings, and residential properties. Cladding performance and durability are essential, with many cladding systems offering long lifespans and low maintenance requirements. Cladding for different budgets is also available, making it an accessible solution for a wide range of projects. Cladding suppliers offer a range of solutions, from design and installation to ongoing maintenance and repair, ensuring that buildings remain protected and attractive for years to come.
- Consequently, cladding materials continue to evolve, with a range of options available to meet various applications and requirements. Exterior cladding materials, such as terracotta, vinyl, fiber cement, brick, metal, and others, each offer unique benefits in terms of aesthetics, durability, and cost. Lightweight cladding systems are gaining popularity due to their ease of installation and reduced construction time. Cladding solutions cater to diverse applications, from residential and commercial buildings to exterior building renovations and new constructions. Cladding applications range from façade design to insulation and weather protection. Cladding solutions must balance aesthetics, functionality, and cost to meet the needs of various projects.
How is this market segmented and which is the largest segment?
The market research report provides comprehensive data (region-wise segment analysis), with forecasts and estimates in "USD billion" for the period 2024-2028, as well as historical data from 2018-2022 for the following segments.
- Type
- Steel
- Aluminum
- Composite materials
- Fiber cement
- Others
- End-user
- Residential
- Industrial
- Commercial
- Offices
- Institutional
- Geography
- APAC
- China
- India
- Japan
- North America
- US
- Europe
- Germany
- Middle East and Africa
- South America
- APAC
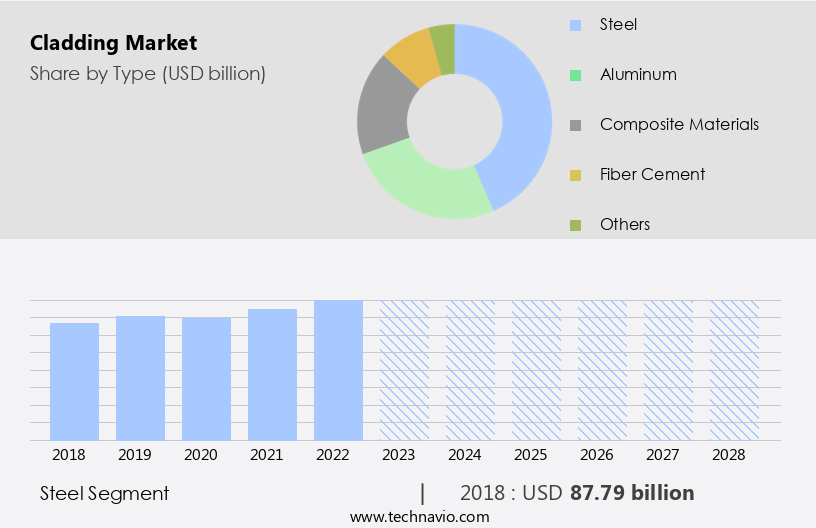
By Type Insights
- The steel segment is estimated to witness significant growth during the forecast period.
The steel segment, categorized by type, held the largest market share in the market in 2023. This dominance is attributed to the increasing use of steel for cladding applications, particularly in industries such as chemical processing, oil refining, offshore oil production and exploration, and power generation. Industrial steels, including carbon steel, are susceptible to corrosion, making them less suitable for applications involving corrosive fluids, high temperatures, and internal pressures.
However, cladding steel, specifically designed for these conditions, is a popular choice. The demand for cladding steel is on the rise in these industries due to the growing investment in infrastructure and the need for heat-resistant and durable solutions. The use of steel panels and vinyl boards for cladding houses is also increasing, but industrial applications account for a larger market share.
Get a glance at the market report of share of various segments Request Free Sample
The Steel segment was valued at USD 87.79 billion in 2018 and showed a gradual increase during the forecast period.
Regional Analysis
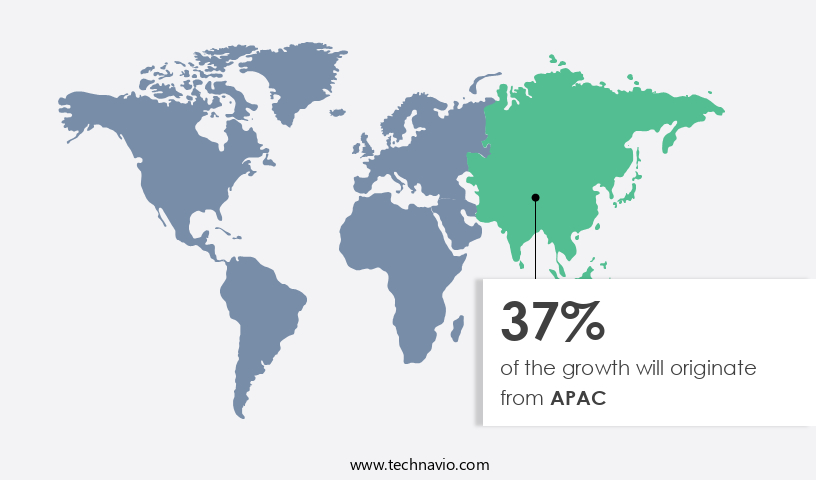
- APAC is estimated to contribute 37% to the growth of the global market during the forecast period.
Technavio's analysts have elaborately explained the regional trends and drivers that shape the market during the forecast period.
For more insights on the market share of various regions Request Free Sample
In the Asia Pacific region, the expansion of construction and industrial sectors, coupled with a heightened focus on energy efficiency and building safety, is fueling the growth of the market. The demand for energy-efficient buildings is on the rise due to increasing economic development, urbanization, and consumer trends. This trend is particularly noticeable in residential construction, where the need for advanced materials and energy-efficient solutions is driving market growth. Additionally, stakeholders in the construction industry are prioritizing green building practices, durability, and compliance with building codes to create safe and sustainable structures. These factors are expected to significantly contribute to the growth of the market in the Asia Pacific region over the forecast period.
Market Dynamics
Our researchers analyzed the data with 2023 as the base year, along with the key drivers, trends, and challenges. A holistic analysis of drivers will help companies refine their marketing strategies to gain a competitive advantage.
What are the key market drivers leading to the rise in adoption of Cladding Market ?
Growing construction and infrastructure development activities is the key driver of the market.
- The market is experiencing significant growth due to increasing construction spending and industrial development. The recovery of the global economy has led to a surge in new residential and commercial projects, as indicated by a 10.9% increase in construction spending in 2022 compared to the previous year, according to the Associated General Contractors of America. Consumer trends towards sustainable buildings and energy efficiency are also driving the demand for cladding systems. Building safety and durability are crucial considerations, leading to the adoption of non-combustible materials and regulations. Consumer behavior is shifting towards eco-friendly and weather-resistant cladding solutions, such as prefabricated systems, facade cladding, and roof panels made of metal, vinyl, boards, stone, ceramic, and wood.
The use of agricultural waste, recycled paper, and other sustainable materials is also gaining popularity. The focus on energy efficiency and environmental concerns is leading to the development of energy-efficient buildings, which require high-performance cladding systems. Building codes and standards of living continue to evolve, requiring cladding systems to meet specific performance criteria, such as chemical resistance, heat resistance, wind resistance, and aesthetic appearance. Product differentiation through computer-aided manufacturing and digital technologies is also a key trend in the market. End-user concentration in urban areas and the operational life and maintenance requirements of cladding systems are also important factors influencing market dynamics.
The market is expected to continue growing due to the increasing disposable incomes and the demand for long-lasting and sustainable solutions. Regulations and cleaning properties are also crucial factors, as are weather impact and the need for energy-efficient buildings. Overall, the market is a dynamic and evolving industry that is responding to changing consumer needs and regulatory requirements.
What are the market trends shaping the Cladding Market?
Increasing merger and acquisition activities is the upcoming trend in the market.
- The market is experiencing significant growth due to various factors. Industrial development and urban regeneration projects are driving construction spending, leading to an increase in demand for cladding systems. Consumer trends toward sustainable buildings and energy efficiency are also influencing the market. Building safety concerns and regulations are pushing the use of durable, non-combustible materials, such as metal, stone, and ceramic, for facade cladding. Moreover, consumer behavior is shifting towards eco-friendly and weather-resistant cladding solutions, including prefabricated panels made from agricultural waste, recycled paper, and vinyl boards. Product differentiation through computer-aided manufacturing and digital technologies is also a key trend in the market.
Regulations and standards of living are also impacting the market, with end-user concentration in urban areas leading to a focus on maintenance and operational life. Building codes and energy efficiency requirements are also driving the use of energy-efficient, chemical-resistant, and heat-resistant cladding systems. Environmental concerns and consumer behavior are also leading to the use of recycled materials and eco-friendly designs. Weather impact is also a significant factor, with the need for cladding systems that can withstand extreme temperatures, wind, and other weather conditions. Acquisitions and mergers are common in the market, with companies acquiring other players to expand their product offerings, increase distribution, and enhance product reach.
What challenges does Cladding Market face during the growth?
Volatile input cost is a key challenge affecting market growth.
- The market is influenced by various factors that impact the cost and demand for cladding systems. One significant factor is the instability of raw material prices, which can significantly affect the production cost for cladding service providers. Major raw materials, such as stainless steel, iron, and plastic, are subject to price fluctuations due to inflation, supply and demand, and availability. For instance, the price of benchmark steel decreased by approximately 17% in March 2022 compared to the previous year. These price fluctuations directly impact companies' contracts and, consequently, the overall fabrication costing. To mitigate this risk, many cladding service providers enter into long-term contracts with suppliers.
Consumer trends, such as a focus on building safety, durability, energy efficiency, and environmental concerns, influence the demand for cladding systems. Sustainable buildings, urban regeneration, and industrial development are key areas of growth. Prefabricated cladding systems, facade cladding, and roof panels are popular choices due to their aesthetic appearance, longevity, and non-load bearing properties. Energy-efficient buildings, which are eco-friendly and cost-effective, are in high demand. Building codes and regulations also impact the market, as they set standards for performance, chemical resistance, and weather impact. Consumer behavior, disposable incomes, and standards of living are additional factors that influence the market.
End-user concentration in urban areas and the operational life and maintenance requirements of cladding systems are also critical considerations. Cladding systems come in various materials, including metal, vinyl, boards, stone, ceramic, and wood. Each material has unique properties, such as heat resistance, wind resistance, and cleaning properties. Digital technologies, such as computer-aided manufacturing, are transforming the industry by improving product differentiation and reducing production costs. Recycled materials, such as agricultural waste and recycled paper, are gaining popularity due to their environmental benefits.
Exclusive Customer Landscape
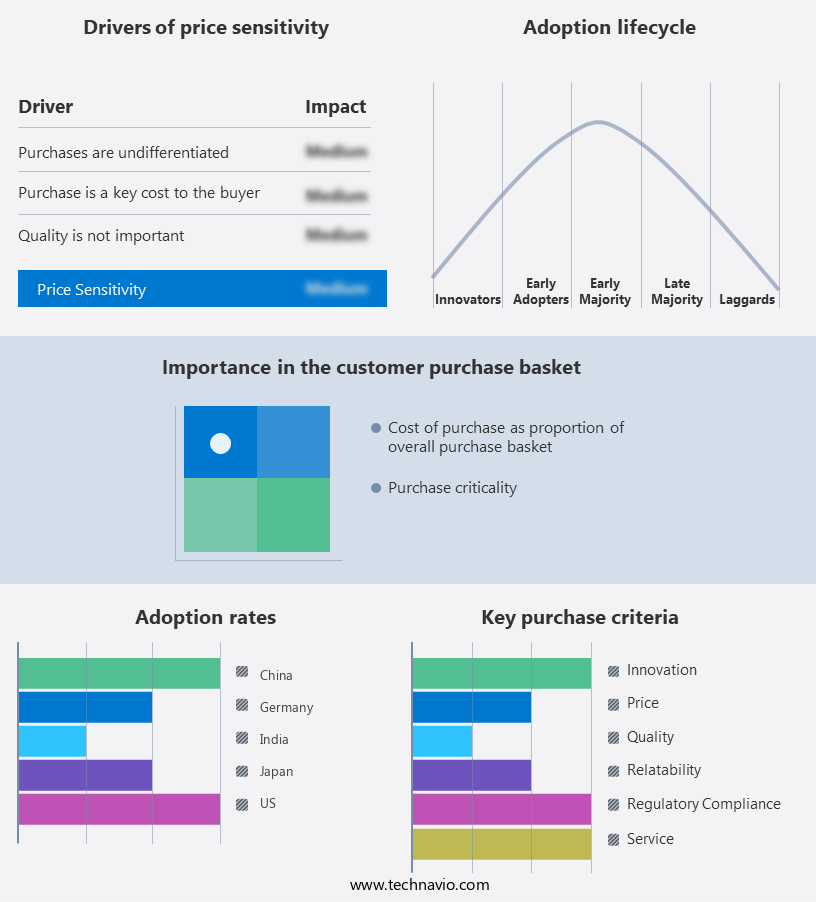
The market forecasting report includes the adoption lifecycle of the market, covering from the innovator's stage to the laggard's stage. It focuses on adoption rates in different regions based on penetration. Furthermore, the market report also includes key purchase criteria and drivers of price sensitivity to help companies evaluate and develop their market growth analysis strategies.
Customer Landscape
Key Companies & Market Insights
Companies are implementing various strategies, such as strategic alliances, market forecast, partnerships, mergers and acquisitions, geographical expansion, and product/service launches, to enhance their presence in the market.
The market research and growth report includes detailed analyses of the competitive landscape of the market and information about key companies, including:
- ArcelorMittal SA
- Arconic Corp.
- CA Group Ltd.
- Carea Ltd.
- CGL Facades.
- Compagnie de Saint Gobain
- Coverworld UK Ltd.
- CSR Ltd.
- Dumaplast
- Etex NV
- GB Architectural Cladding Products Ltd.
- James Hardie Industries plc
- Kingspan Group Plc
- Louisiana Pacific Corp.
- Middle East Insulation LLC
- Nichiha Corp.
- ROCKWOOL International AS
- Swisspearl Group AG
- Tata Sons Pvt. Ltd.
- Trespa International B.V
Qualitative and quantitative analysis of companies has been conducted to help clients understand the wider business environment as well as the strengths and weaknesses of key market players. Data is qualitatively analyzed to categorize companies as pure play, category-focused, industry-focused, and diversified; it is quantitatively analyzed to categorize companies as dominant, leading, strong, tentative, and weak.
Research Analyst Overview
The global cladding systems market is witnessing significant growth, driven by various market dynamics. These dynamics include industrial development, consumer trends, building safety, durability, energy efficiency, environmental concerns, and urban regeneration. Industrial development and construction spending are key factors driving the growth of the cladding systems market. Industrialization and urbanization have led to an increase in infrastructure development, which in turn has resulted in a surge in demand for cladding systems. Construction spending is expected to continue to rise, particularly in emerging economies, providing ample opportunities for market growth.
Consumer trends, such as the demand for sustainable buildings and eco-friendly materials, are also influencing the cladding systems market. Consumers are increasingly conscious of their environmental impact and are looking for ways to reduce their carbon footprint. This has led to a growing demand for cladding systems made from recycled materials, such as agricultural waste, recycled paper, and stone. Building safety and durability are crucial factors in the cladding systems market. With the increasing focus on building safety and regulations, cladding systems that meet stringent safety standards and offer high durability are in high demand. Building codes require cladding systems to be fire-resistant, weather-resistant, and able to withstand extreme temperatures and wind.
Energy efficiency is another major market driver. Energy-efficient buildings are becoming increasingly popular, and cladding systems that offer insulation and reduce energy consumption are in high demand. Cladding systems made from energy-efficient materials, such as metal, vinyl, and boards, are gaining popularity due to their ability to reduce heating and cooling costs. Environmental concerns and consumer behavior are also influencing the cladding systems market. Consumers are increasingly concerned about the environmental impact of their buildings and are looking for eco-friendly cladding systems. This has led to a growing demand for sustainable cladding systems made from renewable materials, such as wood and ceramic.
Product differentiation and digital technology are also key market trends. Prefabricated cladding systems and facade cladding are gaining popularity due to their ease of installation and cost-effectiveness. Computer-aided manufacturing and digital design tools are being used to create customized cladding systems, offering product differentiation and improved performance. Regulations and disposable incomes are other market factors. Regulations governing the use of combustible materials in cladding systems are becoming stricter, leading to a shift towards non-combustible materials. Standards of living and disposable incomes are also influencing consumer behavior, with consumers willing to pay a premium for high-quality, durable cladding systems.
The operational life and maintenance of cladding systems are also important considerations. Cladding systems that offer long operational life and require minimal maintenance are in high demand. This has led to a growing trend towards the use of chemical-resistant and heat-resistant materials. In conclusion, the global cladding systems market is driven by various market dynamics, including industrial development, consumer trends, building safety, durability, energy efficiency, environmental concerns, and urban regeneration. These factors are shaping the future of the market and providing ample opportunities for growth.
|
Market Scope |
|
|
Report Coverage |
Details |
|
Page number |
166 |
|
Base year |
2023 |
|
Historic period |
2018-2022 |
|
Forecast period |
2024-2028 |
|
Growth momentum & CAGR |
Accelerate at a CAGR of 7.68% |
|
Market growth 2024-2028 |
USD 131.95 billion |
|
Market structure |
Fragmented |
|
YoY growth 2023-2024(%) |
7.08 |
|
Key countries |
US, China, India, Japan, and Germany |
|
Competitive landscape |
Leading Companies, Market Positioning of Companies, Competitive Strategies, and Industry Risks |
What are the Key Data Covered in this Market Research and Growth Report?
- CAGR of the market during the forecast period
- Detailed information on factors that will drive the market growth and forecasting between 2024 and 2028
- Precise estimation of the size of the market and its contribution of the market in focus to the parent market
- Accurate predictions about upcoming market growth and trends and changes in consumer behaviour
- Growth of the market across APAC, North America, Europe, Middle East and Africa, and South America
- Thorough analysis of the market's competitive landscape and detailed information about companies
- Comprehensive analysis of factors that will challenge the growth of market companies
We can help! Our analysts can customize this market research report to meet your requirements. Get in touch
 RIA -
RIA - 
