Chip-on-wafer-on-substrate (cowos) Market Size 2025-2029
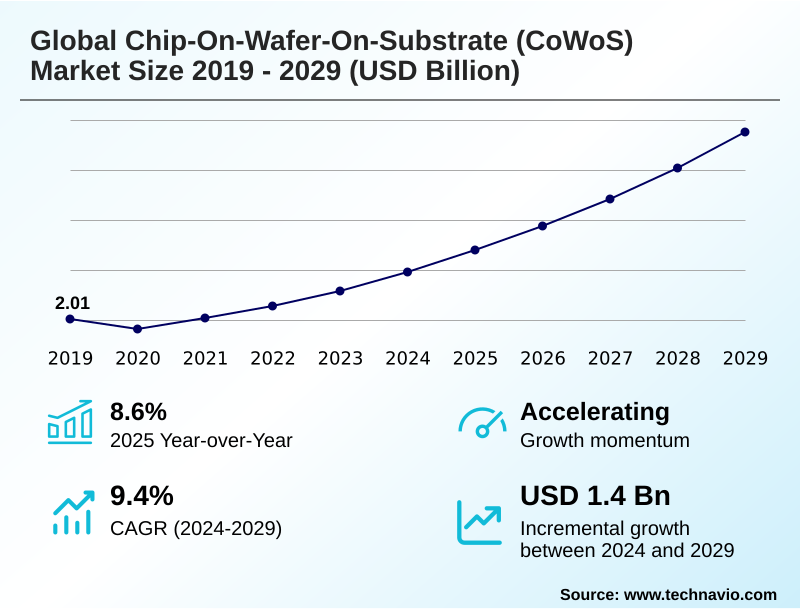
The chip-on-wafer-on-substrate (cowos) market size is valued to increase by USD 1.40 billion, at a CAGR of 9.4% from 2024 to 2029. Explosive demand from artificial intelligence and high performance computing will drive the chip-on-wafer-on-substrate (cowos) market.
Major Market Trends & Insights
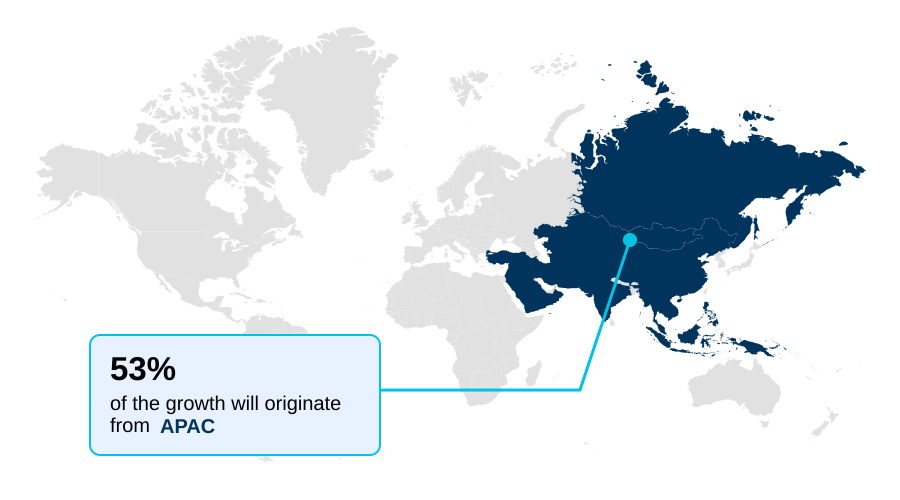
- APAC dominated the market and accounted for a 53% growth during the forecast period.
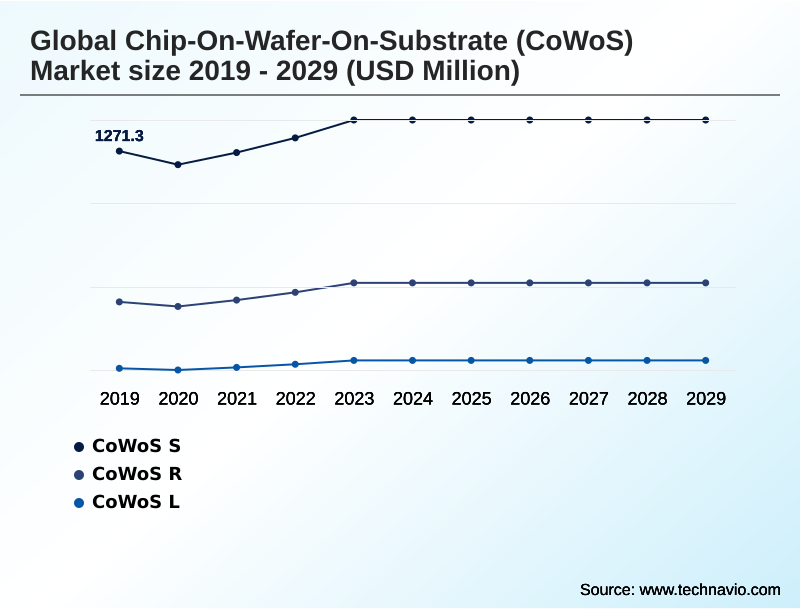
- By Technology - CoWoS S segment was valued at USD 1.42 billion in 2023
- By Component - GPU segment accounted for the largest market revenue share in 2023
Market Size & Forecast
- Market Opportunities: USD 1.88 billion
- Market Future Opportunities: USD 1.40 billion
- CAGR from 2024 to 2029 : 9.4%
Market Summary
- The chip-on-wafer-on-substrate (cowos) market is defined by a critical industry transition away from monolithic chip designs toward advanced packaging. This shift is driven by the insatiable demand for processing power from AI and high-performance computing applications, which traditional packaging cannot support. The technology enables heterogeneous integration, allowing specialized chiplets to be combined into a single, powerful system-in-package.
- For instance, a fabless semiconductor company designing a next-generation AI accelerator must weigh the trade-offs between different packaging options to manage costs while meeting extreme bandwidth requirements. This involves selecting the right interposer technology and balancing performance with manufacturability. However, the market faces significant constraints, including limited production capacity at key foundries and the high manufacturing cost of silicon interposers.
- These bottlenecks can delay product rollouts and limit the availability of high-end hardware. Concurrently, the industry is innovating with new materials and techniques, such as organic substrates and hybrid bonding, to overcome current limitations and pave the way for future performance gains in data centers and beyond.
What will be the Size of the Chip-on-wafer-on-substrate (cowos) Market during the forecast period?
Get Key Insights on Market Forecast (PDF) Get Free Sample
How is the Chip-on-wafer-on-substrate (cowos) Market Segmented?
The chip-on-wafer-on-substrate (cowos) industry research report provides comprehensive data (region-wise segment analysis), with forecasts and estimates in "USD million" for the period 2025-2029, as well as historical data from 2019-2023 for the following segments.
- Technology
- CoWoS S
- CoWoS R
- CoWoS L
- Component
- GPU
- CPU
- FPGA
- Others
- End-user
- Cloud service providers
- Enterprises
- Government organizations
- Others
- Geography
- APAC
- South Korea
- China
- Japan
- North America
- US
- Canada
- Mexico
- Europe
- Germany
- France
- Italy
- South America
- Brazil
- Argentina
- Middle East and Africa
- Israel
- UAE
- Saudi Arabia
- Rest of World (ROW)
- APAC
By Technology Insights
The cowos s segment is estimated to witness significant growth during the forecast period.
CoWoS-S technology, foundational to the chip-on-wafer-on-substrate (cowos) market, utilizes a monolithic silicon interposer to achieve unparalleled performance in high-value applications.
This architecture employs through-silicon vias to create a high-density silicon-based interconnect fabric, enabling tens of thousands of connections between semiconductor dies. The resulting interconnect density is critical for demanding hpc processor integration and ai accelerator packaging.
While this approach offers superior electrical characteristics for hardware used in financial analytics platforms and signal intelligence systems, it is constrained by a fundamental package size limitation imposed by lithography reticle dimensions.
This makes it a premium solution, often reserved for flagship products where performance outweighs the higher silicon interposer cost, rather than for cost-sensitive high-end consumer electronics.
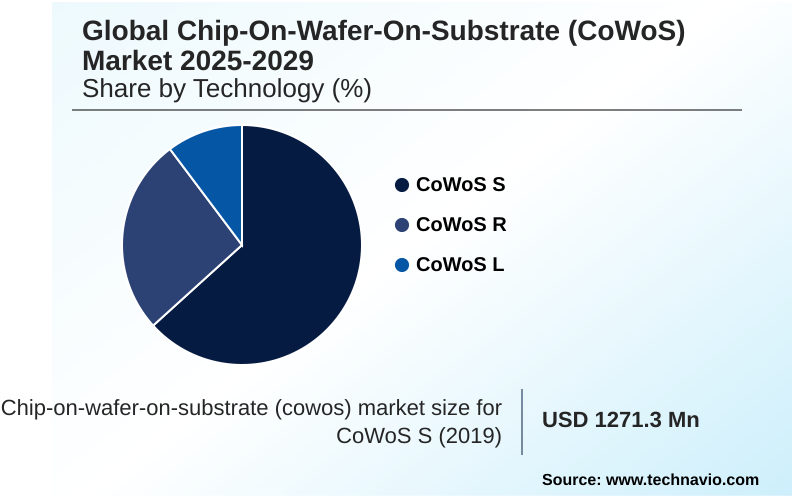
The CoWoS S segment was valued at USD 1.42 billion in 2023 and showed a gradual increase during the forecast period.
Regional Analysis
APAC is estimated to contribute 53% to the growth of the global market during the forecast period.Technavio’s analysts have elaborately explained the regional trends and drivers that shape the market during the forecast period.
See How Chip-on-wafer-on-substrate (cowos) Market Demand is Rising in APAC Get Free Sample
The geographic landscape is dominated by two key regions. APAC serves as the manufacturing backbone, accounting for over 53% of the market's incremental growth and hosting the majority of advanced packaging and 2.5d packaging facilities.
This region's expertise in high-volume production is critical for the global supply of components used in telecommunications infrastructure. In contrast, North America, contributing over 28% of growth, is the hub for design and consumption.
It is home to leading fabless companies that design networking asics and custom ai accelerators.
These firms pioneer innovations like local silicon interconnect and advanced die-to-die interconnect techniques, driving demand for multi-die systems used in national security electronics and aerospace and defense systems.
Market Dynamics
Our researchers analyzed the data with 2024 as the base year, along with the key drivers, trends, and challenges. A holistic analysis of drivers will help companies refine their marketing strategies to gain a competitive advantage.
- Navigating the complexities of the chip-on-wafer-on-substrate (cowos) market requires deep technical analysis of competing platforms and methodologies. A thorough cowos vs emib performance comparison reveals trade-offs in density and scalability, influencing architectural decisions for next-generation products.
- The cost analysis of cowos-r packaging is crucial for projects where budget is a primary constraint, as the reliability of organic substrate interposers must be weighed against their economic benefits. For cutting-edge designs, engineers face significant thermal challenges in 3d ic stacking, necessitating advanced solutions like liquid cooling for high-power socs.
- The choice of high bandwidth memory integration techniques is pivotal for optimizing latency in 2.5d integration. As chiplet architecture for ai processors becomes standard, the power delivery network design for socs grows in complexity. Innovations like foveros direct hybrid bonding technology promise to revolutionize interconnects, though the impact of hybrid bonding on bandwidth must be carefully modeled.
- Simultaneously, addressing large interposer manufacturing yield issues and the high manufacturing cost of silicon interposers remains a focus. Strategic decisions around the supply chain for advanced packaging are now as important as the technology itself, with system-in-package testing methodologies becoming more sophisticated to ensure the reliability of these intricate systems.
- The ongoing debate over 2.5d vs 3d packaging for gpus continues as the industry pushes for scaling beyond reticle size limitations, making heterogeneous integration for server cpus a key enabler.
What are the key market drivers leading to the rise in the adoption of Chip-on-wafer-on-substrate (cowos) Industry?
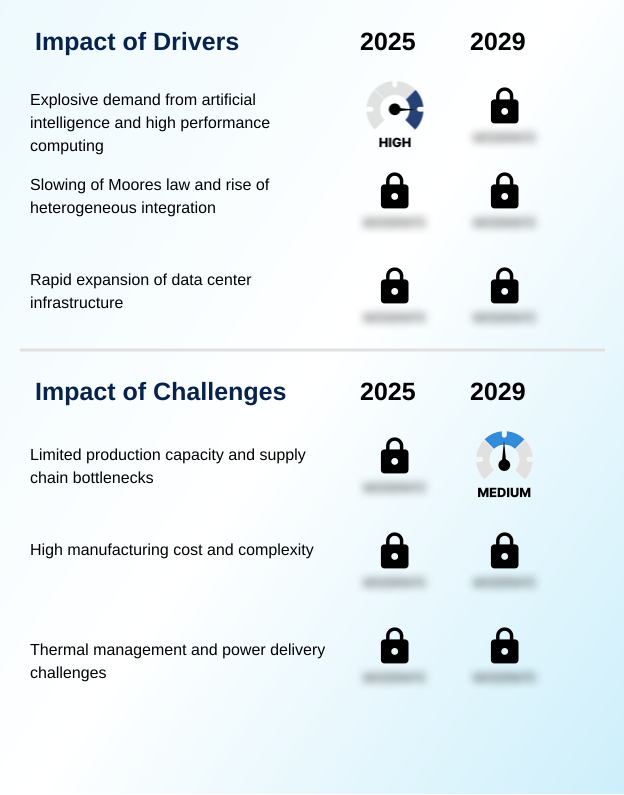
- Explosive demand from artificial intelligence and high-performance computing serves as the key driver for market growth.
- The chip-on-wafer-on-substrate (cowos) market is propelled by the industry's pivot to heterogeneous integration as monolithic scaling faces economic limits. This shift fosters a robust chiplet ecosystem, allowing a flexible chiplet-based design approach.
- Designers can mix and match logic dies manufactured on different advanced process nodes, optimizing for both performance and cost.
- This is crucial for high-performance computing, where server-grade cpus for data center hardware can be assembled more efficiently, improving yields by over 15% compared to large monolithic chips.
- The expansion of cloud service provider hardware and the computational demands of autonomous vehicle computing further accelerate this trend, making advanced packaging a cornerstone of modern wafer fabrication and semiconductor innovation.
What are the market trends shaping the Chip-on-wafer-on-substrate (cowos) Industry?
- A key market trend is the diversification of packaging solutions to include organic substrates. This strategy addresses cost-performance trade-offs for a broader range of applications.
- A prominent trend is the diversification toward solutions using an organic substrate, creating a more tiered product portfolio. Variants employing a redistribution layer on an organic interposer offer a cost-effective alternative for applications like data center acceleration and 5g network infrastructure, enabling larger packages than silicon allows. This supports the creation of complex multi-die systems for next-generation gpus.
- Furthermore, the advanced packaging roadmap is evolving toward true 3d stacking with hybrid bonding, which promises an order-of-magnitude increase in interconnects. This leap is essential for future exascale computing systems and could enable performance levels required for immersive augmented reality devices, with adoption improving power efficiency by up to 50% in stacked configurations.
What challenges does the Chip-on-wafer-on-substrate (cowos) Industry face during its growth?
- Limited production capacity and supply chain bottlenecks present a key challenge affecting industry growth.
- Significant challenges confront the chip-on-wafer-on-substrate (cowos) market, including the high silicon interposer cost and complexity of the through-silicon via process, which limit applications beyond high-margin sectors. These multi-chip modules dissipate immense heat, with some designs in high-frequency trading hardware consuming over 1kW, demanding sophisticated thermal management solutions that can increase system costs by 20%.
- Designing a robust power delivery network for these system in package designs is a major hurdle. Furthermore, reliance on a few outsourced semiconductor assembly and test providers creates supply bottlenecks. These constraints affect deployment in cost-sensitive industrial automation hardware and smart factory technology, slowing adoption for applications like machine vision systems in enterprise data centers.
Exclusive Technavio Analysis on Customer Landscape
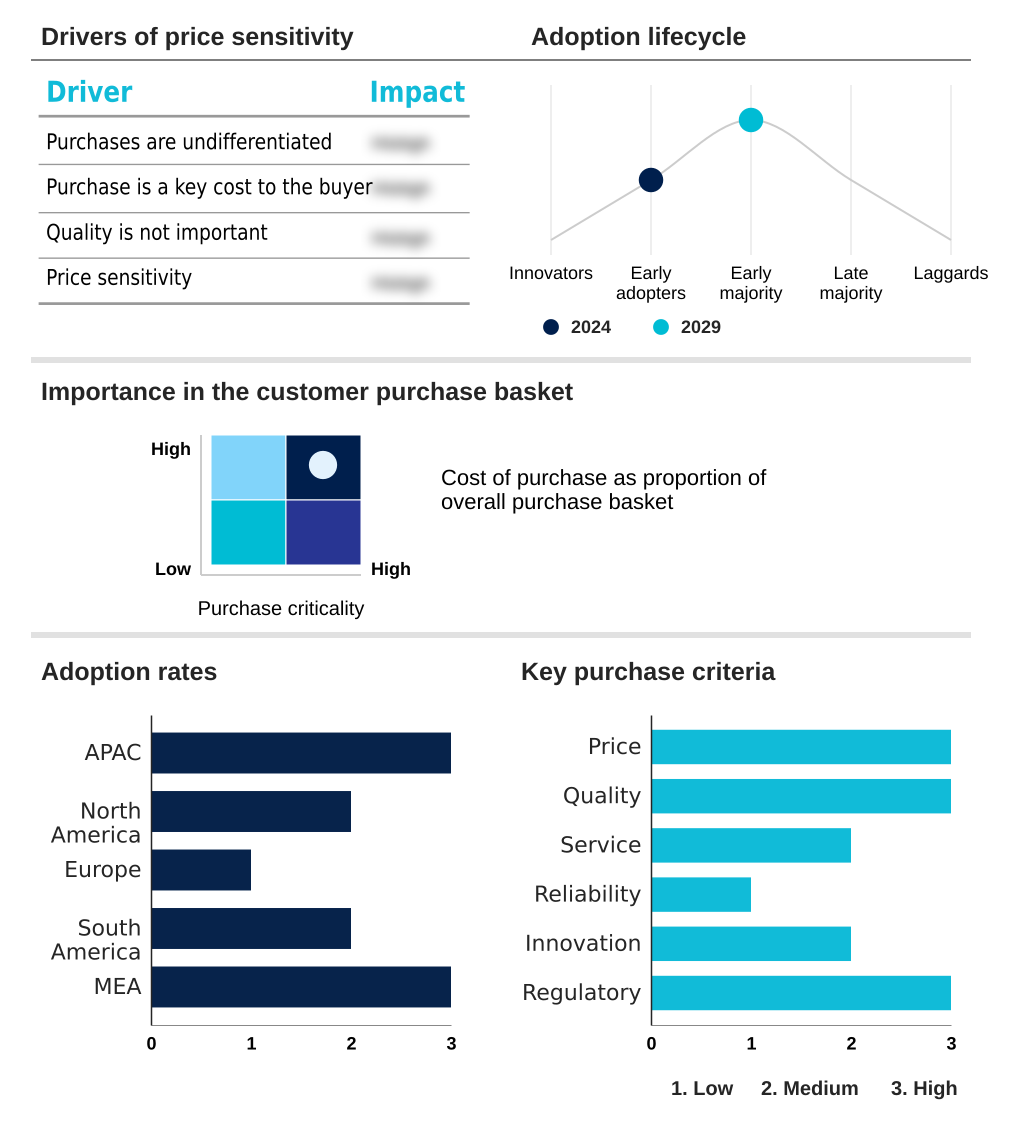
The chip-on-wafer-on-substrate (cowos) market forecasting report includes the adoption lifecycle of the market, covering from the innovator’s stage to the laggard’s stage. It focuses on adoption rates in different regions based on penetration. Furthermore, the chip-on-wafer-on-substrate (cowos) market report also includes key purchase criteria and drivers of price sensitivity to help companies evaluate and develop their market growth analysis strategies.
Customer Landscape of Chip-on-wafer-on-substrate (cowos) Industry
Competitive Landscape
Companies are implementing various strategies, such as strategic alliances, chip-on-wafer-on-substrate (cowos) market forecast, partnerships, mergers and acquisitions, geographical expansion, and product/service launches, to enhance their presence in the industry.
Advanced Micro Devices Inc. - Key offerings include a comprehensive chip-on-wafer-on-substrate (cowos) packaging portfolio, encompassing CoWoS-S, CoWoS-R, and CoWoS-L variants for high-performance computing applications.
The industry research and growth report includes detailed analyses of the competitive landscape of the market and information about key companies, including:
- Advanced Micro Devices Inc.
- Alchip Technologies Ltd.
- Amkor Technology Inc.
- ASE Technology Holding Co. Ltd.
- GlobalFoundries
- Intel Corp.
- Jiangsu Changdian Technology Co. Ltd.
- Micron Technology Inc.
- Powertech Technology Inc.
- Samsung Electronics Co. Ltd.
- Sanechips Co. Ltd.
- SK hynix Co. Ltd.
- Taiwan Semiconductor Co. Ltd.
- Tongfu Microelectronics Co.
- United Microelectronics Corp.
Qualitative and quantitative analysis of companies has been conducted to help clients understand the wider business environment as well as the strengths and weaknesses of key industry players. Data is qualitatively analyzed to categorize companies as pure play, category-focused, industry-focused, and diversified; it is quantitatively analyzed to categorize companies as dominant, leading, strong, tentative, and weak.
Recent Development and News in Chip-on-wafer-on-substrate (cowos) market
- In August, 2024, TSMC placed urgent orders for new CoWoS-related equipment to double its production capacity, addressing the surge in AI-driven demand.
- In November, 2024, Amkor Technology Inc. announced a major expansion of its advanced packaging portfolio, focusing on high-density fan-out and 2.5D organic substrate technologies.
- In January, 2025, Microsoft Corp. announced a multi-billion dollar investment to expand its cloud and AI infrastructure in France, directly increasing demand for CoWoS-based hardware.
- In April, 2025, Intel Corp. detailed its advanced packaging roadmap, emphasizing the deployment of its hybrid bonding-based Foveros Direct technology in next-generation products.
Dive into Technavio’s robust research methodology, blending expert interviews, extensive data synthesis, and validated models for unparalleled Chip-on-wafer-on-substrate (cowos) Market insights. See full methodology.
| Market Scope | |
|---|---|
| Page number | 301 |
| Base year | 2024 |
| Historic period | 2019-2023 |
| Forecast period | 2025-2029 |
| Growth momentum & CAGR | Accelerate at a CAGR of 9.4% |
| Market growth 2025-2029 | USD 1402.3 million |
| Market structure | Fragmented |
| YoY growth 2024-2025(%) | 8.6% |
| Key countries | Taiwan, South Korea, China, Japan, Singapore, Australia, US, Canada, Mexico, Germany, France, Italy, UK, The Netherlands, Spain, Brazil, Chile, Argentina, Israel, UAE, Saudi Arabia, South Africa and Egypt |
| Competitive landscape | Leading Companies, Market Positioning of Companies, Competitive Strategies, and Industry Risks |
Research Analyst Overview
- The chip-on-wafer-on-substrate (cowos) market is fundamentally reshaping system-on-chip integration through advanced packaging. The core technology relies on a silicon interposer with through-silicon vias to enable heterogeneous integration, a critical departure from monolithic scaling. This facilitates a vibrant chiplet ecosystem where a chiplet-based design allows for the assembly of various semiconductor dies and logic dies into complex multi-chip modules.
- The die-to-die interconnect is managed via a silicon bridge or local silicon interconnect, with the entire assembly forming a system in package. Boardroom decisions are now heavily influenced by the advanced packaging roadmap, as the high silicon interposer cost of CoWoS-S, which offers the highest interconnect density, forces a strategic evaluation of alternatives.
- These include solutions built on an organic substrate with a redistribution layer, such as CoWoS-R, or high-density fan-out technologies. The choice between a silicon-based interconnect and an organic interposer directly impacts product cost and performance, with some hybrid approaches scaling to package sizes over three times larger than traditional methods.
- Managing the power delivery network and implementing effective thermal management solutions are paramount challenges, driving innovation in both the through-silicon via process and wafer fabrication. This complex landscape has elevated the strategic importance of outsourced semiconductor assembly and test partners.
What are the Key Data Covered in this Chip-on-wafer-on-substrate (cowos) Market Research and Growth Report?
-
What is the expected growth of the Chip-on-wafer-on-substrate (cowos) Market between 2025 and 2029?
-
USD 1.40 billion, at a CAGR of 9.4%
-
-
What segmentation does the market report cover?
-
The report is segmented by Technology (CoWoS S, CoWoS R, and CoWoS L), Component (GPU, CPU, FPGA, and Others), End-user (Cloud service providers, Enterprises, Government organizations, and Others) and Geography (APAC, North America, Europe, South America, Middle East and Africa)
-
-
Which regions are analyzed in the report?
-
APAC, North America, Europe, South America and Middle East and Africa
-
-
What are the key growth drivers and market challenges?
-
Explosive demand from artificial intelligence and high performance computing, Limited production capacity and supply chain bottlenecks
-
-
Who are the major players in the Chip-on-wafer-on-substrate (cowos) Market?
-
Advanced Micro Devices Inc., Alchip Technologies Ltd., Amkor Technology Inc., ASE Technology Holding Co. Ltd., GlobalFoundries, Intel Corp., Jiangsu Changdian Technology Co. Ltd., Micron Technology Inc., Powertech Technology Inc., Samsung Electronics Co. Ltd., Sanechips Co. Ltd., SK hynix Co. Ltd., Taiwan Semiconductor Co. Ltd., Tongfu Microelectronics Co. and United Microelectronics Corp.
-
Market Research Insights
- The dynamics of the chip-on-wafer-on-substrate (cowos) market are shaped by the computational needs of data center hardware and custom AI accelerators. The move toward disaggregated designs for server-grade cpus and networking asics has made advanced packaging essential. Adoption of these techniques can improve manufacturing yields by up to 20% for large, complex processors that would otherwise suffer from defects.
- Furthermore, the integration of high bandwidth memory directly with logic dies provides a performance uplift exceeding 10x in memory bandwidth compared to off-package memory solutions. This is critical for cloud service provider hardware supporting AI training workloads.
- The strategic importance of this technology is also growing in specialized fields such as autonomous vehicle computing and 5G network infrastructure, where low latency and high performance are paramount for real-time processing and system reliability.
We can help! Our analysts can customize this chip-on-wafer-on-substrate (cowos) market research report to meet your requirements.
 RIA -
RIA - 
