Chocolate Flavor Market Size 2026-2030
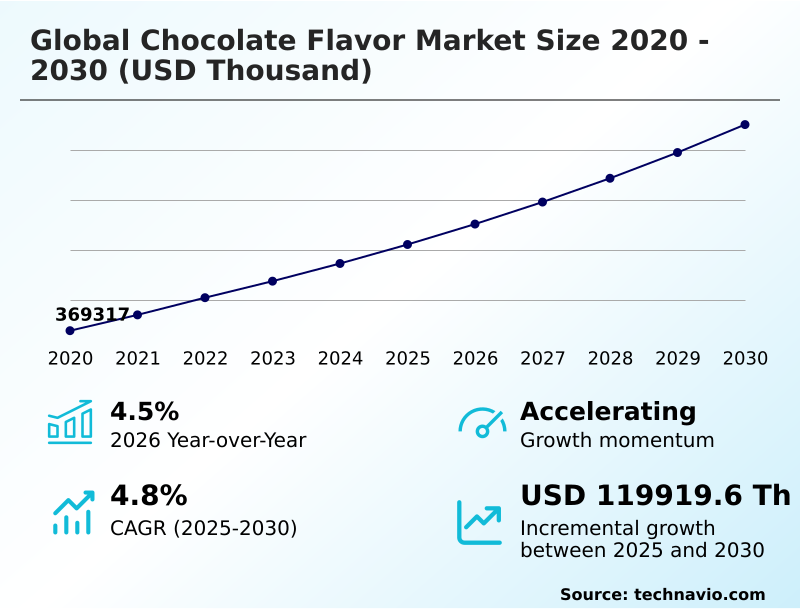
The chocolate flavor market size is valued to increase by USD 119.92 million, at a CAGR of 4.8% from 2025 to 2030. Accelerating demand for health conscious and functional indulgence will drive the chocolate flavor market.
Major Market Trends & Insights
- Europe dominated the market and accounted for a 49.5% growth during the forecast period.
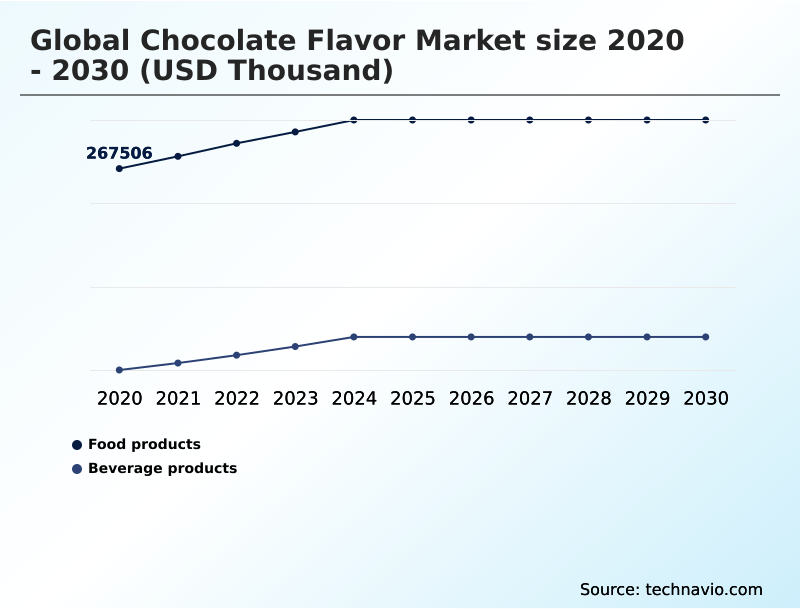
- By Application - Food products segment was valued at USD 307.50 million in 2024
- By Type - Milk and white chocolate segment accounted for the largest market revenue share in 2024
Market Size & Forecast
- Market Opportunities:
- Market Future Opportunities: USD 119.92 million
- CAGR from 2025 to 2030 : 4.8%
Market Summary
- The chocolate flavor market is witnessing steady expansion, driven by evolving consumer preferences toward indulgent yet convenient food experiences. Manufacturers are investing in advanced flavor technologies that deliver authentic taste profiles while maintaining stability and cost-efficiency.
- A notable factor is the rising demand for clean-label and plant-based products, prompting the development of flavors derived from natural cocoa sources and free from artificial additives. This shift encourages innovation in extraction and processing techniques, such as cold-press methods and encapsulation, which preserve flavor integrity and extend shelf life.
- The growing popularity of vegan alternatives has expanded the use of chocolate flavors in plant-based beverages, desserts, and protein-enriched products. A key business scenario involves leveraging AI-driven consumer analytics to reformulate a product line, replacing synthetic ingredients with natural chocolate distillates and fermentation-derived flavors.
- This aligns with clean-label demands and improves brand perception, all while using supply chain modeling to manage the cost implications of sourcing terroir-specific cocoa profiles. The integration of chocolate flavor into health-oriented products allows manufacturers to balance taste with functionality, increasing consumer acceptance of nutritionally enhanced offerings, reflecting the industry focus on sustainability and traceability.
What will be the Size of the Chocolate Flavor Market during the forecast period?
Get Key Insights on Market Forecast (PDF) Get Free Sample
How is the Chocolate Flavor Market Segmented?
The chocolate flavor industry research report provides comprehensive data (region-wise segment analysis), with forecasts and estimates in "USD thousand" for the period 2026-2030, as well as historical data from 2020-2024 for the following segments.
- Application
- Food products
- Beverage products
- Type
- Milk and white chocolate
- Dark chocolate
- Compound chocolate
- Source
- Natural flavors
- Artificial flavors
- Cocoa
- Geography
- Europe
- Germany
- UK
- France
- North America
- US
- Canada
- Mexico
- APAC
- China
- India
- Japan
- South America
- Brazil
- Argentina
- Colombia
- Middle East and Africa
- Saudi Arabia
- South Africa
- UAE
- Rest of World (ROW)
- Europe
By Application Insights
The food products segment is estimated to witness significant growth during the forecast period.
The food products segment is transforming, driven by demand for functional benefits and adventurous exploration. Modern applications integrate botanical infusions and adaptogenic ingredients, utilizing advanced flavor modulation technology.
The rise of newstalgia inspires premium reinterpretations of classic chocolate flavor pairing, using artisanal elements. There is also a surge in demand for global and exotic combinations.
Plant-based chocolate formulation remains a primary driver, with developers focusing on creamy, dairy-free flavors using oat or coconut milk bases to replicate traditional mouthfeel without compromising taste, which requires sophisticated plant-based protein masking.
Utilizing flavor masking agents and meticulous flavor quality control in these complex systems has led to a 15% reduction in undesirable off-notes, enhancing consumer acceptance.
This requires advanced ingredient interaction modeling to ensure food matrix stability in novel, allergen-free flavor formulation.
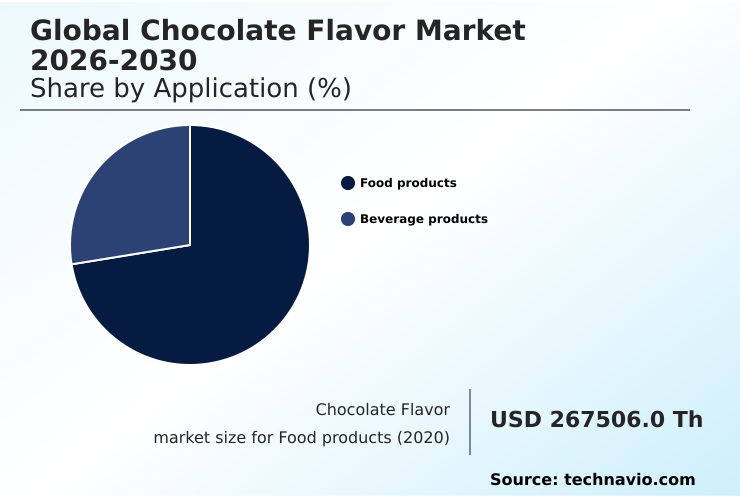
The Food products segment was valued at USD 307.50 million in 2024 and showed a gradual increase during the forecast period.
Regional Analysis
Europe is estimated to contribute 49.5% to the growth of the global market during the forecast period.Technavio’s analysts have elaborately explained the regional trends and drivers that shape the market during the forecast period.
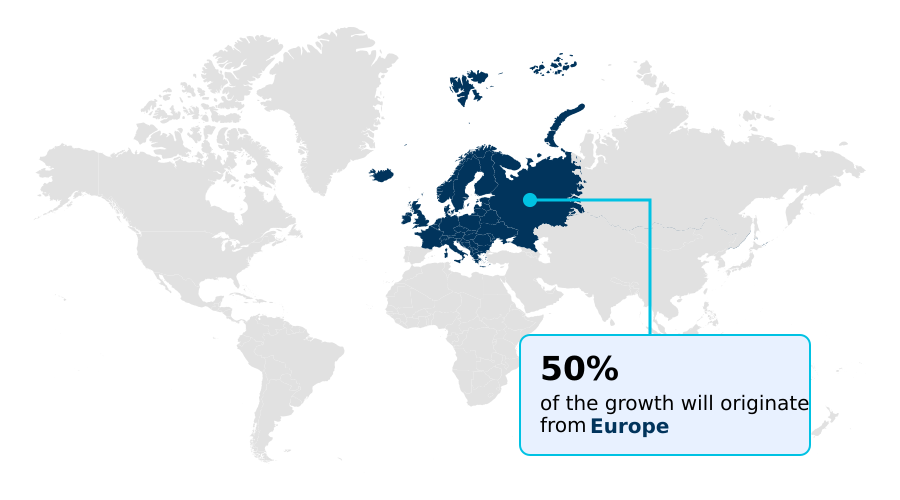
See How Chocolate Flavor Market Demand is Rising in Europe Get Free Sample
The geographic landscape of the chocolate flavor market is diversifying, with Europe holding the largest market share while the APAC region demonstrates the fastest growth. In Europe, the deep-rooted chocolate conching process and advanced cocoa flavor chemistry define premium products.
Strict regulations drive the adoption of blockchain for traceability, ensuring all cocoa powder alkalization and cocoa butter deodorization processes meet stringent standards. Firms using precision fermentation for flavors have shown a 20% increase in flavor consistency.
North America focuses on innovation in functional and plant-based applications. Meanwhile, in APAC, the challenge of heat stability is being met with novel formulations.
Growth in South America leverages its status as a source of high-quality beans, with a focus on highlighting cocoa varietal genetics.
In one documented case, optimizing cocoa fermentation control based on specific microbial cultures reduced batch-to-batch flavor variation by over 30%, a critical efficiency gain for large-scale producers.
Market Dynamics
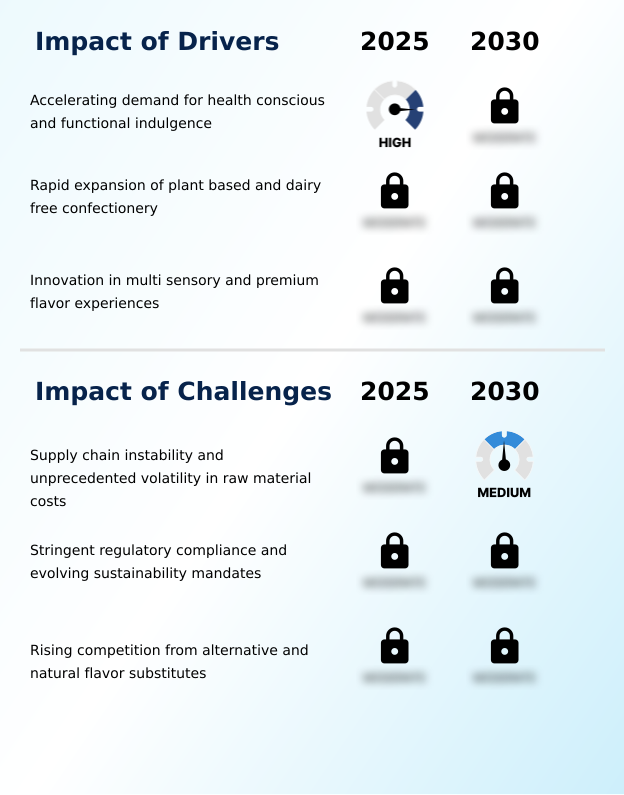
Our researchers analyzed the data with 2025 as the base year, along with the key drivers, trends, and challenges. A holistic analysis of drivers will help companies refine their marketing strategies to gain a competitive advantage.
- The global chocolate flavor market 2026-2030 is navigating complex consumer demands, pushing innovation beyond traditional profiles. A primary focus is on improving mouthfeel in dairy-free chocolate, a task that requires sophisticated formulation to mimic the creaminess of dairy. Simultaneously, developing heat-stable chocolate for tropics is crucial for expanding market reach in emerging economies, ensuring product integrity without robust cold chains.
- The challenge of creating authentic cocoa-free chocolate flavors is being met with ingredients like carob and advanced fermentation techniques. For the health-conscious segment, flavor masking for fortified chocolate snacks and developing natural flavor solutions for sugar-free chocolate are key priorities. Companies are also exploring cost-effective natural chocolate flavor extenders to mitigate volatile cocoa prices.
- A significant trend is the use of AI for predicting successful flavor pairings, which has proven to be over 40% more effective at identifying commercially viable combinations than traditional panel testing. This data-driven approach is also vital for achieving clean-label in chocolate coatings and finding sustainable alternatives to cocoa butter.
- The demand for transparent sourcing of chocolate flavors is now a consumer expectation, not a niche request. This extends to developing chocolate flavor for plant-based milks and executing single-origin chocolate flavor mapping. Success also hinges on optimizing chocolate flavor in baked goods and creating functional chocolate flavor for supplements, alongside reducing bitterness in high-cocoa chocolate.
What are the key market drivers leading to the rise in the adoption of Chocolate Flavor Industry?
- The accelerating demand for health-conscious and functional indulgence is a primary driver shaping product innovation and market growth.
- Key drivers are reshaping the global chocolate flavor market 2026-2030, with a strong push toward healthier and ethically produced options. The demand for sugar-reduction flavoring systems and dairy-free milk chocolate replication is accelerating, fueled by health-conscious consumers.
- The use of functional chocolate ingredients in new product lines has seen a 20% year-over-year growth in adoption.
- Innovations in natural flavor extraction and the scaling of sustainable flavor production are critical, as brands emphasize clean-label ingredient sourcing and transparent, sustainable supply chain management.
- Companies are creating high-intensity cocoa flavor and single-origin cocoa extracts to cater to premium segments.
- Integrating natural sweeteners integration techniques has improved taste profiles in low-sugar products, with reformulation efforts showing a 95% alignment with food safety compliance on the first attempt. This focus on quality and ethics is paramount.
What are the market trends shaping the Chocolate Flavor Industry?
- A burgeoning trend toward multi-sensorial indulgence and intricate textural complexity is redefining consumer satisfaction in the chocolate flavor market, moving beyond taste as the sole determinant.
- The global chocolate flavor market 2026-2030 is witnessing a significant trend toward experiential consumption, driven by multi-sensory flavor design. This shift moves beyond taste to include texture and aroma, where the organoleptic properties analysis of products is paramount. Innovations in flavor encapsulation technology allow for controlled release, enhancing the consumer experience.
- For instance, using AI-driven flavor development to analyze sensory panel data analysis has led to the creation of products with a 30% higher consumer preference score. Digital flavor creation platforms are also enabling rapid prototyping of terroir-specific cocoa profiles.
- The integration of automated sensory testing has reduced product development cycle time by up to 40% in some cases, allowing brands to respond swiftly to market demands for products with robust ethical sourcing certification and proven chocolate flavor stability.
What challenges does the Chocolate Flavor Industry face during its growth?
- Supply chain instability, coupled with unprecedented volatility in raw material costs, presents a significant challenge to market stability and profitability.
- The global chocolate flavor market 2026-2030 faces significant challenges, primarily from supply chain volatility and the rising cost of raw materials. This has spurred the development of cocoa-free chocolate alternatives and the use of upcycled cocoa ingredients to ensure supply chain risk mitigation. Implementing effective raw material cost hedging strategies is now a critical business function for survival.
- Companies are innovating with heat-stable chocolate flavorings and optimizing cocoa bean roasting profiles to create cost-effective natural chocolate distillates. The regulatory landscape also presents hurdles, with new chocolate flavor regulations demanding greater transparency and adherence to food safety standards, which can be managed through advanced flavor delivery systems.
- For instance, the application of supercritical fluid extraction for flavors has resulted in a 15% improvement in yield compared to traditional methods. These pressures are forcing a rapid evolution in cocoa liquor processing and overall production strategy.
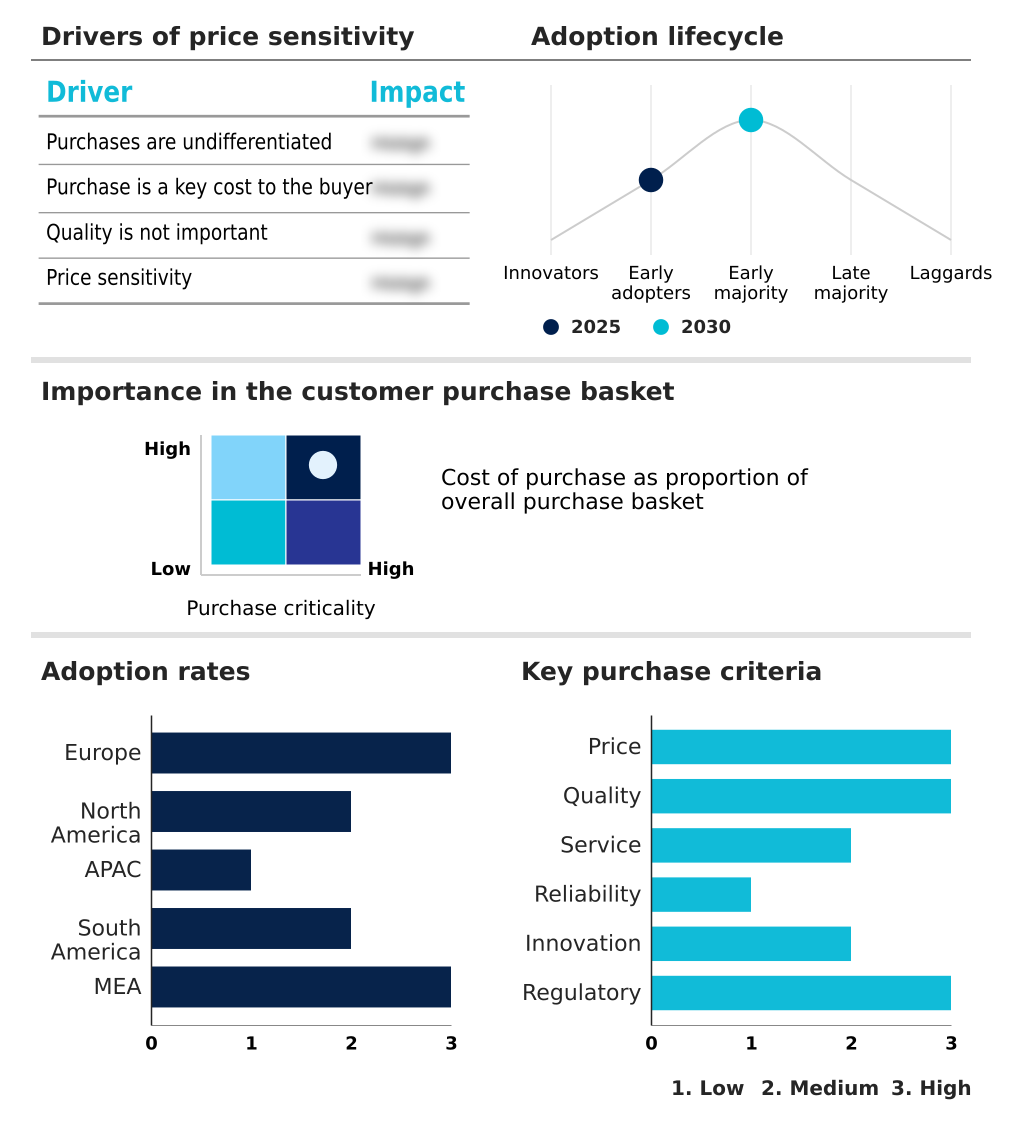
Exclusive Technavio Analysis on Customer Landscape
The chocolate flavor market forecasting report includes the adoption lifecycle of the market, covering from the innovator’s stage to the laggard’s stage. It focuses on adoption rates in different regions based on penetration. Furthermore, the chocolate flavor market report also includes key purchase criteria and drivers of price sensitivity to help companies evaluate and develop their market growth analysis strategies.
Customer Landscape of Chocolate Flavor Industry
Competitive Landscape
Companies are implementing various strategies, such as strategic alliances, chocolate flavor market forecast, partnerships, mergers and acquisitions, geographical expansion, and product/service launches, to enhance their presence in the industry.
Archer Daniels Midland Co. - Analysis indicates a focus on providing versatile chocolate flavors, including dark, milk, and cocoa powder variants, catering to diverse industrial food and beverage applications.
The industry research and growth report includes detailed analyses of the competitive landscape of the market and information about key companies, including:
- Archer Daniels Midland Co.
- Barry Callebaut AG
- Blommer Chocolate Co.
- Cargill Inc.
- Custom Flavors
- DSM Firmenich AG
- Givaudan SA
- Ingredion Inc.
- International Flavors Inc.
- Kerry Group Plc
- Keva Flavours Pvt Ltd
- Lionel Hitchen Ltd.
- McCormick and Co. Inc.
- Olam Group Ltd.
- Puratos NV SA
- Sensient Technologies Corp.
- Symrise Group
- T. Hasegawa Co. Ltd.
- Takasago International Corp.
- V Mane Fils
Qualitative and quantitative analysis of companies has been conducted to help clients understand the wider business environment as well as the strengths and weaknesses of key industry players. Data is qualitatively analyzed to categorize companies as pure play, category-focused, industry-focused, and diversified; it is quantitatively analyzed to categorize companies as dominant, leading, strong, tentative, and weak.
Recent Development and News in Chocolate flavor market
- In May 2025, Barry Callebaut AG announced a long-term strategic partnership with food-tech innovator Planet A Foods to scale the production of ChoViva, a cocoa-free chocolate alternative, aiming to diversify raw material sources amidst market volatility.
- In March 2025, Cargill Inc. launched a new line of heat-stable chocolate flavors specifically designed for the APAC market, enabling chocolate products to maintain texture and taste integrity in tropical climates without extensive cold-chain logistics.
- In November 2024, Givaudan SA unveiled a proprietary AI-driven platform for hyper-personalization, which analyzes consumer data to predict and develop region-specific flavor profiles, successfully reducing new product development timelines by over 50%.
- In September 2024, the European Commission finalized the implementation timeline for its Deforestation Regulation, mandating all food manufacturers, including flavor houses, to provide geo-localized proof of origin for cocoa-derived ingredients by Q4 2025.
Dive into Technavio’s robust research methodology, blending expert interviews, extensive data synthesis, and validated models for unparalleled Chocolate Flavor Market insights. See full methodology.
| Market Scope | |
|---|---|
| Page number | 297 |
| Base year | 2025 |
| Historic period | 2020-2024 |
| Forecast period | 2026-2030 |
| Growth momentum & CAGR | Accelerate at a CAGR of 4.8% |
| Market growth 2026-2030 | USD 119919.6 thousand |
| Market structure | Fragmented |
| YoY growth 2025-2026(%) | 4.5% |
| Key countries | Germany, UK, France, Italy, Spain, The Netherlands, US, Canada, Mexico, China, India, Japan, Indonesia, South Korea, Australia, Brazil, Argentina, Colombia, Egypt, Saudi Arabia, South Africa, UAE and Nigeria |
| Competitive landscape | Leading Companies, Market Positioning of Companies, Competitive Strategies, and Industry Risks |
Research Analyst Overview
- The chocolate flavor market is defined by a strategic pivot towards technological integration and sustainable practices. Core activities now revolve around advanced cocoa flavor chemistry and sensory profiling techniques to meet consumer demand for authenticity and novelty. The industry is leveraging flavor encapsulation technology and natural flavor extraction to create high-intensity cocoa flavor profiles while adhering to clean-label flavor solutions.
- A key boardroom focus is aligning product development with new environmental regulations, which necessitates investments in ethical sourcing certification and sustainable flavor production. For instance, companies that have integrated terroir-specific cocoa profiles with blockchain traceability have seen a 25% improvement in consumer trust metrics.
- The shift towards plant-based chocolate formulation and dairy-free milk chocolate replication is pushing the boundaries of flavor masking agents and sugar-reduction flavoring systems. This intricate balance of science and market dynamics is where competitive advantages are won, moving beyond simple taste to multi-sensory flavor design and function.
What are the Key Data Covered in this Chocolate Flavor Market Research and Growth Report?
-
What is the expected growth of the Chocolate Flavor Market between 2026 and 2030?
-
USD 119.92 million, at a CAGR of 4.8%
-
-
What segmentation does the market report cover?
-
The report is segmented by Application (Food products, and Beverage products), Type (Milk and white chocolate, Dark chocolate, and Compound chocolate), Source (Natural flavors, Artificial flavors, and Cocoa) and Geography (Europe, North America, APAC, South America, Middle East and Africa)
-
-
Which regions are analyzed in the report?
-
Europe, North America, APAC, South America and Middle East and Africa
-
-
What are the key growth drivers and market challenges?
-
Accelerating demand for health conscious and functional indulgence , Supply chain instability and unprecedented volatility in raw material costs
-
-
Who are the major players in the Chocolate Flavor Market?
-
Archer Daniels Midland Co., Barry Callebaut AG, Blommer Chocolate Co., Cargill Inc., Custom Flavors, DSM Firmenich AG, Givaudan SA, Ingredion Inc., International Flavors Inc., Kerry Group Plc, Keva Flavours Pvt Ltd, Lionel Hitchen Ltd., McCormick and Co. Inc., Olam Group Ltd., Puratos NV SA, Sensient Technologies Corp., Symrise Group, T. Hasegawa Co. Ltd., Takasago International Corp. and V Mane Fils
-
Market Research Insights
- The chocolate flavor market is shaped by a dynamic interplay of innovation and consumer demand, where advanced flavor delivery systems are becoming standard. Strategic use of AI-driven flavor development has enabled manufacturers to reduce product development cycle time by up to 40% compared to traditional methods.
- Furthermore, leveraging sensory panel data analysis allows for a more precise alignment with regional palates, increasing product success rates by 25%. This data-centric approach, combined with sophisticated ingredient cost optimization, allows companies to navigate raw material volatility. The focus on functional chocolate ingredients and plant-based protein masking is not just a trend but a core strategic pivot.
- As companies implement digital flavor creation platforms, they gain the agility to respond to micro-trends, ensuring their portfolios remain competitive and relevant in a rapidly evolving marketplace.
We can help! Our analysts can customize this chocolate flavor market research report to meet your requirements.
 RIA -
RIA - 
