Citizen Services AI Market Analysis, Size, and Forecast 2026-2030: North America (US, Canada, and Mexico), APAC (China, Japan, and India), Europe (Germany, UK, and France), Middle East and Africa (Saudi Arabia, UAE, and South Africa), South America (Brazil and Argentina), and Rest of World (ROW)

Citizen Services AI Market Analysis, Size, and Forecast 2026-2030:
North America (US, Canada, and Mexico), APAC (China, Japan, and India), Europe (Germany, UK, and France), Middle East and Africa (Saudi Arabia, UAE, and South Africa), South America (Brazil and Argentina), and Rest of World (ROW)

Published: Apr 2026 316 Pages SKU: IRTNTR80733

Market Overview at a Glance

$36.63 B
Market Opportunity
27.5%
CAGR 2025 - 2030
38%
North America Growth
$4.48 B
Machine learning segment 2024

Citizen Services AI Market Size 2026-2030

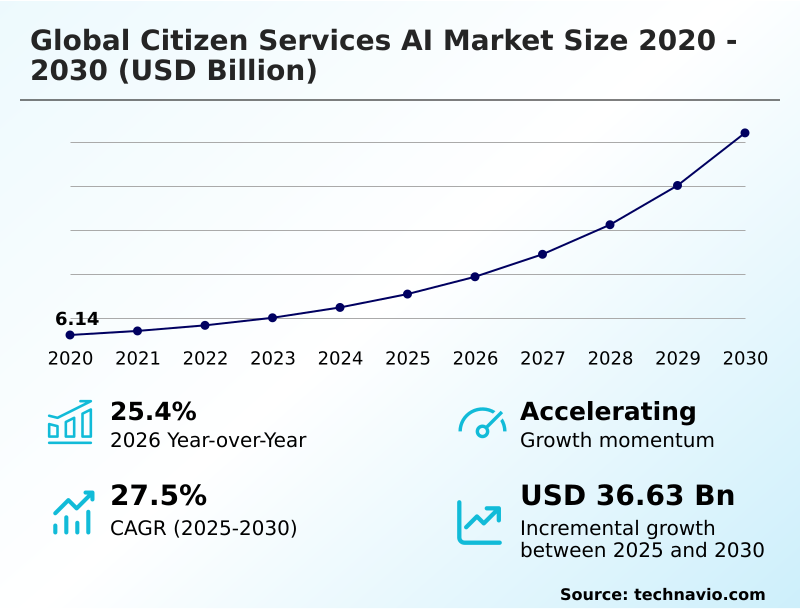
The citizen services ai market size is valued to increase by USD 36.63 billion, at a CAGR of 27.5% from 2025 to 2030. Critical mandate for administrative efficiency and cost containment will drive the citizen services ai market.

Major Market Trends & Insights

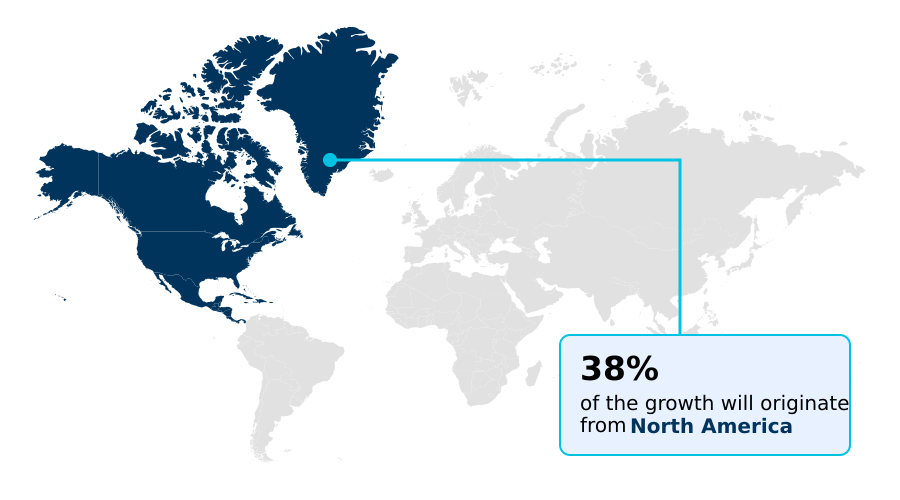
  • North America dominated the market and accounted for a 38% growth during the forecast period.
  • By Technology - Machine learning segment was valued at USD 4.48 billion in 2024
  • By End-user - Public safety and emergency response segment accounted for the largest market revenue share in 2024

Market Size & Forecast

  • Market Opportunities: USD 45.93 billion
  • Market Future Opportunities: USD 36.63 billion
  • CAGR from 2025 to 2030 : 27.5%

Market Summary

  • The citizen services AI market represents a strategic shift in public administration, leveraging advanced technology to modernize service delivery. It involves the application of machine learning and data analytics to automate routine tasks, personalize interactions, and derive actionable insights for proactive, data-informed governance.
  • For example, in emergency response, predictive resource allocation models analyze real-time data to position medical services and fire departments more effectively, optimizing response times during critical incidents. This transition is driven by the need for enhanced operational efficiency and rising public expectations for accessible, 24/7 support, often delivered through ai-driven citizen engagement platforms.
  • Central to this evolution are core technologies like natural language processing for multilingual support and computer vision for infrastructure monitoring. The market focuses on improving service accessibility and building more resilient, responsive public institutions, with a strong emphasis on algorithmic bias mitigation strategies to ensure equitable outcomes for all citizens.
  • This move toward digital-first administration is a foundational element ensuring the sustainability of public service models.

What will be the Size of the Citizen Services AI Market during the forecast period?

Get Key Insights on Market Forecast (PDF) Get Free Sample

How is the Citizen Services AI Market Segmented?

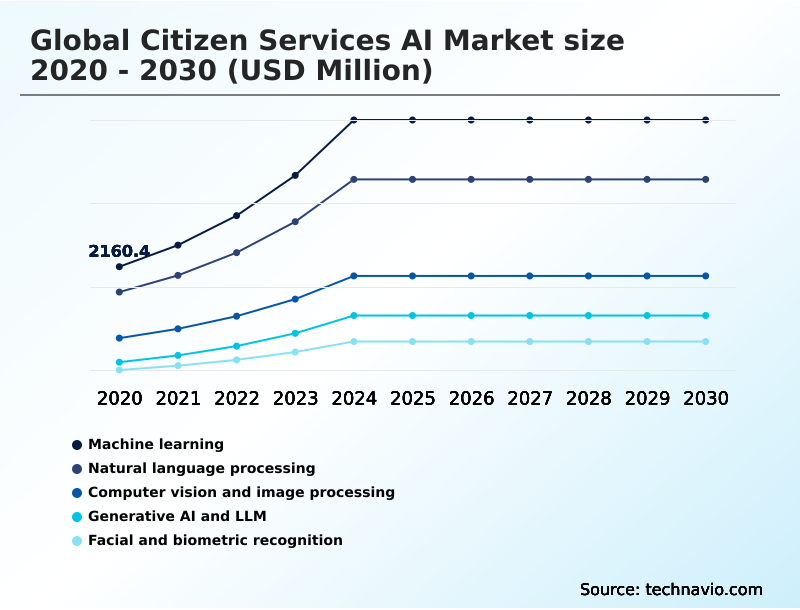
The citizen services ai industry research report provides comprehensive data (region-wise segment analysis), with forecasts and estimates in "USD million" for the period 2026-2030, as well as historical data from 2020-2024 for the following segments.

  • Technology
    • Machine learning
    • Natural language processing
    • Computer vision and image processing
    • Generative AI and LLM
    • Facial and biometric recognition
  • End-user
    • Public safety and emergency response
    • Traffic and transportation management
    • Healthcare and social services
    • Utilities and smart infrastructure
    • Others
  • Component
    • Solutions
    • Services
  • Geography
    • North America
      • US
      • Canada
      • Mexico
    • APAC
      • China
      • Japan
      • India
    • Europe
      • Germany
      • UK
      • France
    • Middle East and Africa
      • Saudi Arabia
      • UAE
      • South Africa
    • South America
      • Brazil
      • Argentina
    • Rest of World (ROW)

By Technology Insights

The machine learning segment is estimated to witness significant growth during the forecast period.

Machine learning is a foundational element, enabling public administration systems to improve operational processes. This technology supports a vast range of applications, where its ability to derive actionable insights from complex data is a primary adoption driver.

Anomaly detection models have improved fraud identification in benefits claims by over 20%, a key use case for machine learning for fraud detection. The use of federated learning models is growing for training algorithms without centralizing sensitive data.

Explainable ai (xai) frameworks and public service delivery automation are being integrated to ensure transparent and efficient automated document processing workflows that build public trust in proactive governance models.

Get Free Sample

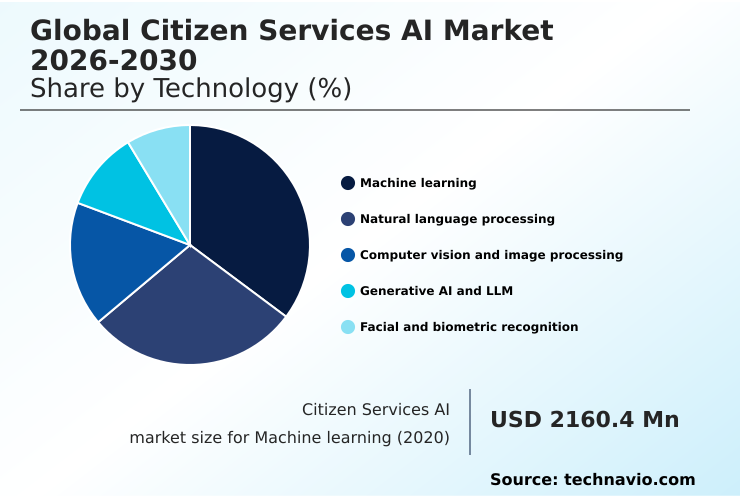
The Machine learning segment was valued at USD 4.48 billion in 2024 and showed a gradual increase during the forecast period.

Get Free Sample

Regional Analysis

North America is estimated to contribute 38% to the growth of the global market during the forecast period.Technavio’s analysts have elaborately explained the regional trends and drivers that shape the market during the forecast period.

See How Citizen Services AI Market Demand is Rising in North America Get Free Sample

North America is a dominant region, characterized by large-scale contracts for biometric authentication for digital identity and other advanced systems. However, the APAC region is the fastest-growing market, with a projected growth rate of 28.3%, slightly outpacing North America's 27.1%.

This growth in APAC is fueled by massive investments in smart city ai applications and mobile-first service delivery.

In Europe, the market is shaped by a strong focus on ethical ai in public administration and ai ethics and governance, guided by regulations that mandate transparency.

There is also a strong emphasis on natural language processing for multilingual support and computer vision for infrastructure monitoring.

Market Dynamics

Our researchers analyzed the data with 2025 as the base year, along with the key drivers, trends, and challenges. A holistic analysis of drivers will help companies refine their marketing strategies to gain a competitive advantage.

  • The practical application of AI is reshaping government functions at a granular level. The use of ai for social benefit eligibility verification is automating complex checks, while ai for tax administration automation is enhancing revenue collection efficiency. In urban environments, ai in traffic and transportation management works in tandem with ai in public transport scheduling optimization to reduce congestion.
  • For instance, optimizing public transit routes has been shown to yield cost savings more than double those achieved through ai for urban planning and development alone. Public safety is being transformed through ai in emergency response optimization and predictive ai in public safety resource allocation.
  • Core infrastructure benefits from ai for predictive infrastructure maintenance and ai for optimizing public utility grids, ensuring reliability. Citizen interaction is improved by ai for multilingual citizen support services and ai for personalized healthcare appointment notifications. Administrative backlogs are being cleared through ai applications in judicial case management and ai in streamlining permit application processing.
  • The technology is also applied to ai for automating government procurement, ai in digital voter registration systems, and ai for managing social welfare programs. Governments are leveraging ai for real-time sentiment analysis to gauge public opinion, while ai for public health surveillance and prediction, ai in customs and border protection, and ai for environmental impact monitoring address broader societal challenges.

What are the key market drivers leading to the rise in the adoption of Citizen Services AI Industry?

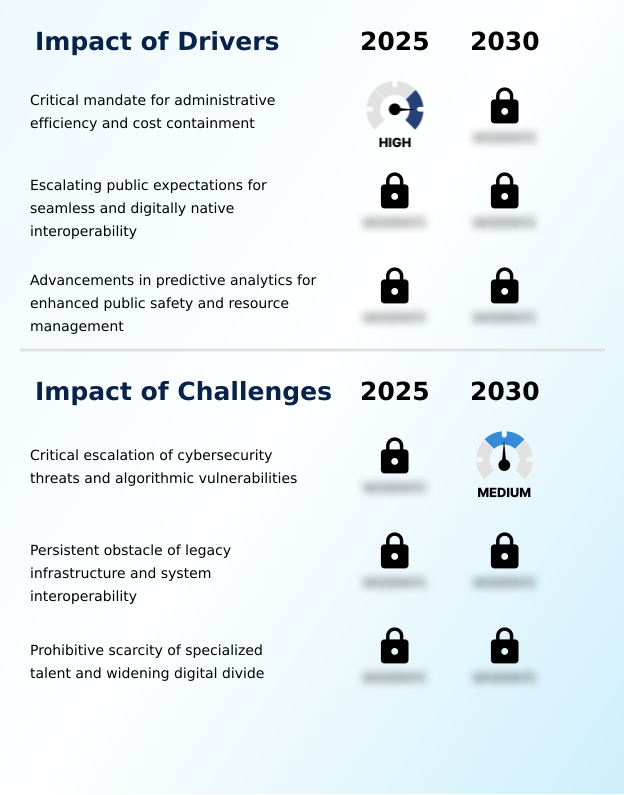
  • The critical mandate for public sector agencies to achieve higher levels of administrative efficiency while containing costs is a primary market driver.

  • The urgent need for administrative efficiency is a core market driver, compelling agencies to adopt solutions like automated decision-making systems which reduce manual processing costs by over 30%.
  • Escalating public expectations for seamless digital experiences are also critical, promoting the use of sophisticated technologies for citizen journey mapping. A major impetus is the growing sophistication of predictive analytics for public safety and infrastructure management.
  • This enables data-informed governance through predictive resource allocation, shifting from reactive to preventative strategies. This move toward interoperability of government systems is essential for creating unified user experiences and maximizing asset utility.

What are the market trends shaping the Citizen Services AI Industry?

  • The evolution toward proactive governance is a defining market trend, characterized by hyper-personalized systems that anticipate citizen needs before they are explicitly stated.

  • A key trend is the shift toward proactive service models through hyper-personalization engines, which utilize behavioral signals to anticipate citizen needs. This approach improves citizen satisfaction scores by over 15%. The strategic implementation of sovereign ai frameworks and strict data residency compliance is also gaining momentum, particularly in Europe, to protect sensitive information.
  • Furthermore, generative ai for public communication is being integrated into ai-driven citizen engagement platforms to facilitate inclusive and multilingual interactions. These systems can reduce response times by up to 40% through advanced conversational interfaces, creating a more accessible government.

What challenges does the Citizen Services AI Industry face during its growth?

  • A key challenge affecting industry growth is the critical escalation of sophisticated cybersecurity threats and inherent vulnerabilities within algorithmic systems.

  • A primary challenge is the escalation of sophisticated cyber threats, including model inversion attacks and prompt injection, which target public infrastructures. The deployment of agentic ai introduces new risks regarding predictability, demanding robust prompt injection defense mechanisms and advanced ai-driven threat detection.
  • The need for comprehensive ai-enhanced cybersecurity for government is critical, as a single failure can lead to a permanent loss of public trust. The integration of cutting-edge AI with antiquated legacy systems also poses a significant technical challenge, as modernization costs can be 50% higher than originally budgeted.

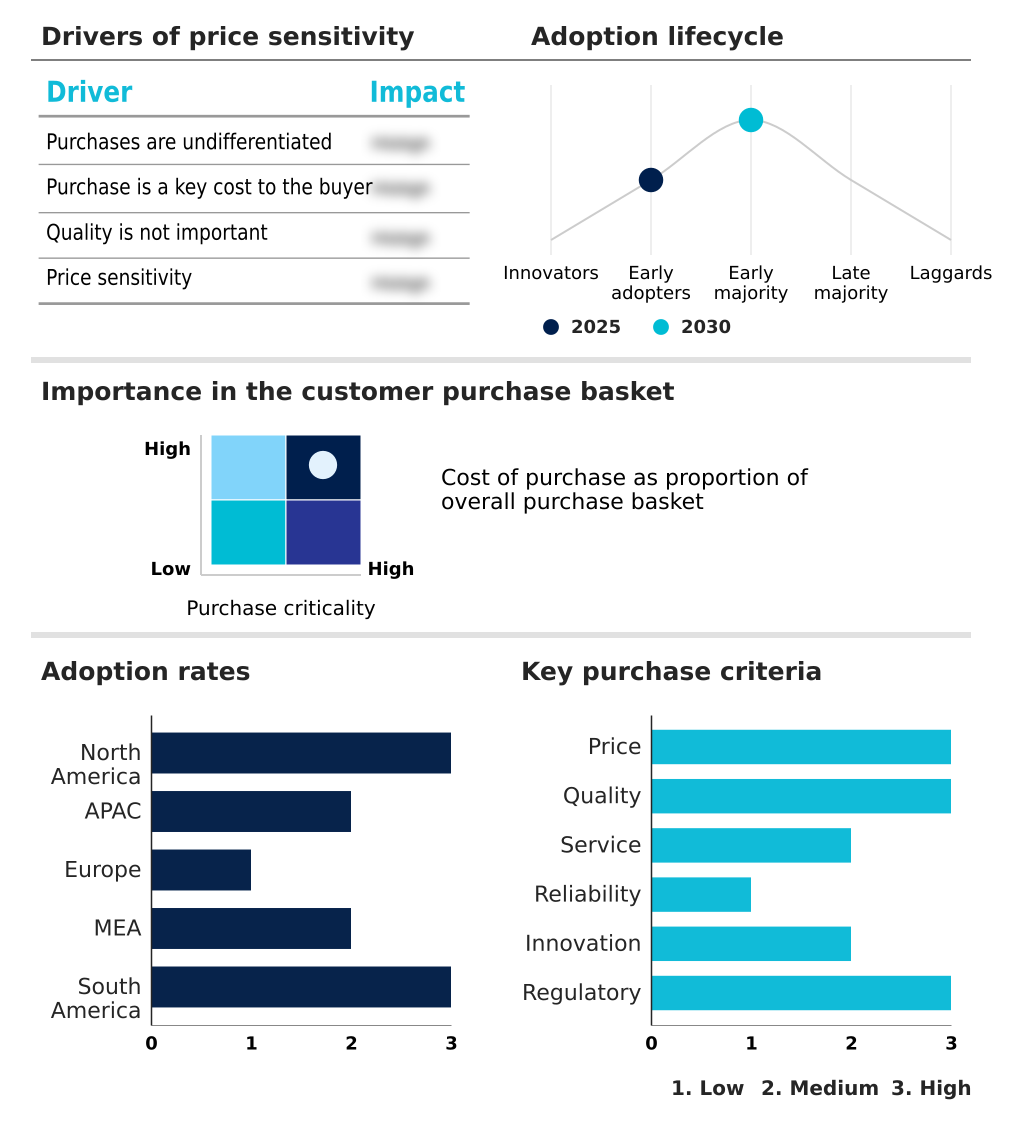
Exclusive Technavio Analysis on Customer Landscape

The citizen services ai market forecasting report includes the adoption lifecycle of the market, covering from the innovator’s stage to the laggard’s stage. It focuses on adoption rates in different regions based on penetration. Furthermore, the citizen services ai market report also includes key purchase criteria and drivers of price sensitivity to help companies evaluate and develop their market growth analysis strategies.

Customer Landscape of Citizen Services AI Industry

Competitive Landscape

Companies are implementing various strategies, such as strategic alliances, citizen services ai market forecast, partnerships, mergers and acquisitions, geographical expansion, and product/service launches, to enhance their presence in the industry.

Accenture Plc - Offerings include AI-driven engagement platforms, intelligent automation for government services, digital transformation consulting, and advanced analytics for mission-critical operations.

The industry research and growth report includes detailed analyses of the competitive landscape of the market and information about key companies, including:

  • Accenture Plc
  • Amazon.com Inc.
  • Booz Allen Hamilton Corp.
  • Capgemini SE
  • CGI Inc.
  • Google LLC
  • IBM Corp.
  • Leidos Holdings Inc.
  • Microsoft Corp.
  • NVIDIA Corp.
  • Oracle Corp.
  • Palantir Technologies Inc.
  • Pegasystems Inc.
  • Salesforce Inc.
  • SAP SE
  • SAS Institute Inc.
  • ServiceNow Inc.
  • Tyler Technologies Inc.
  • Unisys Corp.
  • Verint Systems Inc.

Qualitative and quantitative analysis of companies has been conducted to help clients understand the wider business environment as well as the strengths and weaknesses of key industry players. Data is qualitatively analyzed to categorize companies as pure play, category-focused, industry-focused, and diversified; it is quantitatively analyzed to categorize companies as dominant, leading, strong, tentative, and weak.

Recent Development and News in Citizen services ai market

  • In September 2025, Microsoft Corp. launched a new initiative aimed at integrating its AI tools into local government operations to enhance citizen engagement through more personalized services.
  • In November 2025, Amazon.com Inc. (via Amazon Web Services) announced an investment of up to $50 billion to expand its AI and supercomputing infrastructure for United States government agencies, aiming to accelerate critical missions.
  • In February 2026, Microsoft Corp. announced a $50 billion commitment to foster the growth of artificial intelligence across the Global South, focusing on strengthening AI infrastructure and partnerships with governments in Asia, Africa, and Latin America.
  • In April 2025, Palantir Technologies Inc. entered a partnership with the US Department of Health and Human Services to create an AI-driven pandemic preparedness and public health response system named the National Health Shield.

Dive into Technavio’s robust research methodology, blending expert interviews, extensive data synthesis, and validated models for unparalleled Citizen Services AI Market insights. See full methodology.

Market Scope
Page number 316
Base year 2025
Historic period 2020-2024
Forecast period 2026-2030
Growth momentum & CAGR Accelerate at a CAGR of 27.5%
Market growth 2026-2030 USD 36629.5 million
Market structure Fragmented
YoY growth 2025-2026(%) 25.4%
Key countries US, Canada, Mexico, China, Japan, India, South Korea, Australia, Indonesia, Germany, UK, France, Italy, Spain, The Netherlands, Saudi Arabia, UAE, South Africa, Israel, Turkey, Brazil, Argentina and Chile
Competitive landscape Leading Companies, Market Positioning of Companies, Competitive Strategies, and Industry Risks

Request Free Sample

Research Analyst Overview

  • The market is rapidly maturing from isolated pilot projects to the large-scale deployment of integrated platforms. The adoption of conversational interfaces and hyper-personalization engines is becoming standard for improving citizen engagement. Boardroom-level decisions are increasingly focused on the implementation of sovereign ai frameworks to ensure data security and regulatory compliance.
  • The core technology stack includes sophisticated predictive analytics for public safety and computer vision for infrastructure monitoring, which rely on federated learning models to process decentralized data securely. As systems evolve, the use of agentic ai and automated decision-making systems necessitates robust prompt injection defense and countermeasures against model inversion attacks.
  • To maintain trust, explainable ai (xai) frameworks and strong ai-driven threat detection are critical. This ecosystem also leverages generative ai for public communication, natural language processing for multilingual support, and biometric authentication for digital identity, with some agencies reporting a 30% reduction in document processing time.

What are the Key Data Covered in this Citizen Services AI Market Research and Growth Report?

  • What is the expected growth of the Citizen Services AI Market between 2026 and 2030?

    • USD 36.63 billion, at a CAGR of 27.5%

  • What segmentation does the market report cover?

    • The report is segmented by Technology (Machine learning, Natural language processing, Computer vision and image processing, Generative AI and LLM, and Facial and biometric recognition), End-user (Public safety and emergency response, Traffic and transportation management, Healthcare and social services, Utilities and smart infrastructure, and Others), Component (Solutions, and Services) and Geography (North America, APAC, Europe, Middle East and Africa, South America)

  • Which regions are analyzed in the report?

    • North America, APAC, Europe, Middle East and Africa and South America

  • What are the key growth drivers and market challenges?

    • Critical mandate for administrative efficiency and cost containment, Critical escalation of cybersecurity threats and algorithmic vulnerabilities

  • Who are the major players in the Citizen Services AI Market?

    • Accenture Plc, Amazon.com Inc., Booz Allen Hamilton Corp., Capgemini SE, CGI Inc., Google LLC, IBM Corp., Leidos Holdings Inc., Microsoft Corp., NVIDIA Corp., Oracle Corp., Palantir Technologies Inc., Pegasystems Inc., Salesforce Inc., SAP SE, SAS Institute Inc., ServiceNow Inc., Tyler Technologies Inc., Unisys Corp. and Verint Systems Inc.

Market Research Insights

  • The market is defined by a push toward proactive governance models that anticipate citizen needs. The implementation of robust digital identity verification systems and a focus on ethical ai in public administration are building public trust, which is critical for adoption. Efforts to ensure interoperability of government systems are breaking down data silos, enabling a 360-degree citizen view.
  • For instance, regions with high digital literacy show adoption rates for AI-powered services that are 25% higher than in other areas. The use of machine learning for fraud detection has reduced improper payments by up to 15% in early deployments, demonstrating clear ROI and driving further investment in the sector.

We can help! Our analysts can customize this citizen services ai market research report to meet your requirements.

Get in touch

1. Executive Summary

1.1 Market overview

Executive Summary - Chart on Market Overview
Executive Summary - Data Table on Market Overview
Executive Summary - Chart on Global Market Characteristics
Executive Summary - Chart on Market by Geography
Executive Summary - Chart on Market Segmentation by Technology
Executive Summary - Chart on Market Segmentation by End-user
Executive Summary - Chart on Market Segmentation by Component
Executive Summary - Chart on Incremental Growth
Executive Summary - Data Table on Incremental Growth
Executive Summary - Chart on Company Market Positioning

2. Technavio Analysis

2.1 Analysis of price sensitivity, lifecycle, customer purchase basket, adoption rates, and purchase criteria

2.2 Criticality of inputs and Factors of differentiation

Chart on Overview on criticality of inputs and factors of differentiation

2.3 Factors of disruption

Chart on Overview on factors of disruption

2.4 Impact of drivers and challenges

Chart on Impact of drivers and challenges in 2025 and 2030

3. Market Landscape

3.1 Market ecosystem

Chart on Parent Market
Data Table on - Parent Market

3.2 Market characteristics

Chart on Market characteristics analysis

3.3 Value chain analysis

Chart on Value chain analysis

4. Market Sizing

4.1 Market definition

Data Table on Offerings of companies included in the market definition

4.2 Market segment analysis

Market segments

4.3 Market size 2025

4.4 Market outlook: Forecast for 2025-2030

Chart on Global - Market size and forecast 2025-2030 ($ million)
Data Table on Global - Market size and forecast 2025-2030 ($ million)
Chart on Global Market: Year-over-year growth 2025-2030 (%)
Data Table on Global Market: Year-over-year growth 2025-2030 (%)

5. Historic Market Size

5.1 Global Citizen Services AI Market 2020 - 2024

Historic Market Size - Data Table on Global Citizen Services AI Market 2020 - 2024 ($ million)

5.2 Technology segment analysis 2020 - 2024

Historic Market Size - Technology Segment 2020 - 2024 ($ million)

5.3 End-user segment analysis 2020 - 2024

Historic Market Size - End-user Segment 2020 - 2024 ($ million)

5.4 Component segment analysis 2020 - 2024

Historic Market Size - Component Segment 2020 - 2024 ($ million)

5.5 Geography segment analysis 2020 - 2024

Historic Market Size - Geography Segment 2020 - 2024 ($ million)

5.6 Country segment analysis 2020 - 2024

Historic Market Size - Country Segment 2020 - 2024 ($ million)

6. Qualitative Analysis

6.1 Impact of geopolitical conflicts on global citizen services AI market

7. Five Forces Analysis

7.1 Five forces summary

Five forces analysis - Comparison between 2025 and 2030

7.2 Bargaining power of buyers

Bargaining power of buyers - Impact of key factors 2025 and 2030

7.3 Bargaining power of suppliers

Bargaining power of suppliers - Impact of key factors in 2025 and 2030

7.4 Threat of new entrants

Threat of new entrants - Impact of key factors in 2025 and 2030

7.5 Threat of substitutes

Threat of substitutes - Impact of key factors in 2025 and 2030

7.6 Threat of rivalry

Threat of rivalry - Impact of key factors in 2025 and 2030

7.7 Market condition

Chart on Market condition - Five forces 2025 and 2030

8. Market Segmentation by Technology

8.1 Market segments

Chart on Technology - Market share 2025-2030 (%)
Data Table on Technology - Market share 2025-2030 (%)

8.2 Comparison by Technology

Chart on Comparison by Technology
Data Table on Comparison by Technology

8.3 Machine learning - Market size and forecast 2025-2030

Chart on Machine learning - Market size and forecast 2025-2030 ($ million)
Data Table on Machine learning - Market size and forecast 2025-2030 ($ million)
Chart on Machine learning - Year-over-year growth 2025-2030 (%)
Data Table on Machine learning - Year-over-year growth 2025-2030 (%)

8.4 Natural language processing - Market size and forecast 2025-2030

Chart on Natural language processing - Market size and forecast 2025-2030 ($ million)
Data Table on Natural language processing - Market size and forecast 2025-2030 ($ million)
Chart on Natural language processing - Year-over-year growth 2025-2030 (%)
Data Table on Natural language processing - Year-over-year growth 2025-2030 (%)

8.5 Computer vision and image processing - Market size and forecast 2025-2030

Chart on Computer vision and image processing - Market size and forecast 2025-2030 ($ million)
Data Table on Computer vision and image processing - Market size and forecast 2025-2030 ($ million)
Chart on Computer vision and image processing - Year-over-year growth 2025-2030 (%)
Data Table on Computer vision and image processing - Year-over-year growth 2025-2030 (%)

8.6 Generative AI and LLM - Market size and forecast 2025-2030

Chart on Generative AI and LLM - Market size and forecast 2025-2030 ($ million)
Data Table on Generative AI and LLM - Market size and forecast 2025-2030 ($ million)
Chart on Generative AI and LLM - Year-over-year growth 2025-2030 (%)
Data Table on Generative AI and LLM - Year-over-year growth 2025-2030 (%)

8.7 Facial and biometric recognition - Market size and forecast 2025-2030

Chart on Facial and biometric recognition - Market size and forecast 2025-2030 ($ million)
Data Table on Facial and biometric recognition - Market size and forecast 2025-2030 ($ million)
Chart on Facial and biometric recognition - Year-over-year growth 2025-2030 (%)
Data Table on Facial and biometric recognition - Year-over-year growth 2025-2030 (%)

8.8 Market opportunity by Technology

Market opportunity by Technology ($ million)
Data Table on Market opportunity by Technology ($ million)

9. Market Segmentation by End-user

9.1 Market segments

Chart on End-user - Market share 2025-2030 (%)
Data Table on End-user - Market share 2025-2030 (%)

9.2 Comparison by End-user

Chart on Comparison by End-user
Data Table on Comparison by End-user

9.3 Public safety and emergency response - Market size and forecast 2025-2030

Chart on Public safety and emergency response - Market size and forecast 2025-2030 ($ million)
Data Table on Public safety and emergency response - Market size and forecast 2025-2030 ($ million)
Chart on Public safety and emergency response - Year-over-year growth 2025-2030 (%)
Data Table on Public safety and emergency response - Year-over-year growth 2025-2030 (%)

9.4 Traffic and transportation management - Market size and forecast 2025-2030

Chart on Traffic and transportation management - Market size and forecast 2025-2030 ($ million)
Data Table on Traffic and transportation management - Market size and forecast 2025-2030 ($ million)
Chart on Traffic and transportation management - Year-over-year growth 2025-2030 (%)
Data Table on Traffic and transportation management - Year-over-year growth 2025-2030 (%)

9.5 Healthcare and social services - Market size and forecast 2025-2030

Chart on Healthcare and social services - Market size and forecast 2025-2030 ($ million)
Data Table on Healthcare and social services - Market size and forecast 2025-2030 ($ million)
Chart on Healthcare and social services - Year-over-year growth 2025-2030 (%)
Data Table on Healthcare and social services - Year-over-year growth 2025-2030 (%)

9.6 Utilities and smart infrastructure - Market size and forecast 2025-2030

Chart on Utilities and smart infrastructure - Market size and forecast 2025-2030 ($ million)
Data Table on Utilities and smart infrastructure - Market size and forecast 2025-2030 ($ million)
Chart on Utilities and smart infrastructure - Year-over-year growth 2025-2030 (%)
Data Table on Utilities and smart infrastructure - Year-over-year growth 2025-2030 (%)

9.7 Others - Market size and forecast 2025-2030

Chart on Others - Market size and forecast 2025-2030 ($ million)
Data Table on Others - Market size and forecast 2025-2030 ($ million)
Chart on Others - Year-over-year growth 2025-2030 (%)
Data Table on Others - Year-over-year growth 2025-2030 (%)

9.8 Market opportunity by End-user

Market opportunity by End-user ($ million)
Data Table on Market opportunity by End-user ($ million)

10. Market Segmentation by Component

10.1 Market segments

Chart on Component - Market share 2025-2030 (%)
Data Table on Component - Market share 2025-2030 (%)

10.2 Comparison by Component

Chart on Comparison by Component
Data Table on Comparison by Component

10.3 Solutions - Market size and forecast 2025-2030

Chart on Solutions - Market size and forecast 2025-2030 ($ million)
Data Table on Solutions - Market size and forecast 2025-2030 ($ million)
Chart on Solutions - Year-over-year growth 2025-2030 (%)
Data Table on Solutions - Year-over-year growth 2025-2030 (%)

10.4 Services - Market size and forecast 2025-2030

Chart on Services - Market size and forecast 2025-2030 ($ million)
Data Table on Services - Market size and forecast 2025-2030 ($ million)
Chart on Services - Year-over-year growth 2025-2030 (%)
Data Table on Services - Year-over-year growth 2025-2030 (%)

10.5 Market opportunity by Component

Market opportunity by Component ($ million)
Data Table on Market opportunity by Component ($ million)

11. Customer Landscape

11.1 Customer landscape overview

Analysis of price sensitivity, lifecycle, customer purchase basket, adoption rates, and purchase criteria

12. Geographic Landscape

12.1 Geographic segmentation

Chart on Market share by geography 2025-2030 (%)
Data Table on Market share by geography 2025-2030 (%)

12.2 Geographic comparison

Chart on Geographic comparison
Data Table on Geographic comparison

12.3 North America - Market size and forecast 2025-2030

Chart on North America - Market size and forecast 2025-2030 ($ million)
Data Table on North America - Market size and forecast 2025-2030 ($ million)
Chart on North America - Year-over-year growth 2025-2030 (%)
Data Table on North America - Year-over-year growth 2025-2030 (%)
Chart on Regional Comparison - North America
Data Table on Regional Comparison - North America

12.3.1 US - Market size and forecast 2025-2030

Chart on US - Market size and forecast 2025-2030 ($ million)
Data Table on US - Market size and forecast 2025-2030 ($ million)
Chart on US - Year-over-year growth 2025-2030 (%)
Data Table on US - Year-over-year growth 2025-2030 (%)

12.3.2 Canada - Market size and forecast 2025-2030

Chart on Canada - Market size and forecast 2025-2030 ($ million)
Data Table on Canada - Market size and forecast 2025-2030 ($ million)
Chart on Canada - Year-over-year growth 2025-2030 (%)
Data Table on Canada - Year-over-year growth 2025-2030 (%)

12.3.3 Mexico - Market size and forecast 2025-2030

Chart on Mexico - Market size and forecast 2025-2030 ($ million)
Data Table on Mexico - Market size and forecast 2025-2030 ($ million)
Chart on Mexico - Year-over-year growth 2025-2030 (%)
Data Table on Mexico - Year-over-year growth 2025-2030 (%)

12.4 APAC - Market size and forecast 2025-2030

Chart on APAC - Market size and forecast 2025-2030 ($ million)
Data Table on APAC - Market size and forecast 2025-2030 ($ million)
Chart on APAC - Year-over-year growth 2025-2030 (%)
Data Table on APAC - Year-over-year growth 2025-2030 (%)
Chart on Regional Comparison - APAC
Data Table on Regional Comparison - APAC

12.4.1 China - Market size and forecast 2025-2030

Chart on China - Market size and forecast 2025-2030 ($ million)
Data Table on China - Market size and forecast 2025-2030 ($ million)
Chart on China - Year-over-year growth 2025-2030 (%)
Data Table on China - Year-over-year growth 2025-2030 (%)

12.4.2 Japan - Market size and forecast 2025-2030

Chart on Japan - Market size and forecast 2025-2030 ($ million)
Data Table on Japan - Market size and forecast 2025-2030 ($ million)
Chart on Japan - Year-over-year growth 2025-2030 (%)
Data Table on Japan - Year-over-year growth 2025-2030 (%)

12.4.3 India - Market size and forecast 2025-2030

Chart on India - Market size and forecast 2025-2030 ($ million)
Data Table on India - Market size and forecast 2025-2030 ($ million)
Chart on India - Year-over-year growth 2025-2030 (%)
Data Table on India - Year-over-year growth 2025-2030 (%)

12.4.4 South Korea - Market size and forecast 2025-2030

Chart on South Korea - Market size and forecast 2025-2030 ($ million)
Data Table on South Korea - Market size and forecast 2025-2030 ($ million)
Chart on South Korea - Year-over-year growth 2025-2030 (%)
Data Table on South Korea - Year-over-year growth 2025-2030 (%)

12.4.5 Australia - Market size and forecast 2025-2030

Chart on Australia - Market size and forecast 2025-2030 ($ million)
Data Table on Australia - Market size and forecast 2025-2030 ($ million)
Chart on Australia - Year-over-year growth 2025-2030 (%)
Data Table on Australia - Year-over-year growth 2025-2030 (%)

12.4.6 Indonesia - Market size and forecast 2025-2030

Chart on Indonesia - Market size and forecast 2025-2030 ($ million)
Data Table on Indonesia - Market size and forecast 2025-2030 ($ million)
Chart on Indonesia - Year-over-year growth 2025-2030 (%)
Data Table on Indonesia - Year-over-year growth 2025-2030 (%)

12.5 Europe - Market size and forecast 2025-2030

Chart on Europe - Market size and forecast 2025-2030 ($ million)
Data Table on Europe - Market size and forecast 2025-2030 ($ million)
Chart on Europe - Year-over-year growth 2025-2030 (%)
Data Table on Europe - Year-over-year growth 2025-2030 (%)
Chart on Regional Comparison - Europe
Data Table on Regional Comparison - Europe

12.5.1 Germany - Market size and forecast 2025-2030

Chart on Germany - Market size and forecast 2025-2030 ($ million)
Data Table on Germany - Market size and forecast 2025-2030 ($ million)
Chart on Germany - Year-over-year growth 2025-2030 (%)
Data Table on Germany - Year-over-year growth 2025-2030 (%)

12.5.2 UK - Market size and forecast 2025-2030

Chart on UK - Market size and forecast 2025-2030 ($ million)
Data Table on UK - Market size and forecast 2025-2030 ($ million)
Chart on UK - Year-over-year growth 2025-2030 (%)
Data Table on UK - Year-over-year growth 2025-2030 (%)

12.5.3 France - Market size and forecast 2025-2030

Chart on France - Market size and forecast 2025-2030 ($ million)
Data Table on France - Market size and forecast 2025-2030 ($ million)
Chart on France - Year-over-year growth 2025-2030 (%)
Data Table on France - Year-over-year growth 2025-2030 (%)

12.5.4 Italy - Market size and forecast 2025-2030

Chart on Italy - Market size and forecast 2025-2030 ($ million)
Data Table on Italy - Market size and forecast 2025-2030 ($ million)
Chart on Italy - Year-over-year growth 2025-2030 (%)
Data Table on Italy - Year-over-year growth 2025-2030 (%)

12.5.5 Spain - Market size and forecast 2025-2030

Chart on Spain - Market size and forecast 2025-2030 ($ million)
Data Table on Spain - Market size and forecast 2025-2030 ($ million)
Chart on Spain - Year-over-year growth 2025-2030 (%)
Data Table on Spain - Year-over-year growth 2025-2030 (%)

12.5.6 The Netherlands - Market size and forecast 2025-2030

Chart on The Netherlands - Market size and forecast 2025-2030 ($ million)
Data Table on The Netherlands - Market size and forecast 2025-2030 ($ million)
Chart on The Netherlands - Year-over-year growth 2025-2030 (%)
Data Table on The Netherlands - Year-over-year growth 2025-2030 (%)

12.6 Middle East and Africa - Market size and forecast 2025-2030

Chart on Middle East and Africa - Market size and forecast 2025-2030 ($ million)
Data Table on Middle East and Africa - Market size and forecast 2025-2030 ($ million)
Chart on Middle East and Africa - Year-over-year growth 2025-2030 (%)
Data Table on Middle East and Africa - Year-over-year growth 2025-2030 (%)
Chart on Regional Comparison - Middle East and Africa
Data Table on Regional Comparison - Middle East and Africa

12.6.1 Saudi Arabia - Market size and forecast 2025-2030

Chart on Saudi Arabia - Market size and forecast 2025-2030 ($ million)
Data Table on Saudi Arabia - Market size and forecast 2025-2030 ($ million)
Chart on Saudi Arabia - Year-over-year growth 2025-2030 (%)
Data Table on Saudi Arabia - Year-over-year growth 2025-2030 (%)

12.6.2 UAE - Market size and forecast 2025-2030

Chart on UAE - Market size and forecast 2025-2030 ($ million)
Data Table on UAE - Market size and forecast 2025-2030 ($ million)
Chart on UAE - Year-over-year growth 2025-2030 (%)
Data Table on UAE - Year-over-year growth 2025-2030 (%)

12.6.3 South Africa - Market size and forecast 2025-2030

Chart on South Africa - Market size and forecast 2025-2030 ($ million)
Data Table on South Africa - Market size and forecast 2025-2030 ($ million)
Chart on South Africa - Year-over-year growth 2025-2030 (%)
Data Table on South Africa - Year-over-year growth 2025-2030 (%)

12.6.4 Israel - Market size and forecast 2025-2030

Chart on Israel - Market size and forecast 2025-2030 ($ million)
Data Table on Israel - Market size and forecast 2025-2030 ($ million)
Chart on Israel - Year-over-year growth 2025-2030 (%)
Data Table on Israel - Year-over-year growth 2025-2030 (%)

12.6.5 Turkey - Market size and forecast 2025-2030

Chart on Turkey - Market size and forecast 2025-2030 ($ million)
Data Table on Turkey - Market size and forecast 2025-2030 ($ million)
Chart on Turkey - Year-over-year growth 2025-2030 (%)
Data Table on Turkey - Year-over-year growth 2025-2030 (%)

12.7 South America - Market size and forecast 2025-2030

Chart on South America - Market size and forecast 2025-2030 ($ million)
Data Table on South America - Market size and forecast 2025-2030 ($ million)
Chart on South America - Year-over-year growth 2025-2030 (%)
Data Table on South America - Year-over-year growth 2025-2030 (%)
Chart on Regional Comparison - South America
Data Table on Regional Comparison - South America

12.7.1 Brazil - Market size and forecast 2025-2030

Chart on Brazil - Market size and forecast 2025-2030 ($ million)
Data Table on Brazil - Market size and forecast 2025-2030 ($ million)
Chart on Brazil - Year-over-year growth 2025-2030 (%)
Data Table on Brazil - Year-over-year growth 2025-2030 (%)

12.7.2 Argentina - Market size and forecast 2025-2030

Chart on Argentina - Market size and forecast 2025-2030 ($ million)
Data Table on Argentina - Market size and forecast 2025-2030 ($ million)
Chart on Argentina - Year-over-year growth 2025-2030 (%)
Data Table on Argentina - Year-over-year growth 2025-2030 (%)

12.7.3 Chile - Market size and forecast 2025-2030

Chart on Chile - Market size and forecast 2025-2030 ($ million)
Data Table on Chile - Market size and forecast 2025-2030 ($ million)
Chart on Chile - Year-over-year growth 2025-2030 (%)
Data Table on Chile - Year-over-year growth 2025-2030 (%)

12.8 Market opportunity by geography

Market opportunity by geography ($ million)
Data Tables on Market opportunity by geography ($ million)

13. Drivers, Challenges, and Opportunity

13.1 Market drivers

Critical mandate for administrative efficiency and cost containment
Escalating public expectations for seamless and digitally native interoperability
Advancements in predictive analytics for enhanced public safety and resource management

13.2 Market challenges

Critical escalation of cybersecurity threats and algorithmic vulnerabilities
Persistent obstacle of legacy infrastructure and system interoperability
Prohibitive scarcity of specialized talent and widening digital divide

13.3 Impact of drivers and challenges

Impact of drivers and challenges in 2025 and 2030

13.4 Market opportunities

Evolution of proactive governance through hyper-personalization
Strategic implementation of sovereign AI and data residency frameworks
Generative AI integration for multilingual and inclusive public communication

14. Competitive Landscape

14.1 Overview

14.2

Overview on criticality of inputs and factors of differentiation

14.3 Landscape disruption

Overview on factors of disruption

14.4 Industry risks

Impact of key risks on business

15. Competitive Analysis

15.1 Companies profiled

Companies covered

15.2 Company ranking index

15.3 Market positioning of companies

Matrix on companies position and classification

15.4 Accenture Plc

Accenture Plc - Overview
Accenture Plc - Business segments
Accenture Plc - Key news
Accenture Plc - Key offerings
Accenture Plc - Segment focus
SWOT

15.5 Amazon.com Inc.

Amazon.com Inc. - Overview
Amazon.com Inc. - Business segments
Amazon.com Inc. - Key news
Amazon.com Inc. - Key offerings
Amazon.com Inc. - Segment focus
SWOT

15.6 Capgemini SE

Capgemini SE - Overview
Capgemini SE - Business segments
Capgemini SE - Key news
Capgemini SE - Key offerings
Capgemini SE - Segment focus
SWOT

15.7 CGI Inc.

CGI Inc. - Overview
CGI Inc. - Business segments
CGI Inc. - Key offerings
CGI Inc. - Segment focus
SWOT

15.8 IBM Corp.

IBM Corp. - Overview
IBM Corp. - Business segments
IBM Corp. - Key news
IBM Corp. - Key offerings
IBM Corp. - Segment focus
SWOT

15.9 Leidos Holdings Inc.

Leidos Holdings Inc. - Overview
Leidos Holdings Inc. - Business segments
Leidos Holdings Inc. - Key offerings
Leidos Holdings Inc. - Segment focus
SWOT

15.10 Microsoft Corp.

Microsoft Corp. - Overview
Microsoft Corp. - Business segments
Microsoft Corp. - Key news
Microsoft Corp. - Key offerings
Microsoft Corp. - Segment focus
SWOT

15.11 NVIDIA Corp.

NVIDIA Corp. - Overview
NVIDIA Corp. - Business segments
NVIDIA Corp. - Key news
NVIDIA Corp. - Key offerings
NVIDIA Corp. - Segment focus
SWOT

15.12 Oracle Corp.

Oracle Corp. - Overview
Oracle Corp. - Business segments
Oracle Corp. - Key news
Oracle Corp. - Key offerings
Oracle Corp. - Segment focus
SWOT

15.13 Salesforce Inc.

Salesforce Inc. - Overview
Salesforce Inc. - Business segments
Salesforce Inc. - Key news
Salesforce Inc. - Key offerings
Salesforce Inc. - Segment focus
SWOT

15.14 SAP SE

SAP SE - Overview
SAP SE - Business segments
SAP SE - Key news
SAP SE - Key offerings
SAP SE - Segment focus
SWOT

15.15 ServiceNow Inc.

ServiceNow Inc. - Overview
ServiceNow Inc. - Product / Service
ServiceNow Inc. - Key news
ServiceNow Inc. - Key offerings
SWOT

15.16 Tyler Technologies Inc.

Tyler Technologies Inc. - Overview
Tyler Technologies Inc. - Business segments
Tyler Technologies Inc. - Key offerings
Tyler Technologies Inc. - Segment focus
SWOT

15.17 Unisys Corp.

Unisys Corp. - Overview
Unisys Corp. - Business segments
Unisys Corp. - Key offerings
Unisys Corp. - Segment focus
SWOT

15.18 Verint Systems Inc.

Verint Systems Inc. - Overview
Verint Systems Inc. - Product / Service
Verint Systems Inc. - Key news
Verint Systems Inc. - Key offerings
SWOT

16. Appendix

16.1 Scope of the report

Market definition
Objectives
Notes and caveats

16.2 Inclusions and exclusions checklist

Inclusions checklist
Exclusions checklist

16.3 Currency conversion rates for US$

16.4 Research methodology

16.5 Data procurement

Information sources

16.6 Data validation

16.7 Validation techniques employed for market sizing

16.8 Data synthesis

16.9 360 degree market analysis

16.10 List of abbreviations

Research Methodology

Technavio presents a detailed picture of the market by way of study, synthesis, and summation of data from multiple sources. The analysts have presented the various facets of the market with a particular focus on identifying the key industry influencers. The data thus presented is comprehensive, reliable, and the result of extensive research, both primary and secondary.

INFORMATION SOURCES

Primary sources

  • Manufacturers and suppliers
  • Channel partners
  • Industry experts
  • Strategic decision makers

Secondary sources

  • Industry journals and periodicals
  • Government data
  • Financial reports of key industry players
  • Historical data
  • Press releases

DATA ANALYSIS

Data Synthesis

  • Collation of data
  • Estimation of key figures
  • Analysis of derived insights

Data Validation

  • Triangulation with data models
  • Reference against proprietary databases
  • Corroboration with industry experts

REPORT WRITING

Qualitative

  • Market drivers
  • Market challenges
  • Market trends
  • Five forces analysis

Quantitative

  • Market size and forecast
  • Market segmentation
  • Geographical insights
  • Competitive landscape

Interested in this report?

Get your sample now to see our research methodology and insights!

Download Now

Frequently Asked Questions

Citizen Services AI market growth will increase by USD 36629.5 million during 2026-2030.

The Citizen Services AI market is expected to grow at a CAGR of 27.5% during 2026-2030.

Citizen Services AI market is segmented by Technology (Machine learning, Natural language processing, Computer vision and image processing, Generative AI and LLM, Facial and biometric recognition) End-user (Public safety and emergency response, Traffic and transportation management, Healthcare and social services, Utilities and smart infrastructure, Others) Component (Solutions, Services)

Accenture Plc, Amazon.com Inc., Booz Allen Hamilton Corp., Capgemini SE, CGI Inc., Google LLC, IBM Corp., Leidos Holdings Inc., Microsoft Corp., NVIDIA Corp., Oracle Corp., Palantir Technologies Inc., Pegasystems Inc., Salesforce Inc., SAP SE, SAS Institute Inc., ServiceNow Inc., Tyler Technologies Inc., Unisys Corp., Verint Systems Inc. are a few of the key vendors in the Citizen Services AI market.

North America will register the highest growth rate of 38% among the other regions. Therefore, the Citizen Services AI market in North America is expected to garner significant business opportunities for the vendors during the forecast period.

US, Canada, Mexico, China, Japan, India, South Korea, Australia, Indonesia, Germany, UK, France, Italy, Spain, The Netherlands, Saudi Arabia, UAE, South Africa, Israel, Turkey, Brazil, Argentina, Chile

  • Critical mandate for administrative efficiency and cost containment is the driving factor this market.

The Citizen Services AI market vendors should focus on grabbing business opportunities from the Technology segment as it accounted for the largest market share in the base year.
RIA - Research AI Assistant
Ask RIA