Clamshell Packaging Market Analysis, Size, and Forecast 2025-2029: APAC (China, Japan, and India), North America (US, Canada, and Mexico), Europe (Germany, UK, and France), South America (Brazil, Argentina, and Colombia), Middle East and Africa (Saudi Arabia, UAE, and Turkey), and Rest of World (ROW)

Clamshell Packaging Market Analysis, Size, and Forecast 2025-2029:
APAC (China, Japan, and India), North America (US, Canada, and Mexico), Europe (Germany, UK, and France), South America (Brazil, Argentina, and Colombia), Middle East and Africa (Saudi Arabia, UAE, and Turkey), and Rest of World (ROW)

Published: Dec 2025 293 Pages SKU: IRTNTR73870

Market Overview at a Glance

$2.68 B
Market Opportunity
3.9%
CAGR 2024 - 2029
51.6%
APAC Growth
$9.55 B
Food segment 2023

Clamshell Packaging Market Size 2025-2029

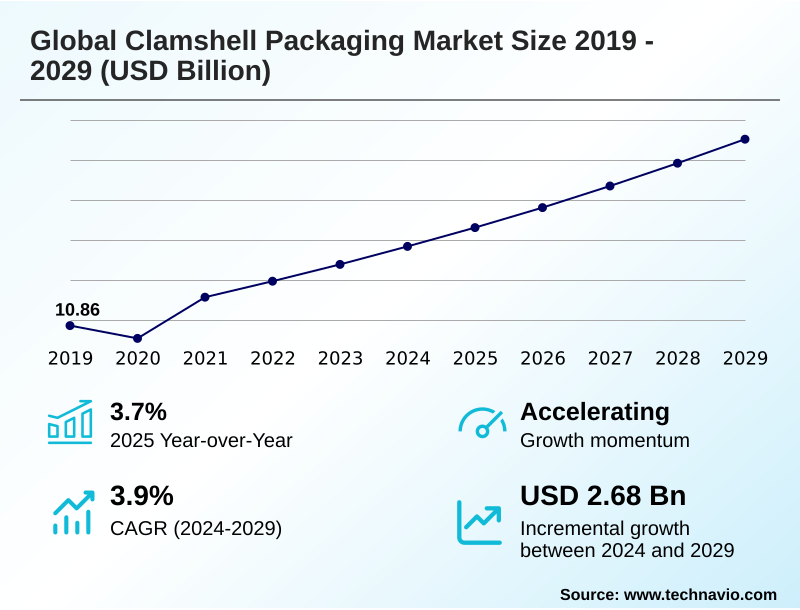
The clamshell packaging market size is valued to increase by USD 2.68 billion, at a CAGR of 3.9% from 2024 to 2029. Growth of multinational fast-food chains will drive the clamshell packaging market.

Major Market Trends & Insights

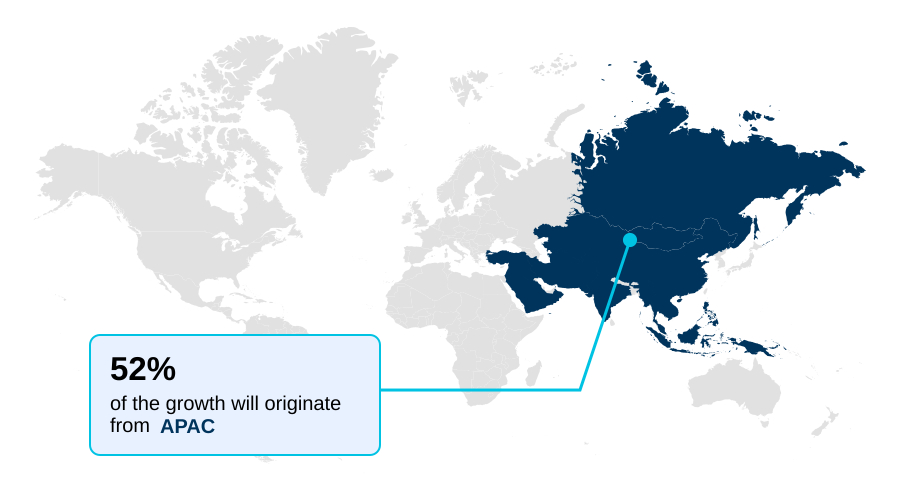
  • APAC dominated the market and accounted for a 51.6% growth during the forecast period.
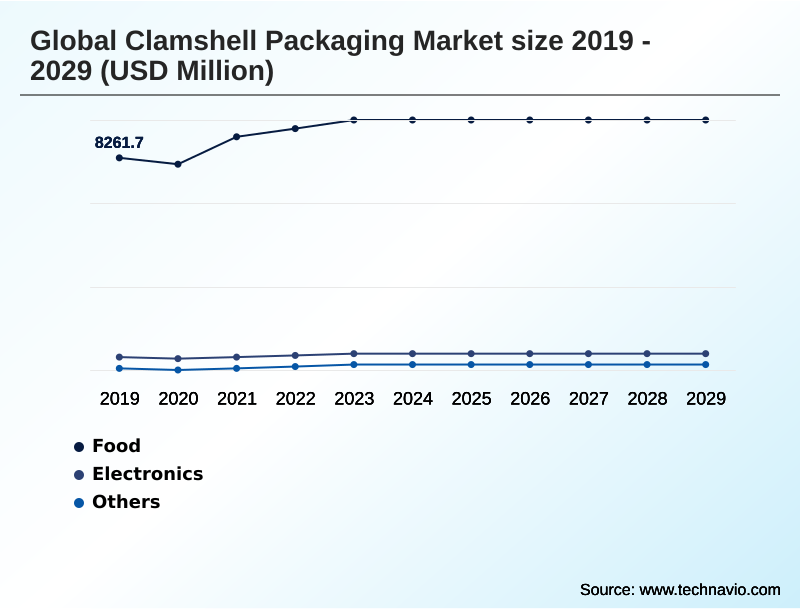
  • By End-user - Food segment was valued at USD 9.55 billion in 2023
  • By Type - 2-piece clamshells segment accounted for the largest market revenue share in 2023

Market Size & Forecast

  • Market Opportunities: USD 4.66 billion
  • Market Future Opportunities: USD 2.68 billion
  • CAGR from 2024 to 2029 : 3.9%

Market Summary

  • The clamshell packaging market is characterized by consistent growth, primarily fueled by consumer demand for convenience and product transparency, especially in the food and electronics sectors. The expansion of e-commerce and food delivery services relies heavily on tamper-evident packaging and robust designs to maintain supply chain integrity.
  • A key dynamic is the industry's pivot toward sustainability, driven by regulatory pressure and consumer sentiment against single-use plastics. This has accelerated packaging material innovation, with a focus on biopolymer-based clamshells and increasing post-consumer recycled content.
  • For instance, a food distributor aiming to reduce its environmental footprint must navigate the complexities of recycled material sourcing to meet both food safety compliance and sustainability goals.
  • This involves validating that recycled polyethylene terephthalate (rPET) suppliers can provide consistent quality for rigid plastic thermoforming without compromising the protective qualities or clear plastic packaging that consumers expect, showcasing the balance between operational efficiency and market-driven environmental responsibility.

What will be the Size of the Clamshell Packaging Market during the forecast period?

Get Key Insights on Market Forecast (PDF) Request Free Sample

How is the Clamshell Packaging Market Segmented?

The clamshell packaging industry research report provides comprehensive data (region-wise segment analysis), with forecasts and estimates in "USD million" for the period 2025-2029, as well as historical data from 2019-2023 for the following segments.

  • End-user
    • Food
    • Electronics
    • Others
  • Type
    • 2-piece clamshells
    • Tri-fold clamshells
    • Mock clamshells
    • Others
  • Product
    • Trays
    • Boxes and containers
    • Bowls
    • Others
  • Geography
    • APAC
      • China
      • Japan
      • India
    • North America
      • US
      • Canada
      • Mexico
    • Europe
      • Germany
      • UK
      • France
    • South America
      • Brazil
      • Argentina
      • Colombia
    • Middle East and Africa
      • Saudi Arabia
      • UAE
      • Turkey
    • Rest of World (ROW)

By End-user Insights

The food segment is estimated to witness significant growth during the forecast period.

The food sector remains the principal end-user, accounting for over 62% of market volume. Demand is driven by the need for durable product protection in fresh produce packaging and packaging for convenience foods.

The format's inherent product visibility enhancement is a critical factor for consumers, directly influencing purchasing decisions and providing enhanced shelf appeal. For ready-to-eat meal packaging, clamshells offer food safety compliance and prevent food spoilage.

The use of clear plastic packaging and robust food-grade plastic containers ensures that items are protected from product damage throughout the supply chain, reinforcing consumer trust. This segment’s performance underscores the packaging’s vital role in both marketing and logistics.

Request Free Sample

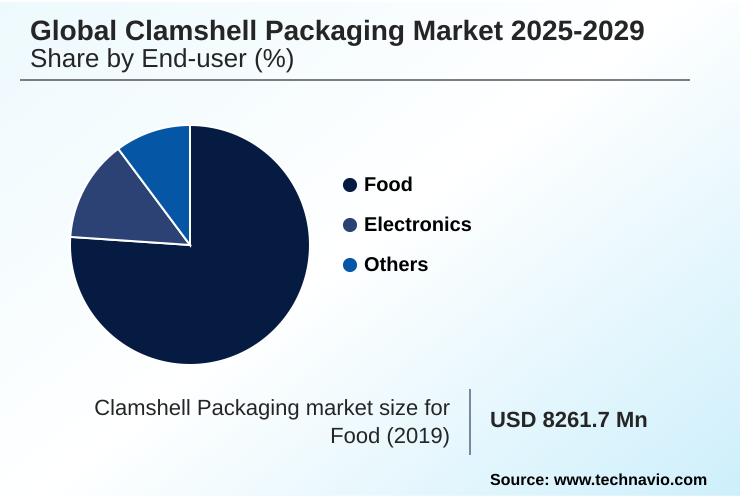
The Food segment was valued at USD 9.55 billion in 2023 and showed a gradual increase during the forecast period.

Request Free Sample

Regional Analysis

APAC is estimated to contribute 51.6% to the growth of the global market during the forecast period.Technavio’s analysts have elaborately explained the regional trends and drivers that shape the market during the forecast period.

See How Clamshell Packaging Market Demand is Rising in APAC Request Free Sample

The geographic landscape is led by APAC, which contributes over 51% of the incremental growth, driven by rapid urbanization and the expansion of organized retail.

This region is a focal point for implementing circular economy principles to combat plastic waste reduction.

In North America, the market is mature, with growth influenced by stringent sustainable packaging regulations, including mandates for up to 25% post-consumer recycled content in certain applications. This has intensified the focus on sustainable sourcing practices and packaging lifecycle management.

Europe follows similar trends, emphasizing eco-friendly packaging options and investing in infrastructure for recyclable pet packaging to achieve environmental impact reduction. These regional dynamics highlight a global shift toward responsible packaging waste management and material circularity initiatives.

Market Dynamics

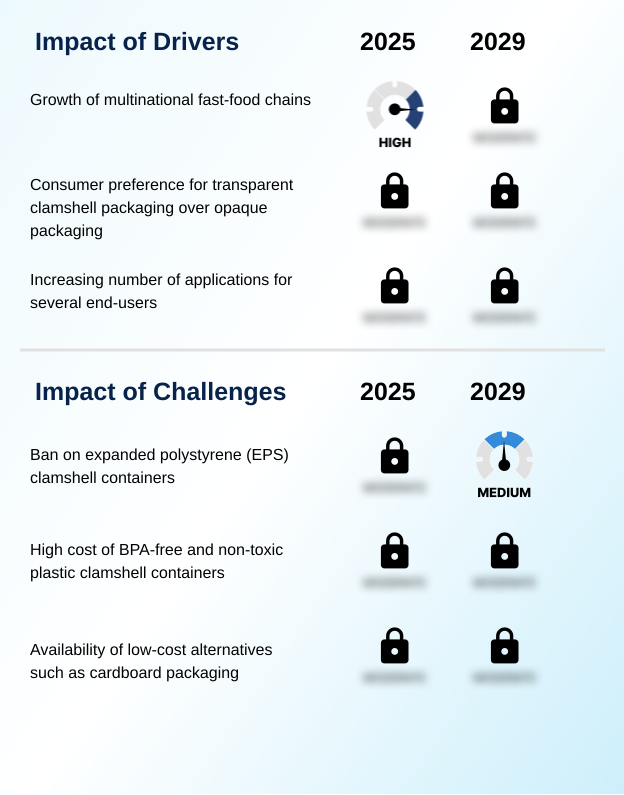
Our researchers analyzed the data with 2024 as the base year, along with the key drivers, trends, and challenges. A holistic analysis of drivers will help companies refine their marketing strategies to gain a competitive advantage.

  • The strategic direction of the clamshell packaging market is increasingly shaped by complex cost-benefit analyses and regulatory pressures. The cost of bpa-free plastic clamshell containers is a significant consideration for manufacturers, weighed against the growing consumer preference for transparent vs opaque packaging.
  • Concurrently, the impact of the eps foam ban on packaging choices has accelerated the demand for compostable clamshell containers in food service and innovations in bio-based and renewable packaging materials. This shift is not without its challenges, including challenges in recycling multi-material clamshells and supply chain challenges for pcr materials.
  • Thermoformed plastic applications in electronics packaging continue to expand, while the growth of multinational fast-food chains' packaging needs drives demand for standardized, efficient solutions. The role of clamshell packaging in reducing food waste is a key value proposition, particularly with trends in sustainable packaging for fresh produce.
  • Firms using lightweighting strategies for pet clamshells report material savings that are almost double those of five years ago. This optimization, alongside advancements in thermoforming for custom designs and integrating tamper-evident features in clamshell design, is critical for maintaining a competitive edge.
  • The market is also exploring market opportunities for fiber-based clamshells to mitigate the environmental footprint of different clamshell materials.

What are the key market drivers leading to the rise in the adoption of Clamshell Packaging Industry?

  • The market's growth is significantly driven by the ongoing global expansion of multinational fast-food chains.

  • Market growth is strongly propelled by the demand for convenience and protection in high-volume sectors. The expansion of e-commerce packaging solutions and QSR food packaging relies heavily on the reliability of thermoformed plastic packaging.
  • The inherent supply chain integrity provided by designs like the 2-piece clamshell construction with tamper-evident packaging features is critical.
  • Furthermore, the push for operational efficiency is driving the adoption of high-speed thermoforming and packaging design for automation, with some companies reducing packaging labor costs by up to 30%.
  • Lightweight packaging design initiatives not only reduce material usage but also lower freight expenses by as much as 15%. This combination of performance, security, and cost-effectiveness makes hinged container design and stock packaging options indispensable across multiple industries.

What are the market trends shaping the Clamshell Packaging Industry?

  • The increasing demand for compostable clamshell containers, driven by heightened environmental awareness, is emerging as a significant market trend.

  • Key market trends are centered on material innovation and circularity. The development of biopolymer-based clamshells and compostable packaging solutions is accelerating, driven by demand for sustainable fiber materials. Innovations in molded fiber technology are enabling the creation of plant-based fiber packaging that offers a viable alternative to plastic, with some new materials achieving over 95% compostability under industrial conditions.
  • Concurrently, advancements in polymer science and chemical recycling processes are improving the viability of closed-loop recycling systems. Technologies like digital watermarking for recycling are being tested to enhance sorting accuracy, which could boost the supply of high-quality recycled materials by over 20%. These custom thermoformed solutions and smart packaging integrations are redefining what is possible in sustainable design.

What challenges does the Clamshell Packaging Industry face during its growth?

  • Widespread bans on expanded polystyrene (EPS) clamshell containers present a key challenge that affects industry growth.

  • A primary challenge is managing the complexities of incorporating post-consumer recycled content into rigid plastic thermoforming processes. While recycled polyethylene terephthalate is in high demand for products like bakery goods containers, inconsistent quality in feedstock from advanced sorting technologies can increase production defects by up to 10%.
  • Ensuring compliance for food contact materials adds another layer of difficulty, as achieving the necessary purity standards with recycled inputs can raise processing costs by over 25%. This impacts the economic viability of using materials with high PCR content in applications like consumer electronics packaging or those requiring anti-fog packaging films.
  • The need for thermoforming process optimization to handle material variability without compromising the integrity of mock clamshell design or tri-fold clamshell format remains a significant operational hurdle.

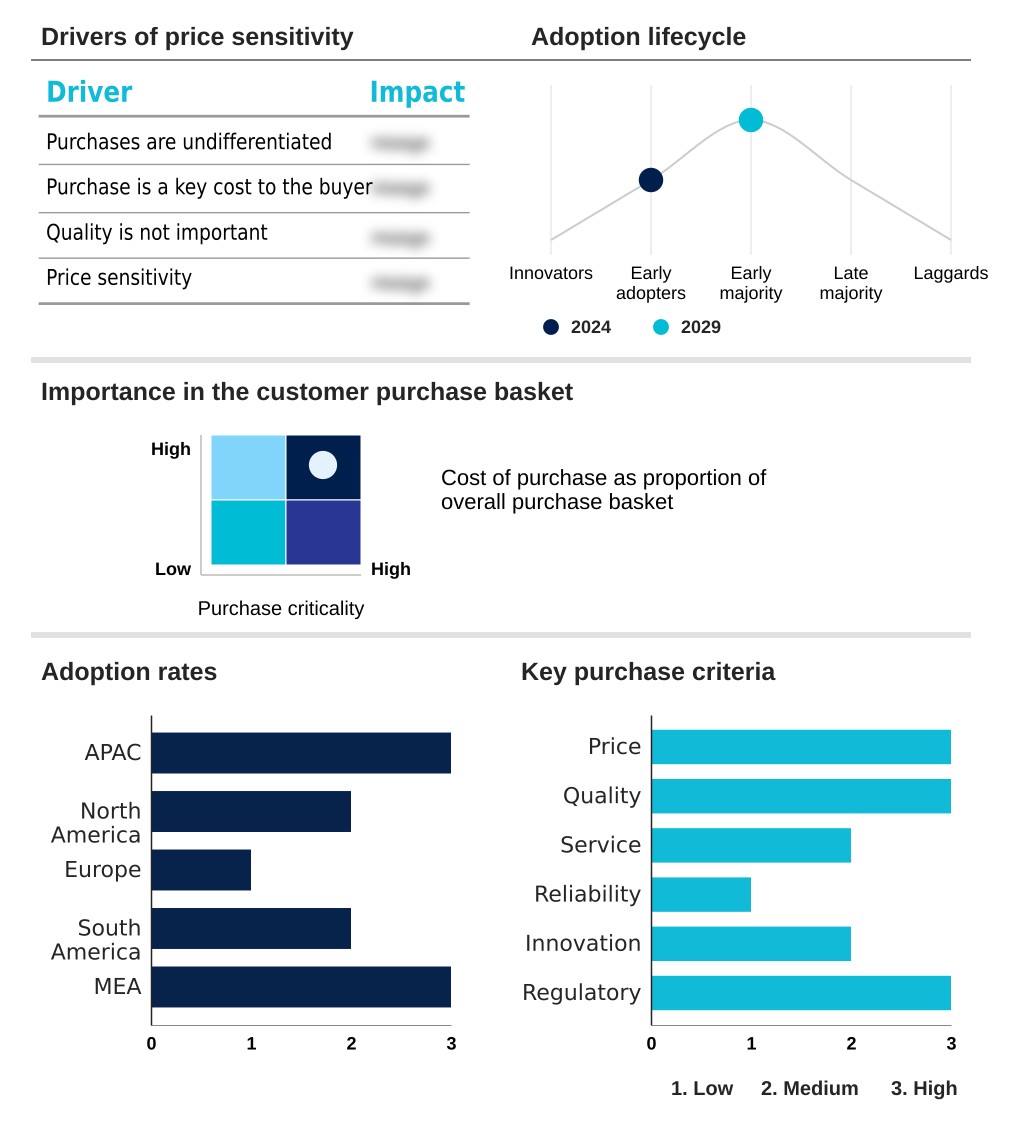
Exclusive Technavio Analysis on Customer Landscape

The clamshell packaging market forecasting report includes the adoption lifecycle of the market, covering from the innovator’s stage to the laggard’s stage. It focuses on adoption rates in different regions based on penetration. Furthermore, the clamshell packaging market report also includes key purchase criteria and drivers of price sensitivity to help companies evaluate and develop their market growth analysis strategies.

Customer Landscape of Clamshell Packaging Industry

Competitive Landscape

Companies are implementing various strategies, such as strategic alliances, clamshell packaging market forecast, partnerships, mergers and acquisitions, geographical expansion, and product/service launches, to enhance their presence in the industry.

Amcor Plc - Vendors provide custom and stock thermoformed clamshells, emphasizing product visibility, protection, and increasingly sustainable materials to meet diverse industry requirements.

The industry research and growth report includes detailed analyses of the competitive landscape of the market and information about key companies, including:

  • Amcor Plc
  • Blisterpak Inc.
  • Clearpack Engineering Inc.
  • Creative Plastics
  • Dordan Manufacturing Co.
  • Footprint
  • Helmy Plastics
  • Lacerta Group LLC
  • Novolex
  • Panic Plastics Inc.
  • Parksons Packaging Ltd.
  • Placon Corp.
  • Plastic Ingenuity
  • Prime Packaging LLC
  • QPC Pack
  • Sinclair and Rush Inc.
  • Smurfit Kappa Group
  • Sonoco Products Co.
  • Universal Plastics Group Inc.
  • WestRock Co.

Qualitative and quantitative analysis of companies has been conducted to help clients understand the wider business environment as well as the strengths and weaknesses of key industry players. Data is qualitatively analyzed to categorize companies as pure play, category-focused, industry-focused, and diversified; it is quantitatively analyzed to categorize companies as dominant, leading, strong, tentative, and weak.

Recent Development and News in Clamshell packaging market

  • In September, 2024, Amcor Plc announced the launch of a new line of 100% rPET clamshells for fresh produce, achieving full circularity in partnership with a major grocery chain.
  • In November, 2024, WestRock Co. completed its acquisition of a leading European molded fiber technology firm, expanding its portfolio of plastic-alternative clamshells for the food service sector.
  • In February, 2025, Sonoco Products Co. unveiled a strategic partnership with a chemical recycling pioneer to create a closed-loop system for its food-grade thermoformed plastic containers, aiming to process over 50,000 tons annually.
  • In April, 2025, Footprint announced it received regulatory approval in the European Union for its new plant-based, compostable material intended for frozen food clamshell applications, a major market entry milestone.

Dive into Technavio’s robust research methodology, blending expert interviews, extensive data synthesis, and validated models for unparalleled Clamshell Packaging Market insights. See full methodology.

Market Scope
Page number 293
Base year 2024
Historic period 2019-2023
Forecast period 2025-2029
Growth momentum & CAGR Accelerate at a CAGR of 3.9%
Market growth 2025-2029 USD 2682.9 million
Market structure Fragmented
YoY growth 2024-2025(%) 3.7%
Key countries China, Japan, India, South Korea, Australia, Singapore, US, Canada, Mexico, Germany, UK, France, Italy, Russia, Spain, Brazil, Argentina, Colombia, Saudi Arabia, UAE, Turkey, Egypt and Nigeria
Competitive landscape Leading Companies, Market Positioning of Companies, Competitive Strategies, and Industry Risks

Request Free Sample

Research Analyst Overview

  • The market is undergoing a significant transformation driven by the dual pressures of performance and sustainability. Core functionalities like durable product protection and product visibility enhancement are now baseline expectations. The competitive frontier has shifted to material science, where innovations in biopolymer-based clamshells and plant-based fiber packaging are gaining traction.
  • Adherence to circular economy principles is no longer optional; it is a central pillar of corporate strategy, forcing advancements in thermoforming process optimization and packaging lifecycle management. A key boardroom consideration is navigating the volatile landscape of food contact materials regulations, which directly impacts sustainable sourcing practices and the feasibility of using recycled polyethylene terephthalate.
  • Firms that successfully integrate post-consumer recycled content into their food-grade plastic containers, with some achieving a 15% improvement in material efficiency through lightweight packaging design, are better positioned to capture market share. This pivot requires substantial investment in both technology and supply chain integrity to ensure food safety compliance while meeting environmental mandates.

What are the Key Data Covered in this Clamshell Packaging Market Research and Growth Report?

  • What is the expected growth of the Clamshell Packaging Market between 2025 and 2029?

    • USD 2.68 billion, at a CAGR of 3.9%

  • What segmentation does the market report cover?

    • The report is segmented by End-user (Food, Electronics, and Others), Type (2-piece clamshells, Tri-fold clamshells, Mock clamshells, and Others), Product (Trays, Boxes and containers, Bowls, and Others) and Geography (APAC, North America, Europe, South America, Middle East and Africa)

  • Which regions are analyzed in the report?

    • APAC, North America, Europe, South America and Middle East and Africa

  • What are the key growth drivers and market challenges?

    • Growth of multinational fast-food chains, Ban on expanded polystyrene (EPS) clamshell containers

  • Who are the major players in the Clamshell Packaging Market?

    • Amcor Plc, Blisterpak Inc., Clearpack Engineering Inc., Creative Plastics, Dordan Manufacturing Co., Footprint, Helmy Plastics, Lacerta Group LLC, Novolex, Panic Plastics Inc., Parksons Packaging Ltd., Placon Corp., Plastic Ingenuity, Prime Packaging LLC, QPC Pack, Sinclair and Rush Inc., Smurfit Kappa Group, Sonoco Products Co., Universal Plastics Group Inc. and WestRock Co.

Market Research Insights

  • The market's dynamics are shaped by a strong consumer preference for transparency and the relentless growth of e-commerce packaging solutions, which demand robust protection. Firms leveraging advanced sorting technologies are improving material circularity initiatives, with some recycling facilities increasing PET recovery rates by over 15%. This push aligns with sustainable packaging regulations that often mandate minimum recycled content.
  • Concurrently, advancements in polymer science are enabling designs that reduce material use without compromising integrity. This focus on efficiency and sustainability is evident as companies adopting these innovations report an average 10% reduction in packaging-related costs, demonstrating a clear link between environmental responsibility and financial performance in retail product display.

We can help! Our analysts can customize this clamshell packaging market research report to meet your requirements.

Get in touch

1. Executive Summary

1.1 Market overview

Executive Summary - Chart on Market Overview
Executive Summary - Data Table on Market Overview
Executive Summary - Chart on Global Market Characteristics
Executive Summary - Chart on Market by Geography
Executive Summary - Chart on Market Segmentation by End-user
Executive Summary - Chart on Market Segmentation by Type
Executive Summary - Chart on Market Segmentation by Product
Executive Summary - Chart on Incremental Growth
Executive Summary - Data Table on Incremental Growth
Executive Summary - Chart on Company Market Positioning

2. Technavio Analysis

2.1 Analysis of price sensitivity, lifecycle, customer purchase basket, adoption rates, and purchase criteria

2.2 Criticality of inputs and Factors of differentiation

Chart on Overview on criticality of inputs and factors of differentiation

2.3 Factors of disruption

Chart on Overview on factors of disruption

2.4 Impact of drivers and challenges

Chart on Impact of drivers and challenges in 2024 and 2029

3. Market Landscape

3.1 Market ecosystem

Chart on Parent Market
Data Table on - Parent Market

3.2 Market characteristics

Chart on Market characteristics analysis

3.3 Value chain analysis

Chart on Value chain analysis

4. Market Sizing

4.1 Market definition

Data Table on Offerings of companies included in the market definition

4.2 Market segment analysis

Market segments

4.3 Market size 2024

4.4 Market outlook: Forecast for 2024-2029

Chart on Global - Market size and forecast 2024-2029 ($ million)
Data Table on Global - Market size and forecast 2024-2029 ($ million)
Chart on Global Market: Year-over-year growth 2024-2029 (%)
Data Table on Global Market: Year-over-year growth 2024-2029 (%)

5. Historic Market Size

5.1 Global Clamshell Packaging Market 2019 - 2023

Historic Market Size - Data Table on Global Clamshell Packaging Market 2019 - 2023 ($ million)

5.2 End-user segment analysis 2019 - 2023

Historic Market Size - End-user Segment 2019 - 2023 ($ million)

5.3 Type segment analysis 2019 - 2023

Historic Market Size - Type Segment 2019 - 2023 ($ million)

5.4 Product segment analysis 2019 - 2023

Historic Market Size - Product Segment 2019 - 2023 ($ million)

5.5 Geography segment analysis 2019 - 2023

Historic Market Size - Geography Segment 2019 - 2023 ($ million)

5.6 Country segment analysis 2019 - 2023

Historic Market Size - Country Segment 2019 - 2023 ($ million)

6. Qualitative Analysis

6.1 Impact of AI on global clamshell packaging market

7. Five Forces Analysis

7.1 Five forces summary

Five forces analysis - Comparison between 2024 and 2029

7.2 Bargaining power of buyers

Bargaining power of buyers - Impact of key factors 2024 and 2029

7.3 Bargaining power of suppliers

Bargaining power of suppliers - Impact of key factors in 2024 and 2029

7.4 Threat of new entrants

Threat of new entrants - Impact of key factors in 2024 and 2029

7.5 Threat of substitutes

Threat of substitutes - Impact of key factors in 2024 and 2029

7.6 Threat of rivalry

Threat of rivalry - Impact of key factors in 2024 and 2029

7.7 Market condition

Chart on Market condition - Five forces 2024 and 2029

8. Market Segmentation by End-user

8.1 Market segments

Chart on End-user - Market share 2024-2029 (%)
Data Table on End-user - Market share 2024-2029 (%)

8.2 Comparison by End-user

Chart on Comparison by End-user
Data Table on Comparison by End-user

8.3 Food - Market size and forecast 2024-2029

Chart on Food - Market size and forecast 2024-2029 ($ million)
Data Table on Food - Market size and forecast 2024-2029 ($ million)
Chart on Food - Year-over-year growth 2024-2029 (%)
Data Table on Food - Year-over-year growth 2024-2029 (%)

8.4 Electronics - Market size and forecast 2024-2029

Chart on Electronics - Market size and forecast 2024-2029 ($ million)
Data Table on Electronics - Market size and forecast 2024-2029 ($ million)
Chart on Electronics - Year-over-year growth 2024-2029 (%)
Data Table on Electronics - Year-over-year growth 2024-2029 (%)

8.5 Others - Market size and forecast 2024-2029

Chart on Others - Market size and forecast 2024-2029 ($ million)
Data Table on Others - Market size and forecast 2024-2029 ($ million)
Chart on Others - Year-over-year growth 2024-2029 (%)
Data Table on Others - Year-over-year growth 2024-2029 (%)

8.6 Market opportunity by End-user

Market opportunity by End-user ($ million)
Data Table on Market opportunity by End-user ($ million)

9. Market Segmentation by Type

9.1 Market segments

Chart on Type - Market share 2024-2029 (%)
Data Table on Type - Market share 2024-2029 (%)

9.2 Comparison by Type

Chart on Comparison by Type
Data Table on Comparison by Type

9.3 2-piece clamshells - Market size and forecast 2024-2029

Chart on 2-piece clamshells - Market size and forecast 2024-2029 ($ million)
Data Table on 2-piece clamshells - Market size and forecast 2024-2029 ($ million)
Chart on 2-piece clamshells - Year-over-year growth 2024-2029 (%)
Data Table on 2-piece clamshells - Year-over-year growth 2024-2029 (%)

9.4 Tri-fold clamshells - Market size and forecast 2024-2029

Chart on Tri-fold clamshells - Market size and forecast 2024-2029 ($ million)
Data Table on Tri-fold clamshells - Market size and forecast 2024-2029 ($ million)
Chart on Tri-fold clamshells - Year-over-year growth 2024-2029 (%)
Data Table on Tri-fold clamshells - Year-over-year growth 2024-2029 (%)

9.5 Mock clamshells - Market size and forecast 2024-2029

Chart on Mock clamshells - Market size and forecast 2024-2029 ($ million)
Data Table on Mock clamshells - Market size and forecast 2024-2029 ($ million)
Chart on Mock clamshells - Year-over-year growth 2024-2029 (%)
Data Table on Mock clamshells - Year-over-year growth 2024-2029 (%)

9.6 Others - Market size and forecast 2024-2029

Chart on Others - Market size and forecast 2024-2029 ($ million)
Data Table on Others - Market size and forecast 2024-2029 ($ million)
Chart on Others - Year-over-year growth 2024-2029 (%)
Data Table on Others - Year-over-year growth 2024-2029 (%)

9.7 Market opportunity by Type

Market opportunity by Type ($ million)
Data Table on Market opportunity by Type ($ million)

10. Market Segmentation by Product

10.1 Market segments

Chart on Product - Market share 2024-2029 (%)
Data Table on Product - Market share 2024-2029 (%)

10.2 Comparison by Product

Chart on Comparison by Product
Data Table on Comparison by Product

10.3 Trays - Market size and forecast 2024-2029

Chart on Trays - Market size and forecast 2024-2029 ($ million)
Data Table on Trays - Market size and forecast 2024-2029 ($ million)
Chart on Trays - Year-over-year growth 2024-2029 (%)
Data Table on Trays - Year-over-year growth 2024-2029 (%)

10.4 Boxes and containers - Market size and forecast 2024-2029

Chart on Boxes and containers - Market size and forecast 2024-2029 ($ million)
Data Table on Boxes and containers - Market size and forecast 2024-2029 ($ million)
Chart on Boxes and containers - Year-over-year growth 2024-2029 (%)
Data Table on Boxes and containers - Year-over-year growth 2024-2029 (%)

10.5 Bowls - Market size and forecast 2024-2029

Chart on Bowls - Market size and forecast 2024-2029 ($ million)
Data Table on Bowls - Market size and forecast 2024-2029 ($ million)
Chart on Bowls - Year-over-year growth 2024-2029 (%)
Data Table on Bowls - Year-over-year growth 2024-2029 (%)

10.6 Others - Market size and forecast 2024-2029

Chart on Others - Market size and forecast 2024-2029 ($ million)
Data Table on Others - Market size and forecast 2024-2029 ($ million)
Chart on Others - Year-over-year growth 2024-2029 (%)
Data Table on Others - Year-over-year growth 2024-2029 (%)

10.7 Market opportunity by Product

Market opportunity by Product ($ million)
Data Table on Market opportunity by Product ($ million)

11. Customer Landscape

11.1 Customer landscape overview

Analysis of price sensitivity, lifecycle, customer purchase basket, adoption rates, and purchase criteria

12. Geographic Landscape

12.1 Geographic segmentation

Chart on Market share by geography 2024-2029 (%)
Data Table on Market share by geography 2024-2029 (%)

12.2 Geographic comparison

Chart on Geographic comparison
Data Table on Geographic comparison

12.3 APAC - Market size and forecast 2024-2029

Chart on APAC - Market size and forecast 2024-2029 ($ million)
Data Table on APAC - Market size and forecast 2024-2029 ($ million)
Chart on APAC - Year-over-year growth 2024-2029 (%)
Data Table on APAC - Year-over-year growth 2024-2029 (%)
Chart on Regional Comparison - APAC
Data Table on Regional Comparison - APAC

12.3.1 China - Market size and forecast 2024-2029

Chart on China - Market size and forecast 2024-2029 ($ million)
Data Table on China - Market size and forecast 2024-2029 ($ million)
Chart on China - Year-over-year growth 2024-2029 (%)
Data Table on China - Year-over-year growth 2024-2029 (%)

12.3.2 Japan - Market size and forecast 2024-2029

Chart on Japan - Market size and forecast 2024-2029 ($ million)
Data Table on Japan - Market size and forecast 2024-2029 ($ million)
Chart on Japan - Year-over-year growth 2024-2029 (%)
Data Table on Japan - Year-over-year growth 2024-2029 (%)

12.3.3 India - Market size and forecast 2024-2029

Chart on India - Market size and forecast 2024-2029 ($ million)
Data Table on India - Market size and forecast 2024-2029 ($ million)
Chart on India - Year-over-year growth 2024-2029 (%)
Data Table on India - Year-over-year growth 2024-2029 (%)

12.3.4 South Korea - Market size and forecast 2024-2029

Chart on South Korea - Market size and forecast 2024-2029 ($ million)
Data Table on South Korea - Market size and forecast 2024-2029 ($ million)
Chart on South Korea - Year-over-year growth 2024-2029 (%)
Data Table on South Korea - Year-over-year growth 2024-2029 (%)

12.3.5 Australia - Market size and forecast 2024-2029

Chart on Australia - Market size and forecast 2024-2029 ($ million)
Data Table on Australia - Market size and forecast 2024-2029 ($ million)
Chart on Australia - Year-over-year growth 2024-2029 (%)
Data Table on Australia - Year-over-year growth 2024-2029 (%)

12.3.6 Singapore - Market size and forecast 2024-2029

Chart on Singapore - Market size and forecast 2024-2029 ($ million)
Data Table on Singapore - Market size and forecast 2024-2029 ($ million)
Chart on Singapore - Year-over-year growth 2024-2029 (%)
Data Table on Singapore - Year-over-year growth 2024-2029 (%)

12.4 North America - Market size and forecast 2024-2029

Chart on North America - Market size and forecast 2024-2029 ($ million)
Data Table on North America - Market size and forecast 2024-2029 ($ million)
Chart on North America - Year-over-year growth 2024-2029 (%)
Data Table on North America - Year-over-year growth 2024-2029 (%)
Chart on Regional Comparison - North America
Data Table on Regional Comparison - North America

12.4.1 US - Market size and forecast 2024-2029

Chart on US - Market size and forecast 2024-2029 ($ million)
Data Table on US - Market size and forecast 2024-2029 ($ million)
Chart on US - Year-over-year growth 2024-2029 (%)
Data Table on US - Year-over-year growth 2024-2029 (%)

12.4.2 Canada - Market size and forecast 2024-2029

Chart on Canada - Market size and forecast 2024-2029 ($ million)
Data Table on Canada - Market size and forecast 2024-2029 ($ million)
Chart on Canada - Year-over-year growth 2024-2029 (%)
Data Table on Canada - Year-over-year growth 2024-2029 (%)

12.4.3 Mexico - Market size and forecast 2024-2029

Chart on Mexico - Market size and forecast 2024-2029 ($ million)
Data Table on Mexico - Market size and forecast 2024-2029 ($ million)
Chart on Mexico - Year-over-year growth 2024-2029 (%)
Data Table on Mexico - Year-over-year growth 2024-2029 (%)

12.5 Europe - Market size and forecast 2024-2029

Chart on Europe - Market size and forecast 2024-2029 ($ million)
Data Table on Europe - Market size and forecast 2024-2029 ($ million)
Chart on Europe - Year-over-year growth 2024-2029 (%)
Data Table on Europe - Year-over-year growth 2024-2029 (%)
Chart on Regional Comparison - Europe
Data Table on Regional Comparison - Europe

12.5.1 Germany - Market size and forecast 2024-2029

Chart on Germany - Market size and forecast 2024-2029 ($ million)
Data Table on Germany - Market size and forecast 2024-2029 ($ million)
Chart on Germany - Year-over-year growth 2024-2029 (%)
Data Table on Germany - Year-over-year growth 2024-2029 (%)

12.5.2 UK - Market size and forecast 2024-2029

Chart on UK - Market size and forecast 2024-2029 ($ million)
Data Table on UK - Market size and forecast 2024-2029 ($ million)
Chart on UK - Year-over-year growth 2024-2029 (%)
Data Table on UK - Year-over-year growth 2024-2029 (%)

12.5.3 France - Market size and forecast 2024-2029

Chart on France - Market size and forecast 2024-2029 ($ million)
Data Table on France - Market size and forecast 2024-2029 ($ million)
Chart on France - Year-over-year growth 2024-2029 (%)
Data Table on France - Year-over-year growth 2024-2029 (%)

12.5.4 Italy - Market size and forecast 2024-2029

Chart on Italy - Market size and forecast 2024-2029 ($ million)
Data Table on Italy - Market size and forecast 2024-2029 ($ million)
Chart on Italy - Year-over-year growth 2024-2029 (%)
Data Table on Italy - Year-over-year growth 2024-2029 (%)

12.5.5 Russia - Market size and forecast 2024-2029

Chart on Russia - Market size and forecast 2024-2029 ($ million)
Data Table on Russia - Market size and forecast 2024-2029 ($ million)
Chart on Russia - Year-over-year growth 2024-2029 (%)
Data Table on Russia - Year-over-year growth 2024-2029 (%)

12.5.6 Spain - Market size and forecast 2024-2029

Chart on Spain - Market size and forecast 2024-2029 ($ million)
Data Table on Spain - Market size and forecast 2024-2029 ($ million)
Chart on Spain - Year-over-year growth 2024-2029 (%)
Data Table on Spain - Year-over-year growth 2024-2029 (%)

12.6 South America - Market size and forecast 2024-2029

Chart on South America - Market size and forecast 2024-2029 ($ million)
Data Table on South America - Market size and forecast 2024-2029 ($ million)
Chart on South America - Year-over-year growth 2024-2029 (%)
Data Table on South America - Year-over-year growth 2024-2029 (%)
Chart on Regional Comparison - South America
Data Table on Regional Comparison - South America

12.6.1 Brazil - Market size and forecast 2024-2029

Chart on Brazil - Market size and forecast 2024-2029 ($ million)
Data Table on Brazil - Market size and forecast 2024-2029 ($ million)
Chart on Brazil - Year-over-year growth 2024-2029 (%)
Data Table on Brazil - Year-over-year growth 2024-2029 (%)

12.6.2 Argentina - Market size and forecast 2024-2029

Chart on Argentina - Market size and forecast 2024-2029 ($ million)
Data Table on Argentina - Market size and forecast 2024-2029 ($ million)
Chart on Argentina - Year-over-year growth 2024-2029 (%)
Data Table on Argentina - Year-over-year growth 2024-2029 (%)

12.6.3 Colombia - Market size and forecast 2024-2029

Chart on Colombia - Market size and forecast 2024-2029 ($ million)
Data Table on Colombia - Market size and forecast 2024-2029 ($ million)
Chart on Colombia - Year-over-year growth 2024-2029 (%)
Data Table on Colombia - Year-over-year growth 2024-2029 (%)

12.7 Middle East and Africa - Market size and forecast 2024-2029

Chart on Middle East and Africa - Market size and forecast 2024-2029 ($ million)
Data Table on Middle East and Africa - Market size and forecast 2024-2029 ($ million)
Chart on Middle East and Africa - Year-over-year growth 2024-2029 (%)
Data Table on Middle East and Africa - Year-over-year growth 2024-2029 (%)
Chart on Regional Comparison - Middle East and Africa
Data Table on Regional Comparison - Middle East and Africa

12.7.1 Saudi Arabia - Market size and forecast 2024-2029

Chart on Saudi Arabia - Market size and forecast 2024-2029 ($ million)
Data Table on Saudi Arabia - Market size and forecast 2024-2029 ($ million)
Chart on Saudi Arabia - Year-over-year growth 2024-2029 (%)
Data Table on Saudi Arabia - Year-over-year growth 2024-2029 (%)

12.7.2 UAE - Market size and forecast 2024-2029

Chart on UAE - Market size and forecast 2024-2029 ($ million)
Data Table on UAE - Market size and forecast 2024-2029 ($ million)
Chart on UAE - Year-over-year growth 2024-2029 (%)
Data Table on UAE - Year-over-year growth 2024-2029 (%)

12.7.3 Turkey - Market size and forecast 2024-2029

Chart on Turkey - Market size and forecast 2024-2029 ($ million)
Data Table on Turkey - Market size and forecast 2024-2029 ($ million)
Chart on Turkey - Year-over-year growth 2024-2029 (%)
Data Table on Turkey - Year-over-year growth 2024-2029 (%)

12.7.4 Egypt - Market size and forecast 2024-2029

Chart on Egypt - Market size and forecast 2024-2029 ($ million)
Data Table on Egypt - Market size and forecast 2024-2029 ($ million)
Chart on Egypt - Year-over-year growth 2024-2029 (%)
Data Table on Egypt - Year-over-year growth 2024-2029 (%)

12.7.5 Nigeria - Market size and forecast 2024-2029

Chart on Nigeria - Market size and forecast 2024-2029 ($ million)
Data Table on Nigeria - Market size and forecast 2024-2029 ($ million)
Chart on Nigeria - Year-over-year growth 2024-2029 (%)
Data Table on Nigeria - Year-over-year growth 2024-2029 (%)

12.8 Market opportunity by geography

Market opportunity by geography ($ million)
Data Tables on Market opportunity by geography ($ million)

13. Drivers, Challenges, and Opportunity

13.1 Market drivers

Growth of multinational fast-food chains
Consumer preference for transparent clamshell packaging over opaque packaging
Increasing number of applications for several end-users

13.2 Market challenges

Ban on expanded polystyrene (EPS) clamshell containers
High cost of BPA-free and non-toxic plastic clamshell containers
Availability of low-cost alternatives such as cardboard packaging

13.3 Impact of drivers and challenges

Impact of drivers and challenges in 2024 and 2029

13.4 Market opportunities

Demand for compostable clamshell containers
Growing consumer demand for convenience food
Growing relevance of thermoformed plastic in packaging

14. Competitive Landscape

14.1 Overview

14.2

Overview on criticality of inputs and factors of differentiation

14.3 Landscape disruption

Overview on factors of disruption

14.4 Industry risks

Impact of key risks on business

15. Competitive Analysis

15.1 Companies profiled

Companies covered

15.2 Company ranking index

15.3 Market positioning of companies

Matrix on companies position and classification

15.4 Amcor Plc

Amcor Plc - Overview
Amcor Plc - Business segments
Amcor Plc - Key news
Amcor Plc - Key offerings
Amcor Plc - Segment focus
SWOT

15.5 Blisterpak Inc.

Blisterpak Inc. - Overview
Blisterpak Inc. - Product / Service
Blisterpak Inc. - Key offerings
SWOT

15.6 Clearpack Engineering Inc.

Clearpack Engineering Inc. - Overview
Clearpack Engineering Inc. - Product / Service
Clearpack Engineering Inc. - Key offerings
SWOT

15.7 Creative Plastics

Creative Plastics - Overview
Creative Plastics - Product / Service
Creative Plastics - Key offerings
SWOT

15.8 Dordan Manufacturing Co.

Dordan Manufacturing Co. - Overview
Dordan Manufacturing Co. - Product / Service
Dordan Manufacturing Co. - Key offerings
SWOT

15.9 Footprint

Footprint - Overview
Footprint - Product / Service
Footprint - Key offerings
SWOT

15.10 Helmy Plastics

Helmy Plastics - Overview
Helmy Plastics - Product / Service
Helmy Plastics - Key offerings
SWOT

15.11 Lacerta Group LLC

Lacerta Group LLC - Overview
Lacerta Group LLC - Product / Service
Lacerta Group LLC - Key offerings
SWOT

15.12 Parksons Packaging Ltd.

Parksons Packaging Ltd. - Overview
Parksons Packaging Ltd. - Product / Service
Parksons Packaging Ltd. - Key offerings
SWOT

15.13 Placon Corp.

Placon Corp. - Overview
Placon Corp. - Product / Service
Placon Corp. - Key offerings
SWOT

15.14 Sinclair and Rush Inc.

Sinclair and Rush Inc. - Overview
Sinclair and Rush Inc. - Product / Service
Sinclair and Rush Inc. - Key offerings
SWOT

15.15 Smurfit Kappa Group

Smurfit Kappa Group - Overview
Smurfit Kappa Group - Business segments
Smurfit Kappa Group - Key news
Smurfit Kappa Group - Key offerings
Smurfit Kappa Group - Segment focus
SWOT

15.16 Sonoco Products Co.

Sonoco Products Co. - Overview
Sonoco Products Co. - Business segments
Sonoco Products Co. - Key news
Sonoco Products Co. - Key offerings
Sonoco Products Co. - Segment focus
SWOT

15.17 Universal Plastics Group Inc.

Universal Plastics Group Inc. - Overview
Universal Plastics Group Inc. - Product / Service
Universal Plastics Group Inc. - Key offerings
SWOT

15.18 WestRock Co.

WestRock Co. - Overview
WestRock Co. - Business segments
WestRock Co. - Key news
WestRock Co. - Key offerings
WestRock Co. - Segment focus
SWOT

16. Appendix

16.1 Scope of the report

Market definition
Objectives
Notes and caveats

16.2 Inclusions and exclusions checklist

Inclusions checklist
Exclusions checklist

16.3 Currency conversion rates for US$

16.4 Research methodology

16.5 Data procurement

Information sources

16.6 Data validation

16.7 Validation techniques employed for market sizing

16.8 Data synthesis

16.9 360 degree market analysis

16.10 List of abbreviations

Research Methodology

Technavio presents a detailed picture of the market by way of study, synthesis, and summation of data from multiple sources. The analysts have presented the various facets of the market with a particular focus on identifying the key industry influencers. The data thus presented is comprehensive, reliable, and the result of extensive research, both primary and secondary.

INFORMATION SOURCES

Primary sources

  • Manufacturers and suppliers
  • Channel partners
  • Industry experts
  • Strategic decision makers

Secondary sources

  • Industry journals and periodicals
  • Government data
  • Financial reports of key industry players
  • Historical data
  • Press releases

DATA ANALYSIS

Data Synthesis

  • Collation of data
  • Estimation of key figures
  • Analysis of derived insights

Data Validation

  • Triangulation with data models
  • Reference against proprietary databases
  • Corroboration with industry experts

REPORT WRITING

Qualitative

  • Market drivers
  • Market challenges
  • Market trends
  • Five forces analysis

Quantitative

  • Market size and forecast
  • Market segmentation
  • Geographical insights
  • Competitive landscape

Interested in this report?

Get your sample now to see our research methodology and insights!

Download Now

Frequently Asked Questions

Clamshell Packaging market growth will increase by USD 2682.9 million during 2025-2029.

The Clamshell Packaging market is expected to grow at a CAGR of 3.9% during 2025-2029.

Clamshell Packaging market is segmented by End-user (Food, Electronics, Others) Type (2-piece clamshells, Tri-fold clamshells, Mock clamshells, Others) Product (Trays, Boxes and containers, Bowls, Others)

Amcor Plc, Blisterpak Inc., Clearpack Engineering Inc., Creative Plastics, Dordan Manufacturing Co., Footprint, Helmy Plastics, Lacerta Group LLC, Novolex, Panic Plastics Inc., Parksons Packaging Ltd., Placon Corp., Plastic Ingenuity, Prime Packaging LLC, QPC Pack, Sinclair and Rush Inc., Smurfit Kappa Group, Sonoco Products Co., Universal Plastics Group Inc., WestRock Co. are a few of the key vendors in the Clamshell Packaging market.

APAC will register the highest growth rate of 51.6% among the other regions. Therefore, the Clamshell Packaging market in APAC is expected to garner significant business opportunities for the vendors during the forecast period.

China, Japan, India, South Korea, Australia, Singapore, US, Canada, Mexico, Germany, UK, France, Italy, Russia, Spain, Brazil, Argentina, Colombia, Saudi Arabia, UAE, Turkey, Egypt, Nigeria

  • Growth of multinational fast-food chains is the driving factor this market.

The Clamshell Packaging market vendors should focus on grabbing business opportunities from the End-user segment as it accounted for the largest market share in the base year.