Clay Brick Market Analysis APAC, Europe, North America, Middle East and Africa, South America - US, China, India, Indonesia, UK - Size and Forecast 2024-2028

Clay Brick Market Analysis APAC, Europe, North America, Middle East and Africa, South America - US, China, India, Indonesia, UK - Size and Forecast 2024-2028

Published: Jan 2024 167 Pages SKU: IRTNTR77361

Market Overview at a Glance

$12.63 B
Market Opportunity
3.64%
CAGR
2.9
YoY growth 2023-2024(%)

Clay Brick Market Size 2024-2028 

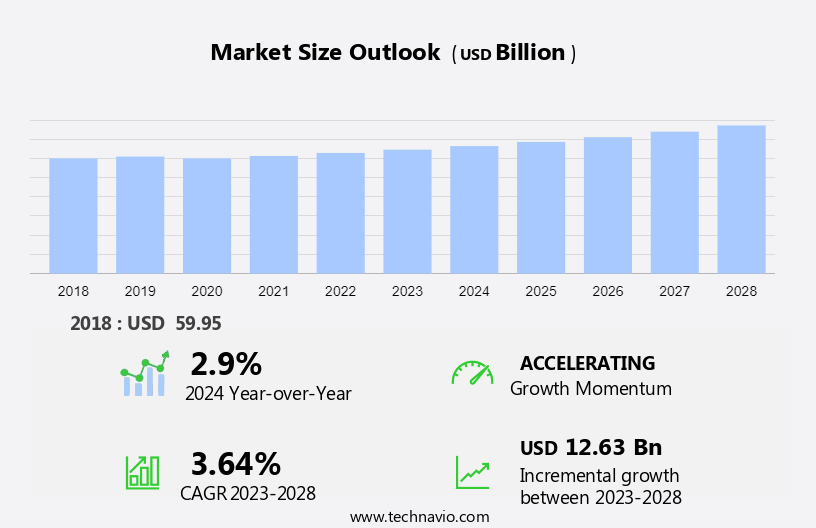
The clay brick market size is forecast to increase by USD 12.63 billion at a CAGR of 3.64% between 2023 and 2028.

  • The market is experiencing significant growth, driven by the expansion of the construction industry and infrastructure development. Government policies promoting the use of load-bearing walls and BTK (Brick-on-Edge) techniques in construction further boost market demand. Engineered wood products, such as laminated veneer lumber (LVL), particleboard, and oriented strand board (OSB), are increasingly being adopted in the construction sector. Advanced firing technologies, such as German technology, are being adopted to enhance the strength and durability of clay bricks, making them a cost-effective and attractive option for builders. However, raw material scarcity poses a challenge to market growth. Several industry players are investing in innovative solutions to address this issue. This analytical depiction highlights investment opportunities in the market, with a focus on advanced technologies and sustainable production methods.

What will be the Size of the Market During the Forecast Period?

Clay Brick Market Size

 Request Free Sample

  • The market plays a significant role in the building materials sector, contributing to various architectural styles and sustainable construction projects. This market encompasses the production and supply of clay bricks, which are eco-friendly materials, suitable for both residential and commercial applications. Clay bricks are produced using a traditional process that involves shaping and firing clay. This process is energy-efficient and results in a durable, long-lasting product. The versatility of clay bricks allows for size-based segmentation, including modular bricks, standard bricks, and jumbo bricks, catering to diverse project requirements.
  • Clay bricks are increasingly being used in exterior facades, interior spaces, and functional landscapes due to their adaptability and aesthetic appeal. They are popular in residential properties, commercial buildings, infrastructure projects, pathways, and landscaping. Energy efficiency is a crucial factor driving the growth of the market. The thermal mass properties of clay bricks help regulate indoor temperatures, reducing the need for excessive heating or cooling. This contributes to the overall energy efficiency of buildings and aligns with the growing focus on sustainable construction. Sustainable construction and eco-friendly materials are key trends in the building industry. Clay bricks, being a natural and renewable resource, are an ideal choice for projects aiming to minimize their carbon footprint.

How is this market segmented and which is the largest segment?

The market research report provides comprehensive data (region-wise segment analysis), with forecasts and estimates in "USD billion" for the period 2024-2028, as well as historical data from 2018-2022 for the following segments.
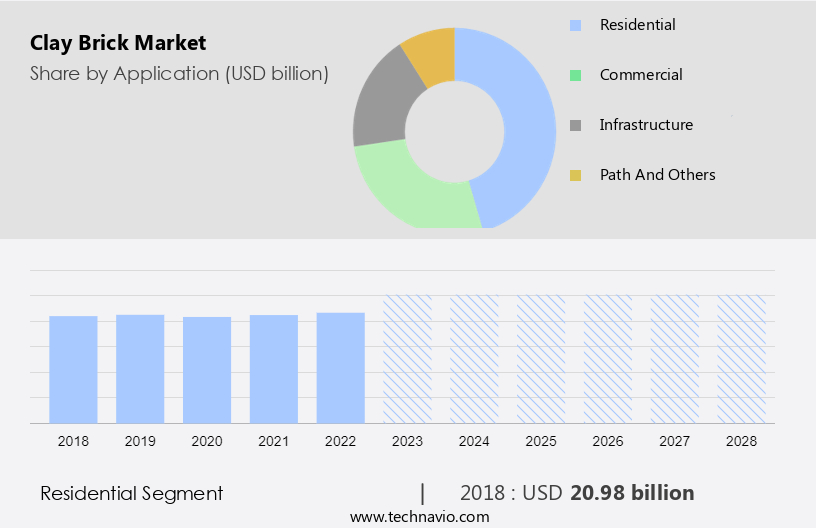
  • Application
    • Residential
    • Commercial
    • Infrastructure
    • Path and others
  • Type
    • Solid
    • Paver and facing
    • Hollow
  • Geography
    • APAC
      • China
      • India
    • Europe
      • UK
    • North America
      • US
    • Middle East and Africa
    • South America

By Application Insights

  • The residential segment is estimated to witness significant growth during the forecast period.

Clay bricks continue to be a popular choice in the residential construction market due to their durability, strength, and insulation properties. These bricks are widely used in building single-family homes, apartments, and other housing structures. Their classic, earthy appearance adds to the visual appeal of residential properties. The clay brick industry in the US is expected to witness growth, particularly in the modular segment, as there is a rising demand for sustainable and cost-effective construction solutions. Competitive intensity in the market is high, with various firing technologies used to produce clay bricks. However, environmental concerns and the push for sustainable practices are driving the adoption of advanced technologies and methods in the production process.

Furthermore, these sustainable practices not only help reduce the carbon footprint but also offer cost savings in the long run. According to market estimations, the market is projected to expand in the coming years. The residential segment is expected to generate significant revenue due to the increasing preference for energy-efficient and durable building materials. Clay bricks' thermal properties help regulate indoor temperatures, making them an attractive option for homeowners seeking to reduce energy consumption and save on heating and cooling costs. 

Clay Brick Market Size

Get a glance at the market report of share of various segments Request Free Sample

The residential segment was valued at USD 20.98 billion in 2018 and showed a gradual increase during the forecast period.

Regional Analysis

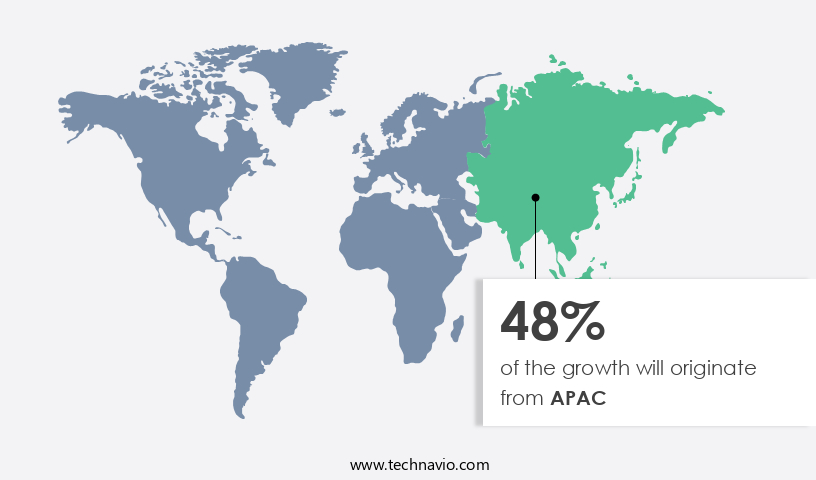
  • APAC is estimated to contribute 48% to the growth of the global market during the forecast period.

Technavio's analysts have elaborately explained the regional trends and drivers that shape the market during the forecast period.

Clay Brick Market Share by Geography

For more insights on the market share of various regions Request Free Sample

The construction sector in the Asia Pacific (APAC) region is experiencing substantial expansion, fueled by urbanization trends and the need for affordable housing solutions. This growth is driving demand in the market, as clay bricks remain a popular and cost-effective choice for residential construction. With increasing populations and urban migration, there is a heightened requirement for new housing and commercial spaces. Furthermore, governments in APAC countries, such as India and China, are investing significantly in infrastructure development, including roads, bridges, and public facilities, which in turn boosts the demand for clay bricks. The sustainable production process of clay bricks makes them an attractive option for the construction industry, as they offer a solution to habitat disruption caused by industrialization and project timelines.

Market Dynamics

Our researchers analyzed the data with 2023 as the base year, along with the key drivers, trends, and challenges. A holistic analysis of drivers will help companies refine their marketing strategies to gain a competitive advantage.

What are the key market drivers leading to the rise in adoption of Clay Brick Market?

The affordability and cost-effectiveness of clay bricks is the key driver of the market.

  • Clay bricks are a popular and economical choice for builders and construction projects in the United States due to their competitive pricing. The affordability of clay bricks is primarily attributed to their low production costs and the abundance of clay as a primary raw material. This cost-effectiveness makes clay bricks an attractive option for builders seeking to minimize construction expenses without compromising quality. Clay bricks come in various sizes, including standard, modular, and jumbo, catering to diverse architectural styles and sustainable construction projects. The clay production process is energy-efficient, making clay bricks an eco-friendly building material.
  • The size-based segmentation of clay bricks allows builders to select the most suitable option for their project, ensuring optimal use of resources and cost savings. In regions with easy access to clay deposits, the production of clay bricks is more cost-effective due to the reduced transportation costs of raw materials. The use of clay bricks contributes to energy efficiency and sustainable construction, making them an excellent choice for environmentally-conscious builders and homeowners. By incorporating clay bricks into their projects, builders can deliver durable and reliable structures while maintaining cost control.

What are the market trends shaping the Clay Brick Market?

The growing adoption of advanced firing technologies in clay brick production is the upcoming trend in the market.

  • In the Construction Industry, the adoption of advanced firing technologies for clay brick manufacturing is a significant trend. These technologies, including high-efficiency kilns and firing processes, contribute to both cost savings and sustainability. By minimizing energy consumption during production, these methods align with environmental goals and help clay brick manufacturers comply with emissions standards. Advanced firing technologies enable precise control over temperature and atmosphere conditions, resulting in high-quality clay bricks with consistent properties.
  • This level of optimization is crucial for meeting regulatory requirements and enhancing overall product quality. Infrastructure Development and Government Policies are driving the growth of the market, and companies are investing in German Technology to stay competitive. Despite raw material scarcity, the market presents numerous investment opportunities. 

What challenges does Clay Brick Market face during the growth?

Competition from alternative building materials is a key challenge affecting the market growth.

  • Concrete masonry units, or concrete blocks, serve as a viable alternative to clay bricks in the US construction industry. Manufactured from concrete, these blocks offer superior durability and strength. The adaptability of concrete blocks is evident in their extensive use in various building projects, including residential properties, commercial buildings, and infrastructure projects. Aerated Autoclaved Concrete (AAC) is a lightweight precast concrete option that boasts excellent insulation properties. Its low density, thermal efficiency, and ease of construction make it a preferred choice for modern building designs.
  • These materials offer sustainability advantages and are versatile in their applications. The use of engineered wood products in exterior facades, interior spaces, functional landscapes, and pathways is on the rise, presenting competition for traditional clay bricks. In summary, concrete blocks and engineered wood products cater to the US construction industry's demand for durable, sustainable, and versatile building materials. AAC concrete blocks and engineered wood products, such as LVL, particleboard, and OSB, provide excellent insulation, lightweight properties, and ease of construction, making them popular alternatives to clay bricks in various applications.

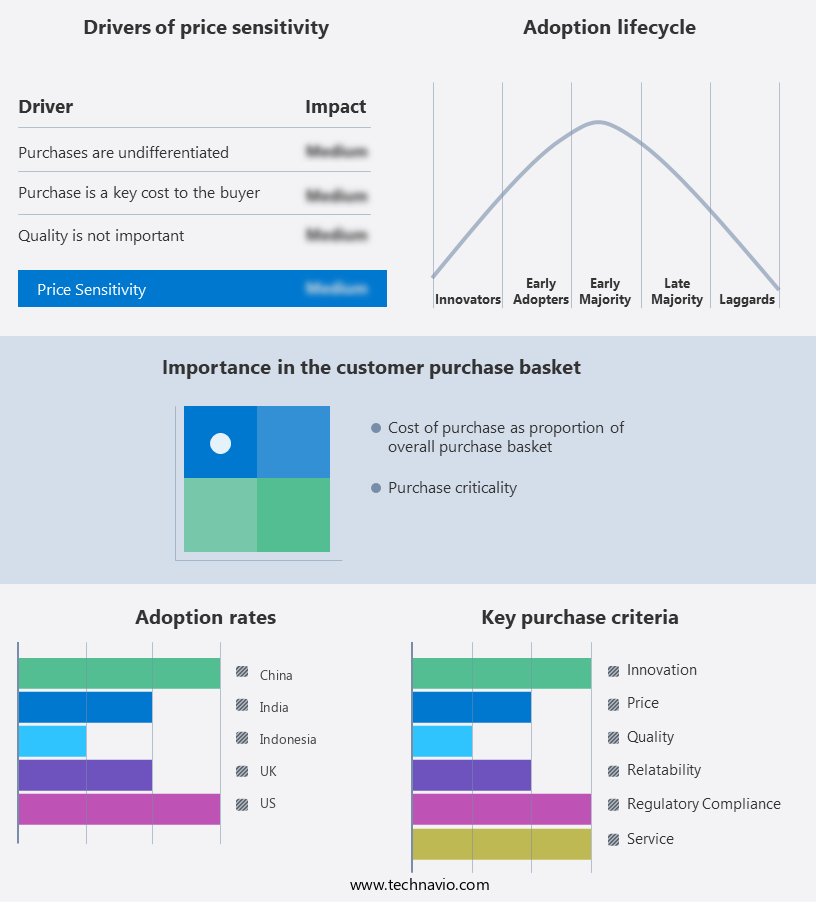
Exclusive Customer Landscape

The market forecasting report includes the adoption lifecycle of the market, covering from the innovator's stage to the laggard's stage. It focuses on adoption rates in different regions based on penetration. Furthermore, the market report also includes key purchase criteria and drivers of price sensitivity to help companies evaluate and develop their market growth analysis strategies.

Clay Brick Market Share by Geography

 Customer Landscape

Key Companies & Market Insights

Companies are implementing various strategies, such as strategic alliances, market forecast, partnerships, mergers and acquisitions, geographical expansion, and product/service launches, to enhance their presence in the market. The market research and growth report includes detailed analyses of the competitive landscape of the market and information about key companies, including:

  • Apollo Brick SA
  • Berkshire Hathaway Inc.
  • Bharat Bricks Co.
  • Bowerston Shale Co.
  • Brampton Brick Ltd.
  • Brickworks Ltd.
  • Ceramica Fanelli
  • Forterra Building Products Ltd.
  • Henry Brick
  • Ibstock Plc
  • Jindal Mechno Bricks Pvt. Ltd.
  • Nitterhouse Masonry products LLC
  • Pacific Clay Products Inc.
  • Palmetto Brick Co.
  • Ragland Clay Products LLC
  • Rajasree Corp.
  • Saudi Ceramic Co.
  • Summit Brick Co.
  • Taylor Clay Products Inc.
  • The Belden Brick Co.
  • US BRICK
  • Vandersanden Steenfabrieken N.V.
  • Wienerberger AG

Qualitative and quantitative analysis of companies has been conducted to help clients understand the wider business environment as well as the strengths and weaknesses of key market players. Data is qualitatively analyzed to categorize companies as pure play, category-focused, industry-focused, and diversified; it is quantitatively analyzed to categorize companies as dominant, leading, strong, tentative, and weak.

Research Analyst Overview

The market is a significant segment of the building materials industry, renowned for its versatility and eco-friendliness. Architectural styles ranging from contemporary to traditional continue to incorporate clay bricks in exterior facades, interior spaces, and functional landscapes. Sustainable construction and energy efficiency are key drivers, with clay bricks offering excellent thermal properties and emissions standards compliance. Size-based segmentation includes modular bricks, standard bricks, and jumbo bricks, catering to various construction projects, from residential properties to commercial buildings, infrastructure projects, pathways, and landscaping. Adaptability to diverse applications, load-bearing walls, and BTK techniques make clay bricks a competitive edge in the construction sector.

Furthermore, raw material scarcity and rising production costs have led to the adoption of advanced technologies, for optimization and emission reduction. Sustainable sourcing and recycling practices are essential for reducing waste and minimizing environmental impact. Competitive intensity in the market is high, with investment opportunities in the residential segment, particularly in revenue growth and affordable housing projects. Environmental concerns and sustainable practices are crucial factors, with cost savings, energy consumption, and concrete bricks growth driving the modular segment's expansion. Construction projects, urbanization trends, and industrial sector development continue to fuel market growth. Alternative materials and sustainable solutions are essential for a competitive advantage, with marketing strategies focusing on emission reduction, recycling efforts, and competitive edge.

Market Scope

Report Coverage

Details

Page number

167

Base year

2023

Historic period

2018-2022

Forecast period

2024-2028

Growth momentum & CAGR

Accelerate at a CAGR of 3.64%

Market Growth 2024-2028

USD 12.63 billion

Market structure

Fragmented

YoY growth 2023-2024(%)

2.9

Key countries

US, China, India, Indonesia, and UK

Competitive landscape

Leading Companies, Market Positioning of Companies, Competitive Strategies, and Industry Risks

Request Free Sample

What are the Key Data Covered in this Market Research and Growth Report?

  • CAGR of the market during the forecast period
  • Detailed information on factors that will drive the market growth and forecasting between 2024 and 2028
  • Precise estimation of the size of the market  and its contribution of the market in focus to the parent market
  • Accurate predictions about upcoming market growth and trends and changes in consumer behaviour
  • Growth of the market across APAC, Europe, North America, Middle East and Africa, and South America
  • Thorough analysis of the market's competitive landscape and detailed information about companies
  • Comprehensive analysis of factors that will challenge the growth of market companies

We can help! Our analysts can customize this market research report to meet your requirements. Get in touch

1 Executive Summary

  • 1.1 Market overview
    • Exhibit 01: Executive Summary – Chart on Market Overview
    • Exhibit 02: Executive Summary – Data Table on Market Overview
    • Exhibit 03: Executive Summary – Chart on Global Market Characteristics
    • Exhibit 04: Executive Summary – Chart on Market by Geography
    • Exhibit 05: Executive Summary – Chart on Market Segmentation by Application
    • Exhibit 06: Executive Summary – Chart on Market Segmentation by Type
    • Exhibit 07: Executive Summary – Chart on Incremental Growth
    • Exhibit 08: Executive Summary – Data Table on Incremental Growth
    • Exhibit 09: Executive Summary – Chart on Vendor Market Positioning

2 Market Landscape

  • 2.1 Market ecosystem
    • Exhibit 10: Parent market
    • Exhibit 11: Market Characteristics

3 Market Sizing

  • 3.1 Market definition
    • Exhibit 12: Offerings of vendors included in the market definition
  • 3.2 Market segment analysis
    • Exhibit 13: Market segments
  • 3.3 Market size 2023
    • 3.4 Market outlook: Forecast for 2023-2028
      • Exhibit 14: Chart on Global - Market size and forecast 2023-2028 ($ billion)
      • Exhibit 15: Data Table on Global - Market size and forecast 2023-2028 ($ billion)
      • Exhibit 16: Chart on Global Market: Year-over-year growth 2023-2028 (%)
      • Exhibit 17: Data Table on Global Market: Year-over-year growth 2023-2028 (%)

    4 Historic Market Size

    • 4.1 Global clay brick market 2018 - 2022
      • Exhibit 18: Historic Market Size – Data Table on global clay brick market 2018 - 2022 ($ billion)
    • 4.2 Application Segment Analysis 2018 - 2022
      • Exhibit 19: Historic Market Size – Application Segment 2018 - 2022 ($ billion)
    • 4.3 Type Segment Analysis 2018 - 2022
      • Exhibit 20: Historic Market Size – Type Segment 2018 - 2022 ($ billion)
    • 4.4 Geography Segment Analysis 2018 - 2022
      • Exhibit 21: Historic Market Size – Geography Segment 2018 - 2022 ($ billion)
    • 4.5 Country Segment Analysis 2018 - 2022
      • Exhibit 22: Historic Market Size – Country Segment 2018 - 2022 ($ billion)

    5 Five Forces Analysis

    • 5.1 Five forces summary
      • Exhibit 23: Five forces analysis - Comparison between 2023 and 2028
    • 5.2 Bargaining power of buyers
      • Exhibit 24: Chart on Bargaining power of buyers – Impact of key factors 2023 and 2028
    • 5.3 Bargaining power of suppliers
      • Exhibit 25: Bargaining power of suppliers – Impact of key factors in 2023 and 2028
    • 5.4 Threat of new entrants
      • Exhibit 26: Threat of new entrants – Impact of key factors in 2023 and 2028
    • 5.5 Threat of substitutes
      • Exhibit 27: Threat of substitutes – Impact of key factors in 2023 and 2028
    • 5.6 Threat of rivalry
      • Exhibit 28: Threat of rivalry – Impact of key factors in 2023 and 2028
    • 5.7 Market condition
      • Exhibit 29: Chart on Market condition - Five forces 2023 and 2028

    6 Market Segmentation by Application

    • 6.1 Market segments
      • Exhibit 30: Chart on Application - Market share 2023-2028 (%)
      • Exhibit 31: Data Table on Application - Market share 2023-2028 (%)
    • 6.2 Comparison by Application
      • Exhibit 32: Chart on Comparison by Application
      • Exhibit 33: Data Table on Comparison by Application
    • 6.3 Residential - Market size and forecast 2023-2028
      • Exhibit 34: Chart on Residential - Market size and forecast 2023-2028 ($ billion)
      • Exhibit 35: Data Table on Residential - Market size and forecast 2023-2028 ($ billion)
      • Exhibit 36: Chart on Residential - Year-over-year growth 2023-2028 (%)
      • Exhibit 37: Data Table on Residential - Year-over-year growth 2023-2028 (%)
    • 6.4 Commercial - Market size and forecast 2023-2028
      • Exhibit 38: Chart on Commercial - Market size and forecast 2023-2028 ($ billion)
      • Exhibit 39: Data Table on Commercial - Market size and forecast 2023-2028 ($ billion)
      • Exhibit 40: Chart on Commercial - Year-over-year growth 2023-2028 (%)
      • Exhibit 41: Data Table on Commercial - Year-over-year growth 2023-2028 (%)
    • 6.5 Infrastructure - Market size and forecast 2023-2028
      • Exhibit 42: Chart on Infrastructure - Market size and forecast 2023-2028 ($ billion)
      • Exhibit 43: Data Table on Infrastructure - Market size and forecast 2023-2028 ($ billion)
      • Exhibit 44: Chart on Infrastructure - Year-over-year growth 2023-2028 (%)
      • Exhibit 45: Data Table on Infrastructure - Year-over-year growth 2023-2028 (%)
    • 6.6 Path and others - Market size and forecast 2023-2028
      • Exhibit 46: Chart on Path and others - Market size and forecast 2023-2028 ($ billion)
      • Exhibit 47: Data Table on Path and others - Market size and forecast 2023-2028 ($ billion)
      • Exhibit 48: Chart on Path and others - Year-over-year growth 2023-2028 (%)
      • Exhibit 49: Data Table on Path and others - Year-over-year growth 2023-2028 (%)
    • 6.7 Market opportunity by Application
      • Exhibit 50: Market opportunity by Application ($ billion)
      • Exhibit 51: Data Table on Market opportunity by Application ($ billion)

    7 Market Segmentation by Type

    • 7.1 Market segments
      • Exhibit 52: Chart on Type - Market share 2023-2028 (%)
      • Exhibit 53: Data Table on Type - Market share 2023-2028 (%)
    • 7.2 Comparison by Type
      • Exhibit 54: Chart on Comparison by Type
      • Exhibit 55: Data Table on Comparison by Type
    • 7.3 Solid - Market size and forecast 2023-2028
      • Exhibit 56: Chart on Solid - Market size and forecast 2023-2028 ($ billion)
      • Exhibit 57: Data Table on Solid - Market size and forecast 2023-2028 ($ billion)
      • Exhibit 58: Chart on Solid - Year-over-year growth 2023-2028 (%)
      • Exhibit 59: Data Table on Solid - Year-over-year growth 2023-2028 (%)
    • 7.4 Paver and facing - Market size and forecast 2023-2028
      • Exhibit 60: Chart on Paver and facing - Market size and forecast 2023-2028 ($ billion)
      • Exhibit 61: Data Table on Paver and facing - Market size and forecast 2023-2028 ($ billion)
      • Exhibit 62: Chart on Paver and facing - Year-over-year growth 2023-2028 (%)
      • Exhibit 63: Data Table on Paver and facing - Year-over-year growth 2023-2028 (%)
    • 7.5 Hollow - Market size and forecast 2023-2028
      • Exhibit 64: Chart on Hollow - Market size and forecast 2023-2028 ($ billion)
      • Exhibit 65: Data Table on Hollow - Market size and forecast 2023-2028 ($ billion)
      • Exhibit 66: Chart on Hollow - Year-over-year growth 2023-2028 (%)
      • Exhibit 67: Data Table on Hollow - Year-over-year growth 2023-2028 (%)
    • 7.6 Market opportunity by Type
      • Exhibit 68: Market opportunity by Type ($ billion)
      • Exhibit 69: Data Table on Market opportunity by Type ($ billion)

    8 Customer Landscape

    • 8.1 Customer landscape overview
      • Exhibit 70: Analysis of price sensitivity, lifecycle, customer purchase basket, adoption rates, and purchase criteria

    9 Geographic Landscape

    • 9.1 Geographic segmentation
      • Exhibit 71: Chart on Market share by geography 2023-2028 (%)
      • Exhibit 72: Data Table on Market share by geography 2023-2028 (%)
    • 9.2 Geographic comparison
      • Exhibit 73: Chart on Geographic comparison
      • Exhibit 74: Data Table on Geographic comparison
    • 9.3 APAC - Market size and forecast 2023-2028
      • Exhibit 75: Chart on APAC - Market size and forecast 2023-2028 ($ billion)
      • Exhibit 76: Data Table on APAC - Market size and forecast 2023-2028 ($ billion)
      • Exhibit 77: Chart on APAC - Year-over-year growth 2023-2028 (%)
      • Exhibit 78: Data Table on APAC - Year-over-year growth 2023-2028 (%)
    • 9.4 Europe - Market size and forecast 2023-2028
      • Exhibit 79: Chart on Europe - Market size and forecast 2023-2028 ($ billion)
      • Exhibit 80: Data Table on Europe - Market size and forecast 2023-2028 ($ billion)
      • Exhibit 81: Chart on Europe - Year-over-year growth 2023-2028 (%)
      • Exhibit 82: Data Table on Europe - Year-over-year growth 2023-2028 (%)
    • 9.5 North America - Market size and forecast 2023-2028
      • Exhibit 83: Chart on North America - Market size and forecast 2023-2028 ($ billion)
      • Exhibit 84: Data Table on North America - Market size and forecast 2023-2028 ($ billion)
      • Exhibit 85: Chart on North America - Year-over-year growth 2023-2028 (%)
      • Exhibit 86: Data Table on North America - Year-over-year growth 2023-2028 (%)
    • 9.6 Middle East and Africa - Market size and forecast 2023-2028
      • Exhibit 87: Chart on Middle East and Africa - Market size and forecast 2023-2028 ($ billion)
      • Exhibit 88: Data Table on Middle East and Africa - Market size and forecast 2023-2028 ($ billion)
      • Exhibit 89: Chart on Middle East and Africa - Year-over-year growth 2023-2028 (%)
      • Exhibit 90: Data Table on Middle East and Africa - Year-over-year growth 2023-2028 (%)
    • 9.7 South America - Market size and forecast 2023-2028
      • Exhibit 91: Chart on South America - Market size and forecast 2023-2028 ($ billion)
      • Exhibit 92: Data Table on South America - Market size and forecast 2023-2028 ($ billion)
      • Exhibit 93: Chart on South America - Year-over-year growth 2023-2028 (%)
      • Exhibit 94: Data Table on South America - Year-over-year growth 2023-2028 (%)
    • 9.8 China - Market size and forecast 2023-2028
      • Exhibit 95: Chart on China - Market size and forecast 2023-2028 ($ billion)
      • Exhibit 96: Data Table on China - Market size and forecast 2023-2028 ($ billion)
      • Exhibit 97: Chart on China - Year-over-year growth 2023-2028 (%)
      • Exhibit 98: Data Table on China - Year-over-year growth 2023-2028 (%)
    • 9.9 US - Market size and forecast 2023-2028
      • Exhibit 99: Chart on US - Market size and forecast 2023-2028 ($ billion)
      • Exhibit 100: Data Table on US - Market size and forecast 2023-2028 ($ billion)
      • Exhibit 101: Chart on US - Year-over-year growth 2023-2028 (%)
      • Exhibit 102: Data Table on US - Year-over-year growth 2023-2028 (%)
    • 9.10 India - Market size and forecast 2023-2028
      • Exhibit 103: Chart on India - Market size and forecast 2023-2028 ($ billion)
      • Exhibit 104: Data Table on India - Market size and forecast 2023-2028 ($ billion)
      • Exhibit 105: Chart on India - Year-over-year growth 2023-2028 (%)
      • Exhibit 106: Data Table on India - Year-over-year growth 2023-2028 (%)
    • 9.11 Indonesia - Market size and forecast 2023-2028
      • Exhibit 107: Chart on Indonesia - Market size and forecast 2023-2028 ($ billion)
      • Exhibit 108: Data Table on Indonesia - Market size and forecast 2023-2028 ($ billion)
      • Exhibit 109: Chart on Indonesia - Year-over-year growth 2023-2028 (%)
      • Exhibit 110: Data Table on Indonesia - Year-over-year growth 2023-2028 (%)
    • 9.12 UK - Market size and forecast 2023-2028
      • Exhibit 111: Chart on UK - Market size and forecast 2023-2028 ($ billion)
      • Exhibit 112: Data Table on UK - Market size and forecast 2023-2028 ($ billion)
      • Exhibit 113: Chart on UK - Year-over-year growth 2023-2028 (%)
      • Exhibit 114: Data Table on UK - Year-over-year growth 2023-2028 (%)
    • 9.13 Market opportunity by geography
      • Exhibit 115: Market opportunity by geography ($ billion)
      • Exhibit 116: Data Tables on Market opportunity by geography ($ billion)

    10 Drivers, Challenges, and Trends

    • 10.1 Market drivers
      • 10.2 Market challenges
        • 10.3 Impact of drivers and challenges
          • Exhibit 117: Impact of drivers and challenges in 2023 and 2028
        • 10.4 Market trends

          11 Vendor Landscape

          • 11.1 Overview
            • 11.2 Vendor landscape
              • Exhibit 118: Overview on Criticality of inputs and Factors of differentiation
            • 11.3 Landscape disruption
              • Exhibit 119: Overview on factors of disruption
            • 11.4 Industry risks
              • Exhibit 120: Impact of key risks on business

            12 Vendor Analysis

            • 12.1 Vendors covered
              • Exhibit 121: Vendors covered
            • 12.2 Market positioning of vendors
              • Exhibit 122: Matrix on vendor position and classification
            • 12.3 Apollo Brick SA
              • Exhibit 123: Apollo Brick SA - Overview
              • Exhibit 124: Apollo Brick SA - Product / Service
              • Exhibit 125: Apollo Brick SA - Key offerings
            • 12.4 Berkshire Hathaway Inc.
              • Exhibit 126: Berkshire Hathaway Inc. - Overview
              • Exhibit 127: Berkshire Hathaway Inc. - Business segments
              • Exhibit 128: Berkshire Hathaway Inc. - Key news
              • Exhibit 129: Berkshire Hathaway Inc. - Key offerings
              • Exhibit 130: Berkshire Hathaway Inc. - Segment focus
            • 12.5 Bowerston Shale Co.
              • Exhibit 131: Bowerston Shale Co. - Overview
              • Exhibit 132: Bowerston Shale Co. - Product / Service
              • Exhibit 133: Bowerston Shale Co. - Key offerings
            • 12.6 Brampton Brick Ltd.
              • Exhibit 134: Brampton Brick Ltd. - Overview
              • Exhibit 135: Brampton Brick Ltd. - Product / Service
              • Exhibit 136: Brampton Brick Ltd. - Key offerings
            • 12.7 Brickworks Ltd.
              • Exhibit 137: Brickworks Ltd. - Overview
              • Exhibit 138: Brickworks Ltd. - Business segments
              • Exhibit 139: Brickworks Ltd. - Key offerings
              • Exhibit 140: Brickworks Ltd. - Segment focus
            • 12.8 Forterra Building Products Ltd.
              • Exhibit 141: Forterra Building Products Ltd. - Overview
              • Exhibit 142: Forterra Building Products Ltd. - Product / Service
              • Exhibit 143: Forterra Building Products Ltd. - Key offerings
            • 12.9 Ibstock Plc
              • Exhibit 144: Ibstock Plc - Overview
              • Exhibit 145: Ibstock Plc - Business segments
              • Exhibit 146: Ibstock Plc - Key offerings
              • Exhibit 147: Ibstock Plc - Segment focus
            • 12.10 Jindal Mechno Bricks Pvt. Ltd.
              • Exhibit 148: Jindal Mechno Bricks Pvt. Ltd. - Overview
              • Exhibit 149: Jindal Mechno Bricks Pvt. Ltd. - Product / Service
              • Exhibit 150: Jindal Mechno Bricks Pvt. Ltd. - Key offerings
            • 12.11 Palmetto Brick Co.
              • Exhibit 151: Palmetto Brick Co. - Overview
              • Exhibit 152: Palmetto Brick Co. - Product / Service
              • Exhibit 153: Palmetto Brick Co. - Key offerings
            • 12.12 Summit Brick Co.
              • Exhibit 154: Summit Brick Co. - Overview
              • Exhibit 155: Summit Brick Co. - Product / Service
              • Exhibit 156: Summit Brick Co. - Key offerings
            • 12.13 Taylor Clay Products Inc.
              • Exhibit 157: Taylor Clay Products Inc. - Overview
              • Exhibit 158: Taylor Clay Products Inc. - Product / Service
              • Exhibit 159: Taylor Clay Products Inc. - Key offerings
            • 12.14 The Belden Brick Co.
              • Exhibit 160: The Belden Brick Co. - Overview
              • Exhibit 161: The Belden Brick Co. - Product / Service
              • Exhibit 162: The Belden Brick Co. - Key offerings
            • 12.15 US BRICK
              • Exhibit 163: US BRICK - Overview
              • Exhibit 164: US BRICK - Product / Service
              • Exhibit 165: US BRICK - Key offerings
            • 12.16 Vandersanden Steenfabrieken N.V.
              • Exhibit 166: Vandersanden Steenfabrieken N.V. - Overview
              • Exhibit 167: Vandersanden Steenfabrieken N.V. - Product / Service
              • Exhibit 168: Vandersanden Steenfabrieken N.V. - Key offerings
            • 12.17 Wienerberger AG
              • Exhibit 169: Wienerberger AG - Overview
              • Exhibit 170: Wienerberger AG - Business segments
              • Exhibit 171: Wienerberger AG - Key offerings
              • Exhibit 172: Wienerberger AG - Segment focus

            13 Appendix

            • 13.1 Scope of the report
              • 13.2 Inclusions and exclusions checklist
                • Exhibit 173: Inclusions checklist
                • Exhibit 174: Exclusions checklist
              • 13.3 Currency conversion rates for US$
                • Exhibit 175: Currency conversion rates for US$
              • 13.4 Research methodology
                • Exhibit 176: Research methodology
                • Exhibit 177: Validation techniques employed for market sizing
                • Exhibit 178: Information sources
              • 13.5 List of abbreviations
                • Exhibit 179: List of abbreviations

              Research Methodology

              Technavio presents a detailed picture of the market by way of study, synthesis, and summation of data from multiple sources. The analysts have presented the various facets of the market with a particular focus on identifying the key industry influencers. The data thus presented is comprehensive, reliable, and the result of extensive research, both primary and secondary.

              INFORMATION SOURCES

              Primary sources

              • Manufacturers and suppliers
              • Channel partners
              • Industry experts
              • Strategic decision makers

              Secondary sources

              • Industry journals and periodicals
              • Government data
              • Financial reports of key industry players
              • Historical data
              • Press releases

              DATA ANALYSIS

              Data Synthesis

              • Collation of data
              • Estimation of key figures
              • Analysis of derived insights

              Data Validation

              • Triangulation with data models
              • Reference against proprietary databases
              • Corroboration with industry experts

              REPORT WRITING

              Qualitative

              • Market drivers
              • Market challenges
              • Market trends
              • Five forces analysis

              Quantitative

              • Market size and forecast
              • Market segmentation
              • Geographical insights
              • Competitive landscape

              Interested in this report?

              Get your sample now to see our research methodology and insights!

              Download Now

              Frequently Asked Questions

              Clay Brick market growth will increase by $ 12.63 bn during 2024-2028 .

              The Clay Brick market is expected to grow at a CAGR of 3.64% during 2024-2028 .

              Clay Brick market is segmented by Application( Residential, Commercial, Infrastructure, Path and others) Type( Solid, Paver and facing, Hollow)

              Apollo Brick SA, Berkshire Hathaway Inc., Bharat Bricks Co., Bowerston Shale Co., Brampton Brick Ltd., Brickworks Ltd., Ceramica Fanelli, Forterra Building Products Ltd., Henry Brick, Ibstock Plc, Jindal Mechno Bricks Pvt. Ltd., Nitterhouse Masonry products LLC, Pacific Clay Products Inc., Palmetto Brick Co., Ragland Clay Products LLC, Rajasree Corp., Saudi Ceramic Co., Summit Brick Co., Taylor Clay Products Inc., The Belden Brick Co., US BRICK, Vandersanden Steenfabrieken N.V., Wienerberger AG are a few of the key vendors in the Clay Brick market.

              APAC will register the highest growth rate of 48% among the other regions. Therefore, the Clay Brick market in APAC is expected to garner significant business opportunities for the vendors during the forecast period.

              US, China, India, Indonesia, UK

              • Affordability and cost-effectiveness of clay bricksClay bricks are often competitively priced compared to alternative building materials. The relatively low production costs is the driving factor this market.
              • coupled with the abundance of raw materials (clay) is the driving factor this market.
              • contribute to their affordability. This competitive pricing makes clay bricks an attractive choice for builders and construction projects. Builders and construction companies are keen on using materials that offer cost savings without compromising quality. Clay bricks provide an economical solution is the driving factor this market.
              • allowing builders to control construction costs while delivering durable and reliable structures. The availability of clay as a primary raw material for brick production contributes to cost-effectiveness. Regions with easy access to clay deposits can produce clay bricks more affordably compared to areas where raw materials need to be transported over long distances. Moreover is the driving factor this market.
              • the production process for clay bricks is well-established and is the driving factor this market.
              • in many cases is the driving factor this market.
              • involves straightforward methods such as molding and firing. This simplicity contributes to lower production costs is the driving factor this market.
              • making clay bricks an economically viable choice for construction projects. In regions with a focus on affordable housing initiatives is the driving factor this market.
              • the cost-effectiveness of building materials becomes paramount. Clay bricks is the driving factor this market.
              • being affordable and readily available is the driving factor this market.
              • are often preferred in such initiatives is the driving factor this market.
              • supporting the demand for these bricks. Thus is the driving factor this market.
              • the affordability and cost-effectiveness of clay bricks will propel the growth of the global clay brick market during the forecast period. is the driving factor this market.

              The Clay Brick market vendors should focus on grabbing business opportunities from the Residential segment as it accounted for the largest market share in the base year.