Face Wash Market Analysis APAC, North America, Europe, South America, Middle East and Africa - US, China, Japan, UK, Germany - Size and Forecast 2024-2028

Face Wash Market Analysis APAC, North America, Europe, South America, Middle East and Africa - US, China, Japan, UK, Germany - Size and Forecast 2024-2028

Published: Nov 2023 155 Pages SKU: IRTNTR76732

Market Overview at a Glance

$8.39 B
Market Opportunity
5.46%
CAGR
5.16
YoY growth 2023-2024(%)

Face Wash Market Size 2024-2028 

The face wash market size is forecast to increase by USD 8.39 billion at a CAGR of 5.46% between 2023 and 2028.

  • The market in North America is experiencing significant growth due to increasing per capita income and changing consumer preferences. One trend influencing market growth is the rising demand for organic face washes as consumers become more health-conscious. However, the market also faces challenges such as the easy availability of counterfeit products, which can negatively impact brand reputation and consumer trust. As income levels rise and consumers prioritize self-care, the market for face washes is expected to continue expanding. Organic options catering to this demand will likely see particular success, as long as manufacturers can effectively address the issue of counterfeit products.

What will be the Size of the Market During the Forecast Period?

Face Wash Market Size

 Request Free Sample

  • The market is a significant segment of the personal care industry, driven by the growing awareness of the importance of maintaining a hygienic lifestyle and the desire for healthy, radiant skin. With the increasing prevalence of excess oil, dirt, pollution, and unwanted skin cells, the demand for face wash products has surged in recent years. The market for face wash caters to various skin types and concerns, including those affected by acne, signs of aging, and sun damage. Organic face wash options have gained popularity due to their natural ingredients and the growing trend towards organic and sustainable products.
  • The organic harvest of botanical ingredients, such as chamomile, aloe vera, and green tea, is a key factor driving the growth of the organic face wash segment. The rise of online retailing has made it easier for consumers to access a wide range of face wash products from the comfort of their homes. This trend is particularly prominent in rapidly urbanizing areas, where consumers lead busy lifestyles and prefer the convenience of shopping online. Despite the numerous benefits of face wash, there are concerns regarding the use of harsh surfactants and potential irritants, such as rashes and burns

How is this market segmented and which is the largest segment?

The market research report provides comprehensive data (region-wise segment analysis), with forecasts and estimates in "USD million" for the period 2024-2028, as well as historical data from 2018-2022 for the following segments.

  • Distribution Channel
    • Offline
    • Online
  • End-user
    • Women
    • Men
    • Kids
  • Geography
    • APAC
      • China
      • Japan
    • North America
      • US
    • Europe
      • Germany
      • UK
    • South America
    • Middle East and Africa

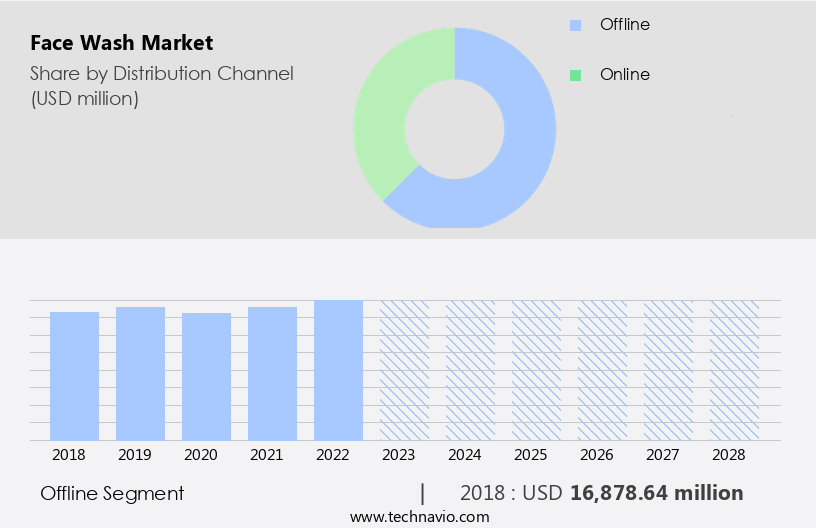
By Distribution Channel Insights

  • The offline segment is estimated to witness significant growth during the forecast period.

Face wash is a crucial component of personal care routines, available in various forms such as Gel, Cream, Powder, Foam, catering to different skin types including Dry, Oily, Normal, and Sensitive. The market for face wash is substantial, with significant revenue generated through both online retailing platforms and traditional retail stores. E-commerce sales are on the rise due to the convenience and accessibility it offers. However, retail stores continue to dominate the market, accounting for a substantial share. Specialty stores, in particular, are a significant revenue generator in the market. The increasing popularity of these stores, which specialize in beauty and personal care products, is driving market growth.

Moreover, the rise in the number of hypermarkets, supermarkets, convenience stores, and warehouse clubs of major retailers is contributing to the sales growth of these retail formats and significantly impacting the market. While shopping for face wash, consumers consider factors such as skin type, price, brand reputation, and product effectiveness. It's essential to protect your skin from environmental factors like UV rays and sunlight. Using the right face wash can help maintain healthy skin.

However, it's important to avoid harsh soaps that can cause rashes or burns. Always read the label before use and consult a dermatologist if you have sensitive skin. In conclusion, the market is a thriving industry, with various forms and retail formats catering to diverse consumer preferences. Specialty stores, hypermarkets, supermarkets, convenience stores, and warehouse clubs are the major revenue contributors to this market. Consumers prioritize factors such as skin type, price, brand reputation, and product effectiveness when purchasing face wash.

Face Wash Market Size

Get a glance at the market report of share of various segments Request Free Sample

The offline segment was valued at USD 16.87 billion in 2018 and showed a gradual increase during the forecast period.

Regional Analysis

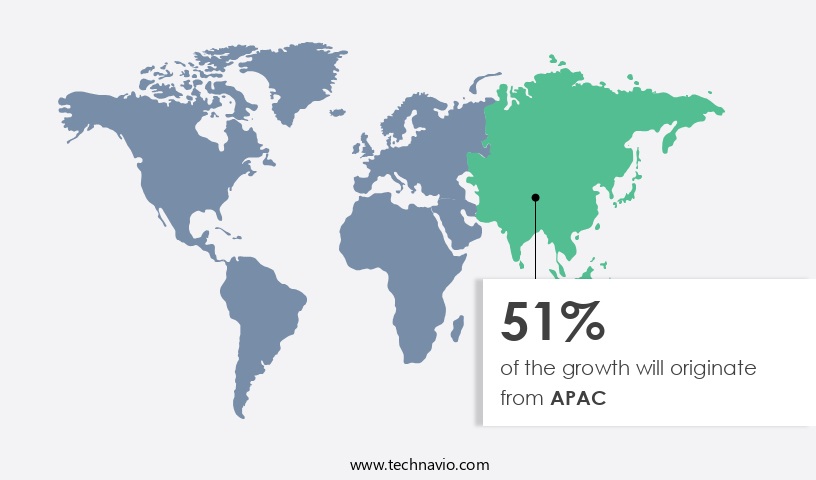
  • APAC is estimated to contribute 51% to the growth of the global market during the forecast period.

Technavio's analysts have elaborately explained the regional trends and drivers that shape the market during the forecast period.

Face Wash Market Share by Geography

For more insights on the market share of various regions Request Free Sample

The facial cleanser market in Asia Pacific (APAC) holds a significant share in the global market due to the increasing population and rising disposable income in countries like China and India. Urbanization is leading to a surge in demand for skincare products, including face wash, among both male and female consumers in the region. The market's growth is further fueled by various factors, such as celebrity endorsements and an extensive range of product offerings. In response to consumer preferences for natural and gentle ingredients, many skincare brands are incorporating natural ingredients like tea tree oil, aloe vera, and essential oils into their face wash formulations.

Hyaluronic acid and Niacinamide are also popular ingredients that provide additional benefits, such as hydration and skin brightening. To reduce plastic waste, some companies are introducing refillable cleansers, making their products more eco-friendly. Gel cleansers are also gaining popularity due to their ability to effectively cleanse the skin without stripping it of essential oils. However, synthetic ingredients and harsh chemicals in some facial cleansers can cause skin irritation, redness, and allergic reactions. To address these concerns, many consumers are opting for natural and gentle alternatives. Leading brands like Neutrogena continue to innovate and design skincare products that cater to various skin types and concerns.

Market Dynamics

Our researchers analyzed the data with 2023 as the base year, along with the key drivers, trends, and challenges. A holistic analysis of drivers will help companies refine their marketing strategies to gain a competitive advantage.

What are the key market drivers leading to the rise in adoption of Face Wash Market?

Increasing per capita income and changing purchase behavior is the key driver of the market.

  • The market is witnessing significant growth due to the increasing awareness of a hygienic lifestyle and the desire for clear, healthy-looking skin. Factors such as excess oil, dirt, pollution, and unwanted skin cells contribute to the need for regular face washing. Organic face washes, free of harsh chemicals like sulphate and sodium lauryl sulfate, are gaining popularity due to their benefits for various skin types, including acne-prone, sensitive, and normal skin. Vitamin E and other advanced ingredients, such as hyaluronic acid and niacinamide, are increasingly being used in facial cleansers to address signs of aging, inflammation, and irritation. The rise of e-commerce stores and retail outlets has made it easier for consumers to access these skincare products, including face wash, in large quantities or small sachets.
  • In addition, the increasing prevalence of facial skin disorders, such as acne and allergic contact dermatitis, has led to a growing demand for anti-acne and anti-allergic products. The aging population is also driving demand for products that address wrinkles and other signs of aging. Facial appearance is a significant concern for individuals in both male and female demographics, leading to the growth of the male grooming segment. Skincare products, including face wash, are essential for maintaining healthy, glowing skin in various climates and environments, such as humid conditions or indoor heating. Natural ingredients, such as tea tree oil, aloe vera, and essential oils, are increasingly being used in face washes to provide added benefits and reduce skin irritation and rashes caused by synthetic ingredients. Such factors will increase the market growth druing the forecast period.

What are the market trends shaping the Face Wash Market?

Growing preference for organic face washes is the upcoming trend in the market.

  • The market in the US is witnessing significant growth due to the rising trend of adopting a hygienic lifestyle and the increasing awareness about the harmful effects of excess oil, dirt, pollution, and unwanted skin cells on facial skin. Consumers are increasingly seeking organic face washes as an alternative to traditional soaps and cleansers, as these products offer advanced ingredients such as vitamin E, hyaluronic acid, and niacinamide that help nourish and protect the skin from signs of aging, acne, and other facial skin disorders. Organic face washes are made using natural ingredients like tea tree oil, aloe vera, and essential oils, which are free from harsh chemicals such as sulfate, sodium lauryl sulfate, and cocamidopropyl betaine.
  • These natural ingredients help soothe inflammation, irritation, and redness caused by allergic contact dermatitis and other skin irritations. Manufacturers are focusing on designing skincare products that cater to different skin types, including dry, oily, normal, sensitive, and male grooming segments. They are also offering refillable cleansers and various forms of face washes, such as gel, cream, powder, and foam, to cater to the preferences and needs of consumers in different climates and regions. The increasing prevalence of facial skin disorders such as acne, pimples, and enlarged pores, along with the aging population and their hydration needs, are driving the demand for oil-control products and anti-acne face washes. Such factors will increase the market trends during the forecast period.

What challenges does Face Wash Market face during the growth?

The easy availability of counterfeit products is a key challenge affecting the market growth.

  • The market is a significant segment of the personal care industry, catering to consumers seeking to maintain a hygienic lifestyle and address skin concerns such as excess oil, dirt, pollution, and unwanted skin cells. The market offers various types of face washes, including gel, cream, powder, and foam, catering to different skin types, including dry, oily, normal, sensitive, and anti-acne. The use of advanced ingredients like hyaluronic acid, niacinamide, and vitamin E, as well as natural ingredients like tea tree oil, aloe vera, and essential oils, adds value to the market. However, the market faces challenges from counterfeit products, which are increasingly available through e-commerce stores and retail outlets.
  • These fake products, sometimes contaminated with harsh chemicals, can cause skin irritation, redness, and allergic reactions. Consumers, particularly in APAC and Middle Eastern countries, are often misled by packaging and product names that mimic established brands. The production of counterfeit face washes is driven by low production costs, which can undermine the sales and reputation of legitimate companies. Consumers are advised to be vigilant and ensure they purchase products from reputable sources to maintain healthy and nourished skin.

Exclusive Customer Landscape

The market forecasting report includes the adoption lifecycle of the market, covering from the innovator's stage to the laggard's stage. It focuses on adoption rates in different regions based on penetration. Furthermore, the market report also includes key purchase criteria and drivers of price sensitivity to help companies evaluate and develop their market growth analysis strategies.

Face Wash Market Share by Geography

 Customer Landscape

Key Companies & Market Insights

Companies are implementing various strategies, such as strategic alliances, market forecast, partnerships, mergers and acquisitions, geographical expansion, and product/service launches, to enhance their presence in the market.

The market research and growth report includes detailed analyses of the competitive landscape of the market and information about key companies, including:

  • Alchemee LLC
  • Amway Corp.
  • Beiersdorf AG
  • Bloomtown Ltd.
  • Christian Dior SE
  • Emami Ltd.
  • Helios Lifestyle Pvt Ltd.
  • Himalaya Global Holdings Ltd.
  • Honasa Consumer Pvt. Ltd.
  • Johnson and Johnson
  • Kao Corp.
  • Khadi Natural
  • LOreal SA
  • Mountain Valley Springs India Pvt. Ltd.
  • NAOS
  • Natura and Co Holding SA
  • Oriflame Cosmetics S.A.
  • Shiseido Co. Ltd.
  • The Body Shop International Ltd.
  • The Estee Lauder Companies
  • The Honest Co. Inc.
  • The Procter and Gamble Co.
  • Unilever PLC

Qualitative and quantitative analysis of companies has been conducted to help clients understand the wider business environment as well as the strengths and weaknesses of key market players. Data is qualitatively analyzed to categorize companies as pure play, category-focused, industry-focused, and diversified; it is quantitatively analyzed to categorize companies as dominant, leading, strong, tentative, and weak.

Research Analyst Overview

The market is witnessing significant growth due to the increasing awareness of hygienic lifestyles and the desire for healthy, radiant skin. Factors such as excess oil, dirt, pollution, and unwanted skin cells contribute to the need for regular face washing. Excess oil and dirt can lead to various skin problems, including acne and facial skin disorders. Acne, an acne skin condition, affects individuals of all ages and genders. Organic face wash, infused with herbs and medicinal plants, has gained popularity due to its ability to address these issues while catering to consumers' growing preference for organic products. The aging population is another significant factor driving the demand for face wash. With the increasing signs of aging, such as wrinkles and fine lines, people are looking for skincare products that can help maintain healthy, youthful-looking skin. Skin type is a crucial consideration when it comes to face wash. Different skin types, including oily, dry, normal, sensitive, and combination, require specific formulations. For instance, anti-acne and oil-control products cater to those with oily skin, while hydrating and nourishing cleansers are ideal for dry skin. The rise of e-commerce stores and online retailing has made it easier for consumers to access a wide range of face wash options.

However, the convenience of retail stores remains a popular choice for those who prefer a more tactile shopping experience. UV rays and sunlight are common environmental factors that can damage the skin. Face wash infused with advanced ingredients like vitamin E, hyaluronic acid, and niacinamide can help protect the skin from these harmful elements. Facial appearance plays a significant role in personal care and beauty. Skincare products, including face wash, are essential components of daily routines, often used in conjunction with makeup and other cleansers. Dead skin cells and pollutants can accumulate on the skin, leading to a dull complexion. Regular use of a facial cleanser can help remove these impurities, revealing a clearer, more vibrant complexion. Sodium lauryl sulfate and cocamidopropyl betaine are common surfactants used in face wash. While effective at removing impurities, they can also cause skin irritation, redness, and allergic reactions in some individuals. Natural ingredients, such as tea tree oil, aloe vera, and essential oils, offer gentler alternatives. The facial cleanser market is evolving, with new product designs and packaging options. Refillable cleansers are gaining popularity due to their eco-friendly nature and reduced plastic waste. Gel and cream cleansers offer lightweight, clear textures that cater to consumers in humid climates.

Market Scope

Report Coverage

Details

Page number

155

Base year

2023

Historic period

2018-2022

Forecast period

2024-2028

Growth momentum & CAGR

Accelerate at a CAGR of 5.46%

Market growth 2024-2028

USD 8.38 Billion

Market structure

Fragmented

YoY growth 2023-2024(%)

5.16

Key countries

US, China, Japan, UK, and Germany

Competitive landscape

Leading Companies, Market Positioning of Companies, Competitive Strategies, and Industry Risks

Request Free Sample

What are the Key Data Covered in this Market Research and Growth Report?

  • CAGR of the market during the forecast period
  • Detailed information on factors that will drive the market growth and forecasting between 2024 and 2028
  • Precise estimation of the size of the market  and its contribution of the market in focus to the parent market
  • Accurate predictions about upcoming market growth and trends and changes in consumer behaviour
  • Growth of the market across APAC, North America, Europe, South America, and Middle East and Africa
  • Thorough analysis of the market's competitive landscape and detailed information about companies
  • Comprehensive analysis of factors that will challenge the growth of market companies

We can help! Our analysts can customize this market research report to meet your requirements. Get in touch

1 Executive Summary

  • 1.1 Market overview
    • Exhibit 01: Executive Summary – Chart on Market Overview
    • Exhibit 02: Executive Summary – Data Table on Market Overview
    • Exhibit 03: Executive Summary – Chart on Global Market Characteristics
    • Exhibit 04: Executive Summary – Chart on Market by Geography
    • Exhibit 05: Executive Summary – Chart on Market Segmentation by Distribution Channel
    • Exhibit 06: Executive Summary – Chart on Market Segmentation by End-user
    • Exhibit 07: Executive Summary – Chart on Incremental Growth
    • Exhibit 08: Executive Summary – Data Table on Incremental Growth
    • Exhibit 09: Executive Summary – Chart on Vendor Market Positioning

2 Market Landscape

  • 2.1 Market ecosystem
    • Exhibit 10: Parent market
    • Exhibit 11: Market Characteristics

3 Market Sizing

  • 3.1 Market definition
    • Exhibit 12: Offerings of vendors included in the market definition
  • 3.2 Market segment analysis
    • Exhibit 13: Market segments
  • 3.3 Market size 2023
    • 3.4 Market outlook: Forecast for 2023-2028
      • Exhibit 14: Chart on Global - Market size and forecast 2023-2028 ($ million)
      • Exhibit 15: Data Table on Global - Market size and forecast 2023-2028 ($ million)
      • Exhibit 16: Chart on Global Market: Year-over-year growth 2023-2028 (%)
      • Exhibit 17: Data Table on Global Market: Year-over-year growth 2023-2028 (%)

    4 Historic Market Size

    • 4.1 Global face wash market 2018 - 2022
      • Exhibit 18: Historic Market Size – Data Table on global face wash market 2018 - 2022 ($ million)
    • 4.2 Distribution Channel Segment Analysis 2018 - 2022
      • Exhibit 19: Historic Market Size – Distribution Channel Segment 2018 - 2022 ($ million)
    • 4.3 End-user Segment Analysis 2018 - 2022
      • Exhibit 20: Historic Market Size – End-user Segment 2018 - 2022 ($ million)
    • 4.4 Geography Segment Analysis 2018 - 2022
      • Exhibit 21: Historic Market Size – Geography Segment 2018 - 2022 ($ million)
    • 4.5 Country Segment Analysis 2018 - 2022
      • Exhibit 22: Historic Market Size – Country Segment 2018 - 2022 ($ million)

    5 Five Forces Analysis

    • 5.1 Five forces summary
      • Exhibit 23: Five forces analysis - Comparison between 2023 and 2028
    • 5.2 Bargaining power of buyers
      • Exhibit 24: Chart on Bargaining power of buyers – Impact of key factors 2023 and 2028
    • 5.3 Bargaining power of suppliers
      • Exhibit 25: Bargaining power of suppliers – Impact of key factors in 2023 and 2028
    • 5.4 Threat of new entrants
      • Exhibit 26: Threat of new entrants – Impact of key factors in 2023 and 2028
    • 5.5 Threat of substitutes
      • Exhibit 27: Threat of substitutes – Impact of key factors in 2023 and 2028
    • 5.6 Threat of rivalry
      • Exhibit 28: Threat of rivalry – Impact of key factors in 2023 and 2028
    • 5.7 Market condition
      • Exhibit 29: Chart on Market condition - Five forces 2023 and 2028

    6 Market Segmentation by Distribution Channel

    • 6.1 Market segments
      • Exhibit 30: Chart on Distribution Channel - Market share 2023-2028 (%)
      • Exhibit 31: Data Table on Distribution Channel - Market share 2023-2028 (%)
    • 6.2 Comparison by Distribution Channel
      • Exhibit 32: Chart on Comparison by Distribution Channel
      • Exhibit 33: Data Table on Comparison by Distribution Channel
    • 6.3 Offline - Market size and forecast 2023-2028
      • Exhibit 34: Chart on Offline - Market size and forecast 2023-2028 ($ million)
      • Exhibit 35: Data Table on Offline - Market size and forecast 2023-2028 ($ million)
      • Exhibit 36: Chart on Offline - Year-over-year growth 2023-2028 (%)
      • Exhibit 37: Data Table on Offline - Year-over-year growth 2023-2028 (%)
    • 6.4 Online - Market size and forecast 2023-2028
      • Exhibit 38: Chart on Online - Market size and forecast 2023-2028 ($ million)
      • Exhibit 39: Data Table on Online - Market size and forecast 2023-2028 ($ million)
      • Exhibit 40: Chart on Online - Year-over-year growth 2023-2028 (%)
      • Exhibit 41: Data Table on Online - Year-over-year growth 2023-2028 (%)
    • 6.5 Market opportunity by Distribution Channel
      • Exhibit 42: Market opportunity by Distribution Channel ($ million)
      • Exhibit 43: Data Table on Market opportunity by Distribution Channel ($ million)

    7 Market Segmentation by End-user

    • 7.1 Market segments
      • Exhibit 44: Chart on End-user - Market share 2023-2028 (%)
      • Exhibit 45: Data Table on End-user - Market share 2023-2028 (%)
    • 7.2 Comparison by End-user
      • Exhibit 46: Chart on Comparison by End-user
      • Exhibit 47: Data Table on Comparison by End-user
    • 7.3 Women - Market size and forecast 2023-2028
      • Exhibit 48: Chart on Women - Market size and forecast 2023-2028 ($ million)
      • Exhibit 49: Data Table on Women - Market size and forecast 2023-2028 ($ million)
      • Exhibit 50: Chart on Women - Year-over-year growth 2023-2028 (%)
      • Exhibit 51: Data Table on Women - Year-over-year growth 2023-2028 (%)
    • 7.4 Men - Market size and forecast 2023-2028
      • Exhibit 52: Chart on Men - Market size and forecast 2023-2028 ($ million)
      • Exhibit 53: Data Table on Men - Market size and forecast 2023-2028 ($ million)
      • Exhibit 54: Chart on Men - Year-over-year growth 2023-2028 (%)
      • Exhibit 55: Data Table on Men - Year-over-year growth 2023-2028 (%)
    • 7.5 Kids - Market size and forecast 2023-2028
      • Exhibit 56: Chart on Kids - Market size and forecast 2023-2028 ($ million)
      • Exhibit 57: Data Table on Kids - Market size and forecast 2023-2028 ($ million)
      • Exhibit 58: Chart on Kids - Year-over-year growth 2023-2028 (%)
      • Exhibit 59: Data Table on Kids - Year-over-year growth 2023-2028 (%)
    • 7.6 Market opportunity by End-user
      • Exhibit 60: Market opportunity by End-user ($ million)
      • Exhibit 61: Data Table on Market opportunity by End-user ($ million)

    8 Customer Landscape

    • 8.1 Customer landscape overview
      • Exhibit 62: Analysis of price sensitivity, lifecycle, customer purchase basket, adoption rates, and purchase criteria

    9 Geographic Landscape

    • 9.1 Geographic segmentation
      • Exhibit 63: Chart on Market share by geography 2023-2028 (%)
      • Exhibit 64: Data Table on Market share by geography 2023-2028 (%)
    • 9.2 Geographic comparison
      • Exhibit 65: Chart on Geographic comparison
      • Exhibit 66: Data Table on Geographic comparison
    • 9.3 APAC - Market size and forecast 2023-2028
      • Exhibit 67: Chart on APAC - Market size and forecast 2023-2028 ($ million)
      • Exhibit 68: Data Table on APAC - Market size and forecast 2023-2028 ($ million)
      • Exhibit 69: Chart on APAC - Year-over-year growth 2023-2028 (%)
      • Exhibit 70: Data Table on APAC - Year-over-year growth 2023-2028 (%)
    • 9.4 North America - Market size and forecast 2023-2028
      • Exhibit 71: Chart on North America - Market size and forecast 2023-2028 ($ million)
      • Exhibit 72: Data Table on North America - Market size and forecast 2023-2028 ($ million)
      • Exhibit 73: Chart on North America - Year-over-year growth 2023-2028 (%)
      • Exhibit 74: Data Table on North America - Year-over-year growth 2023-2028 (%)
    • 9.5 Europe - Market size and forecast 2023-2028
      • Exhibit 75: Chart on Europe - Market size and forecast 2023-2028 ($ million)
      • Exhibit 76: Data Table on Europe - Market size and forecast 2023-2028 ($ million)
      • Exhibit 77: Chart on Europe - Year-over-year growth 2023-2028 (%)
      • Exhibit 78: Data Table on Europe - Year-over-year growth 2023-2028 (%)
    • 9.6 South America - Market size and forecast 2023-2028
      • Exhibit 79: Chart on South America - Market size and forecast 2023-2028 ($ million)
      • Exhibit 80: Data Table on South America - Market size and forecast 2023-2028 ($ million)
      • Exhibit 81: Chart on South America - Year-over-year growth 2023-2028 (%)
      • Exhibit 82: Data Table on South America - Year-over-year growth 2023-2028 (%)
    • 9.7 Middle East and Africa - Market size and forecast 2023-2028
      • Exhibit 83: Chart on Middle East and Africa - Market size and forecast 2023-2028 ($ million)
      • Exhibit 84: Data Table on Middle East and Africa - Market size and forecast 2023-2028 ($ million)
      • Exhibit 85: Chart on Middle East and Africa - Year-over-year growth 2023-2028 (%)
      • Exhibit 86: Data Table on Middle East and Africa - Year-over-year growth 2023-2028 (%)
    • 9.8 US - Market size and forecast 2023-2028
      • Exhibit 87: Chart on US - Market size and forecast 2023-2028 ($ million)
      • Exhibit 88: Data Table on US - Market size and forecast 2023-2028 ($ million)
      • Exhibit 89: Chart on US - Year-over-year growth 2023-2028 (%)
      • Exhibit 90: Data Table on US - Year-over-year growth 2023-2028 (%)
    • 9.9 China - Market size and forecast 2023-2028
      • Exhibit 91: Chart on China - Market size and forecast 2023-2028 ($ million)
      • Exhibit 92: Data Table on China - Market size and forecast 2023-2028 ($ million)
      • Exhibit 93: Chart on China - Year-over-year growth 2023-2028 (%)
      • Exhibit 94: Data Table on China - Year-over-year growth 2023-2028 (%)
    • 9.10 Japan - Market size and forecast 2023-2028
      • Exhibit 95: Chart on Japan - Market size and forecast 2023-2028 ($ million)
      • Exhibit 96: Data Table on Japan - Market size and forecast 2023-2028 ($ million)
      • Exhibit 97: Chart on Japan - Year-over-year growth 2023-2028 (%)
      • Exhibit 98: Data Table on Japan - Year-over-year growth 2023-2028 (%)
    • 9.11 UK - Market size and forecast 2023-2028
      • Exhibit 99: Chart on UK - Market size and forecast 2023-2028 ($ million)
      • Exhibit 100: Data Table on UK - Market size and forecast 2023-2028 ($ million)
      • Exhibit 101: Chart on UK - Year-over-year growth 2023-2028 (%)
      • Exhibit 102: Data Table on UK - Year-over-year growth 2023-2028 (%)
    • 9.12 Germany - Market size and forecast 2023-2028
      • Exhibit 103: Chart on Germany - Market size and forecast 2023-2028 ($ million)
      • Exhibit 104: Data Table on Germany - Market size and forecast 2023-2028 ($ million)
      • Exhibit 105: Chart on Germany - Year-over-year growth 2023-2028 (%)
      • Exhibit 106: Data Table on Germany - Year-over-year growth 2023-2028 (%)
    • 9.13 Market opportunity by geography
      • Exhibit 107: Market opportunity by geography ($ million)
      • Exhibit 108: Data Tables on Market opportunity by geography ($ million)

    10 Drivers, Challenges, and Trends

    • 10.1 Market drivers
      • 10.2 Market challenges
        • 10.3 Impact of drivers and challenges
          • Exhibit 109: Impact of drivers and challenges in 2023 and 2028
        • 10.4 Market trends

          11 Vendor Landscape

          • 11.1 Overview
            • 11.2 Vendor landscape
              • Exhibit 110: Overview on Criticality of inputs and Factors of differentiation
            • 11.3 Landscape disruption
              • Exhibit 111: Overview on factors of disruption
            • 11.4 Industry risks
              • Exhibit 112: Impact of key risks on business

            12 Vendor Analysis

            • 12.1 Vendors covered
              • Exhibit 113: Vendors covered
            • 12.2 Market positioning of vendors
              • Exhibit 114: Matrix on vendor position and classification
            • 12.3 Amway Corp.
              • Exhibit 115: Amway Corp. - Overview
              • Exhibit 116: Amway Corp. - Product / Service
              • Exhibit 117: Amway Corp. - Key news
              • Exhibit 118: Amway Corp. - Key offerings
            • 12.4 Beiersdorf AG
              • Exhibit 119: Beiersdorf AG - Overview
              • Exhibit 120: Beiersdorf AG - Business segments
              • Exhibit 121: Beiersdorf AG - Key news
              • Exhibit 122: Beiersdorf AG - Key offerings
              • Exhibit 123: Beiersdorf AG - Segment focus
            • 12.5 Bloomtown Ltd.
              • Exhibit 124: Bloomtown Ltd. - Overview
              • Exhibit 125: Bloomtown Ltd. - Key offerings
            • 12.6 Emami Ltd.
              • Exhibit 126: Emami Ltd. - Overview
              • Exhibit 127: Emami Ltd. - Product / Service
              • Exhibit 128: Emami Ltd. - Key offerings
            • 12.7 Himalaya Global Holdings Ltd.
              • Exhibit 129: Himalaya Global Holdings Ltd. - Overview
              • Exhibit 130: Himalaya Global Holdings Ltd. - Product / Service
              • Exhibit 131: Himalaya Global Holdings Ltd. - Key offerings
            • 12.8 Honasa Consumer Pvt. Ltd.
              • Exhibit 132: Honasa Consumer Pvt. Ltd. - Overview
              • Exhibit 133: Honasa Consumer Pvt. Ltd. - Product / Service
              • Exhibit 134: Honasa Consumer Pvt. Ltd. - Key offerings
            • 12.9 Johnson and Johnson
              • Exhibit 135: Johnson and Johnson - Overview
              • Exhibit 136: Johnson and Johnson - Business segments
              • Exhibit 137: Johnson and Johnson - Key news
              • Exhibit 138: Johnson and Johnson - Key offerings
              • Exhibit 139: Johnson and Johnson - Segment focus
            • 12.10 LOreal SA
              • Exhibit 140: LOreal SA - Overview
              • Exhibit 141: LOreal SA - Business segments
              • Exhibit 142: LOreal SA - Key news
              • Exhibit 143: LOreal SA - Key offerings
              • Exhibit 144: LOreal SA - Segment focus
            • 12.11 NAOS
              • Exhibit 145: NAOS - Overview
              • Exhibit 146: NAOS - Product / Service
              • Exhibit 147: NAOS - Key offerings
            • 12.12 Shiseido Co. Ltd.
              • Exhibit 148: Shiseido Co. Ltd. - Overview
              • Exhibit 149: Shiseido Co. Ltd. - Product / Service
              • Exhibit 150: Shiseido Co. Ltd. - Key offerings
            • 12.13 The Body Shop International Ltd.
              • Exhibit 151: The Body Shop International Ltd. - Overview
              • Exhibit 152: The Body Shop International Ltd. - Product / Service
              • Exhibit 153: The Body Shop International Ltd. - Key offerings
            • 12.14 The Estee Lauder Companies
              • Exhibit 154: The Estee Lauder Companies - Overview
              • Exhibit 155: The Estee Lauder Companies - Product / Service
              • Exhibit 156: The Estee Lauder Companies - Key offerings
            • 12.15 The Honest Co. Inc.
              • Exhibit 157: The Honest Co. Inc. - Overview
              • Exhibit 158: The Honest Co. Inc. - Product / Service
              • Exhibit 159: The Honest Co. Inc. - Key offerings
            • 12.16 The Procter and Gamble Co.
              • Exhibit 160: The Procter and Gamble Co. - Overview
              • Exhibit 161: The Procter and Gamble Co. - Business segments
              • Exhibit 162: The Procter and Gamble Co. - Key news
              • Exhibit 163: The Procter and Gamble Co. - Key offerings
              • Exhibit 164: The Procter and Gamble Co. - Segment focus
            • 12.17 Unilever PLC
              • Exhibit 165: Unilever PLC - Overview
              • Exhibit 166: Unilever PLC - Business segments
              • Exhibit 167: Unilever PLC - Key news
              • Exhibit 168: Unilever PLC - Key offerings
              • Exhibit 169: Unilever PLC - Segment focus

            13 Appendix

            • 13.1 Scope of the report
              • 13.2 Inclusions and exclusions checklist
                • Exhibit 170: Inclusions checklist
                • Exhibit 171: Exclusions checklist
              • 13.3 Currency conversion rates for US$
                • Exhibit 172: Currency conversion rates for US$
              • 13.4 Research methodology
                • Exhibit 173: Research methodology
                • Exhibit 174: Validation techniques employed for market sizing
                • Exhibit 175: Information sources
              • 13.5 List of abbreviations
                • Exhibit 176: List of abbreviations

              Research Methodology

              Technavio presents a detailed picture of the market by way of study, synthesis, and summation of data from multiple sources. The analysts have presented the various facets of the market with a particular focus on identifying the key industry influencers. The data thus presented is comprehensive, reliable, and the result of extensive research, both primary and secondary.

              INFORMATION SOURCES

              Primary sources

              • Manufacturers and suppliers
              • Channel partners
              • Industry experts
              • Strategic decision makers

              Secondary sources

              • Industry journals and periodicals
              • Government data
              • Financial reports of key industry players
              • Historical data
              • Press releases

              DATA ANALYSIS

              Data Synthesis

              • Collation of data
              • Estimation of key figures
              • Analysis of derived insights

              Data Validation

              • Triangulation with data models
              • Reference against proprietary databases
              • Corroboration with industry experts

              REPORT WRITING

              Qualitative

              • Market drivers
              • Market challenges
              • Market trends
              • Five forces analysis

              Quantitative

              • Market size and forecast
              • Market segmentation
              • Geographical insights
              • Competitive landscape

              Interested in this report?

              Get your sample now to see our research methodology and insights!

              Download Now

              Frequently Asked Questions

              Face Wash market growth will increase by 8386.06 million during 2024-2028.

              The Face Wash market is expected to grow at a CAGR of 5.46% during 2024-2028.

              Face Wash market is segmented by Distribution Channel( Offline, Online) End-user( Women, Men, Kids)

              Alchemee LLC, Amway Corp., Beiersdorf AG, Bloomtown Ltd., Christian Dior SE, Emami Ltd., Helios Lifestyle Pvt Ltd., Himalaya Global Holdings Ltd., Honasa Consumer Pvt. Ltd., Johnson and Johnson, Kao Corp., Khadi Natural, LOreal SA, Mountain Valley Springs India Pvt. Ltd., NAOS, Natura and Co Holding SA, Oriflame Cosmetics S.A., Shiseido Co. Ltd., The Body Shop International Ltd., The Estee Lauder Companies, The Honest Co. Inc., The Procter and Gamble Co., Unilever PLC are a few of the key vendors in the Face Wash market.

              APAC will register the highest growth rate of 50.98% among the other regions. Therefore, the Face Wash market in APAC is expected to garner significant business opportunities for the vendors during the forecast period.

              US, China, Japan, UK, Germany

              • Increasing per capita income and changing purchase behaviorThe increasing per capita income is the driving factor this market.
              • especially in developing countries is the driving factor this market.
              • is the main reason for the growing disposable income of people in the region. In 2021 is the driving factor this market.
              • China's disposable per capita income for Q1 rose by around 13.7% compared with the same period in the previous year. Owing to high disposable income is the driving factor this market.
              • consumers have the financial freedom to spend more on non-essential goods such as personal care products such as face wash. Therefore is the driving factor this market.
              • as the demand for and sales of such high-end brands are increasing is the driving factor this market.
              • the profit margins of vendors are also growing is the driving factor this market.
              • which is influencing the growth of the global market. In recent times is the driving factor this market.
              • emerging economies in APAC have been experiencing a change in consumer purchasing behavior and habits. Apart from the high discretionary income is the driving factor this market.
              • high brand penetration is the driving factor this market.
              • and availability of a wide range of products on online portals are influencing the purchase behavior of consumers. This is adding to the growth of the global face wash market. Moreover is the driving factor this market.
              • the relative growth in disposable personal income in developed countries such as the US is also contributing to a rise in consumer spending. Thus is the driving factor this market.
              • the high price does not deter consumers from buying them is the driving factor this market.
              • owing to their higher disposable income. It has also been noted that working women tend to spend more on personal care products. Thus is the driving factor this market.
              • the rising percentage of working women globally is driving the global face wash market during the forecast period. is the driving factor this market.

              The Face Wash market vendors should focus on grabbing business opportunities from the Offline segment as it accounted for the largest market share in the base year.