
Cloud Data Warehouse Market Size 2025-2029
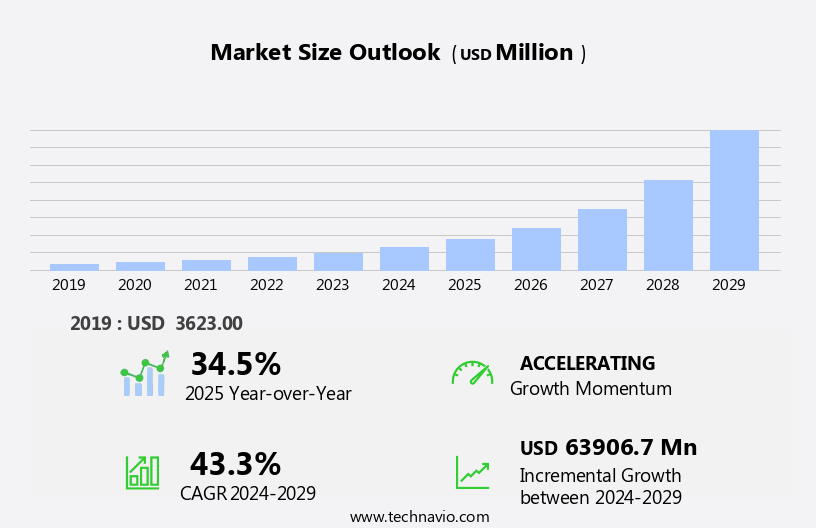
The cloud data warehouse market size is forecast to increase by USD 63.91 billion at a CAGR of 43.3% between 2024 and 2029.
- The market is experiencing significant growth, driven by the increasing penetration of IoT-enabled devices generating vast amounts of data. This data requires efficient storage and analysis, making cloud data warehouses an attractive solution due to their scalability and flexibility. Additionally, the growing need for edge computing further fuels market expansion, as organizations seek to process data closer to its source in real-time. However, challenges persist in the form of company lock-in issues, where businesses may find it difficult to migrate their data from one cloud provider to another, potentially limiting their flexibility and strategic options.
- To capitalize on market opportunities and navigate challenges effectively, companies must stay informed of emerging trends and adapt their strategies accordingly. By focusing on interoperability and data portability, they can mitigate lock-in risks and maintain agility in their data management strategies. The market is experiencing significant growth due to several key trends. The increasing penetration of Internet of Things (IoT) devices is driving the need for more efficient data management solutions, leading to the adoption of cloud data warehouses.
What will be the Size of the Cloud Data Warehouse Market during the forecast period?
Explore in-depth regional segment analysis with market size data - historical 2019-2023 and forecasts 2025-2029 - in the full report.
Request Free Sample
- In the dynamic market, businesses seek efficient solutions for managing and analyzing their data. Data visualization tools and business intelligence platforms enable users to gain insights through interactive dashboards and reports. Data automation tools streamline data processing, while data enrichment tools enhance data quality by adding external data sources. Data virtualization tools provide a unified view of data from various sources, and data integration tools ensure seamless data flow between systems. NoSQL databases and big data platforms offer scalability and flexibility for handling large volumes of data. Data cleansing tools eliminate errors and inconsistencies, while data encryption tools secure sensitive data.
- Data migration tools facilitate moving data between systems, and data validation tools ensure data accuracy. Real-time analytics platforms and predictive analytics platforms provide insights in near real-time, while prescriptive analytics platforms suggest actions based on data trends. Data deduplication tools eliminate redundant data, and data governance tools ensure compliance with regulations. Data orchestration tools manage workflows, and data science platforms facilitate machine learning and artificial intelligence applications. Data archiving tools store historical data, and data pipeline tools manage data movement between systems. Data fabric and data standardization tools ensure data consistency across the organization, while data replication tools maintain data availability and disaster recovery.
How is this Cloud Data Warehouse Industry segmented?
The cloud data warehouse industry research report provides comprehensive data (region-wise segment analysis), with forecasts and estimates in "USD million" for the period 2025-2029, as well as historical data from 2019-2023 for the following segments.
- Industry Application
- Large enterprises
- SMEs
- Deployment
- Public
- Private
- End-user
- Cloud server provider
- IT and ITES
- BFSI
- Retail
- Others
- Application
- Customer analytics
- Business intelligence
- Data modernization
- Operational analytics
- Predictive analytics
- Geography
- North America
- US
- Canada
- Mexico
- Europe
- France
- Germany
- Italy
- UK
- APAC
- China
- India
- Japan
- Rest of World (ROW)
- North America
By Industry Application Insights
The large enterprises segment is estimated to witness significant growth during the forecast period. In today's business landscape, cloud data warehouse solutions have gained significant traction among large enterprises, enabling them to efficiently manage and process data across various industries and geographies. Traditional on-premises data warehouses come with high costs due to the need for expensive hardware and physical space. Cloud-based alternatives offer a more cost-effective and convenient solution, allowing organizations to access tools and information remotely and streamline document sharing between multiple workplaces. Predictive analytics, data cost optimization, and data discovery are key drivers for cloud data warehouse adoption. These technologies offer insights into data trends and patterns, helping businesses make data-driven decisions.
Data timeliness and data standardization are crucial aspects of data management, ensuring data accuracy and consistency. Data orchestration, enrichment, and transformation are essential for data warehouse modernization, while data masking, encryption, and access control ensure data security and compliance. Hybrid data warehouses and data federation enable seamless integration of data from various sources, while data pipelines and replication ensure data availability and reliability. Data maturity models, data lineage, and data modeling provide a framework for managing data throughout its lifecycle. Real-time analytics and data virtualization offer insights in near real-time, while data scalability and ethics are essential considerations for large-scale data management.
Overall, the market is witnessing significant growth due to the increasing demand for efficient, cost-effective, and scalable data management solutions.
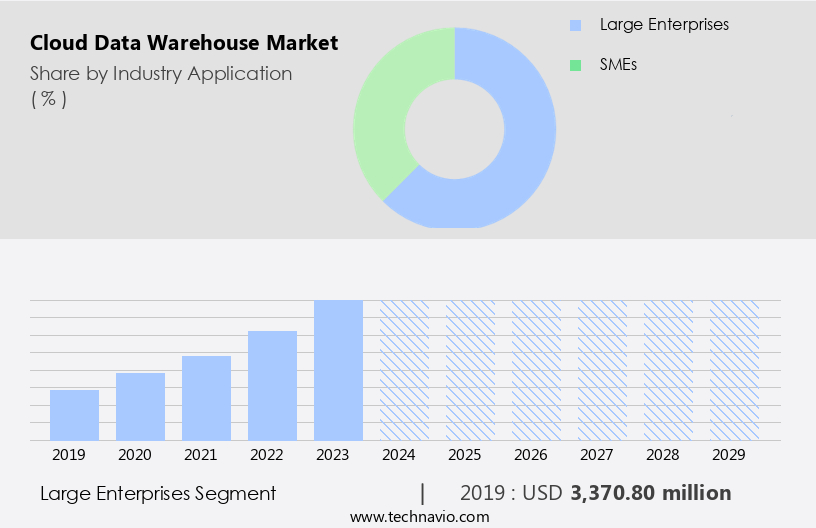
The Large enterprises segment was valued at USD 3.37 billion in 2019 and showed a gradual increase during the forecast period.
The Cloud Data Warehouse Market is rapidly evolving as businesses embrace advanced data management platforms to handle massive datasets efficiently. With growing adoption, organizations leverage data intelligence to drive strategic decision-making and enhance operational efficiencies. Modern data warehousing appliances provide scalable solutions, ensuring seamless integration with cloud-based ecosystems. As enterprises transition from legacy systems, data warehouse migration plays a crucial role in facilitating a smooth shift to cloud environments, minimizing downtime and preserving data integrity. Additionally, continuous data warehouse optimization is essential to enhance performance, reduce costs, and improve query response times.
Machine learning, data science, and artificial intelligence are transforming data analytics, enabling organizations to gain deeper insights and automate processes. Data regulations and compliance are critical factors in data management, with data governance frameworks ensuring data accuracy, relevance, and quality. Data warehousing optimization, backup, and migration are essential for maintaining data availability and ensuring business continuity. Cloud storage offers a cost-effective and scalable solution for data retention and archiving. Data integration and performance are essential for efficient data processing and analysis. Data visualization offers insights into complex data sets, enabling businesses to make informed decisions. Cloud data warehouses provide a scalable and flexible platform for data management, offering features such as machine learning, predictive analytics, and customer analytics.
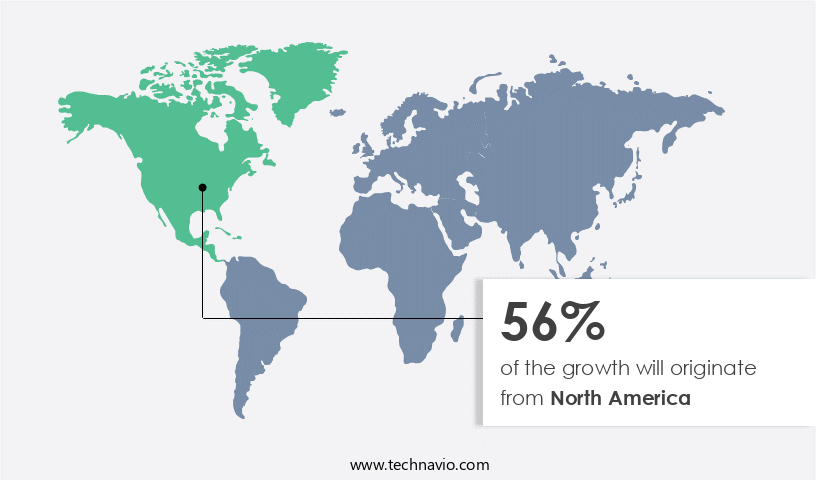
Regional Analysis
North America is estimated to contribute 56% to the growth of the global market during the forecast period. Technavio's analysts have elaborately explained the regional trends and drivers that shape the market during the forecast period.
In the global market, the adoption of cloud data warehouses is witnessing significant growth, particularly in North America. SMEs in various sectors, including BFSI, government and public, healthcare, IT, manufacturing, telecommunication, and other,s are increasingly turning to cloud data warehouses due to their advantages such as power efficiency and enhanced write speed. SMEs, with their dynamic requirements and limited resources, are under constant pressure to stay competitive in the rapidly evolving technological landscape. The proliferation of IoT and third-platform technologies like cloud computing and analytics is driving organizations to implement IT solutions that can handle the influx of data and provide actionable insights. Data masking tools protect sensitive data, and data analytics tools provide insights for decision-making. Data federation tools enable access to distributed data sources, and machine learning platforms automate data analysis and prediction. Data quality tools monitor data accuracy and completeness, and data mesh promotes a decentralized approach to data management.
Cloud data warehouses offer data cost optimization through pay-as-you-go models, data discovery through advanced analytics capabilities, data timeliness with real-time analytics, data standardization through automated data transformation, data orchestration with seamless integration, and data enrichment through machine learning and AI. Data warehouse modernization enables businesses to leverage big data and data analytics for data-driven decision-making. Data maturity models help organizations assess their data management capabilities and identify areas for improvement. Data pipelines and data replication ensure data completeness and consistency across various systems. Data backup, data marts, and data ingestion facilitate data retention and data availability. Data migration, data cleansing, and data catalogs ensure data accuracy and data lineage.
Data transformation, data consistency, and data automation optimize data warehouse performance. Data security, data encryption, and data access control ensure data privacy and compliance with regulations. Data masking and data privacy protect sensitive data. Hybrid data warehouses offer flexibility for organizations to manage both on-premises and cloud data. Data governance frameworks and data modeling help manage data quality and data relevance. Data ethics and data governance ensure data reliability and data compliance. Data lakes provide a scalable and cost-effective solution for storing large volumes of data. Data insights and data visualization enable businesses to gain valuable insights from their data, driving business intelligence and informing strategic decision-making.
Cloud storage offers scalability and flexibility for data storage and retrieval. Data performance and data integration ensure seamless data processing and analysis. Data science and machine learning provide predictive and prescriptive analytics capabilities. Data deduplication and data validation ensure data accuracy and data relevance. Data availability and data virtualization enable real-time access to data from anywhere, at any time. Data warehouses are essential for businesses looking to gain a competitive edge by leveraging their data assets. The market is expected to continue growing as organizations seek to modernize their data management capabilities and keep pace with technological advances.
Market Dynamics
Our researchers analyzed the data with 2024 as the base year, along with the key drivers, trends, and challenges. A holistic analysis of drivers will help companies refine their marketing strategies to gain a competitive advantage.
What are the Cloud Data Warehouse market drivers leading to the rise in the adoption of Industry?
- The increasing adoption of Internet of Things (IoT)-enabled devices serves as the primary catalyst for market growth. The proliferation of IoT-connected devices worldwide has led to an unprecedented rise in data generation. Connected cars, homes, health systems, and cities have significantly increased network traffic by transferring vast amounts of data to data centers. This trend has necessitated the need for efficient data storage and analytics solutions. Enterprises are investing heavily in data warehousing and big data analytics to effectively manage and derive business intelligence insights from the massive data volumes. Data deduplication, data validation, and data quality are critical considerations in data warehousing. Cloud storage offers scalability, flexibility, and cost savings, making it an attractive option for businesses.
- Machine learning and data science are essential tools for data analysis, enabling businesses to gain insights from complex data sets. Data integration and data modeling are also crucial for ensuring data relevance and accuracy. Data performance, data access control, and data governance frameworks are essential for maintaining data security and ensuring compliance with data regulations. Data recovery is another critical aspect of data management, ensuring business continuity in the event of data loss. Data warehouse consolidation can help businesses reduce costs and improve data integration and data access. Overall, the need for effective data management and analysis is driving the adoption of advanced data warehousing solutions.
What are the Cloud Data Warehouse market trends shaping the Industry?
- The growing requirement for edge computing represents a significant market trend in the technology industry. This shift towards decentralized processing and data analysis at the source is becoming increasingly necessary for efficient and real-time data management. The market has experienced significant growth due to the increasing number of Internet-of-Things (IoT) devices, which reached an estimated 16.7 billion in 2023. This development is a major catalyst for the market, as IoT devices generate vast amounts of data that require efficient storage and processing solutions. The concept of IoT was popularized by the use of Radio Frequency Identification (RFID) sensors in logistics and warehouses in the late 1990s. Cloud data warehouses offer several advantages over traditional on-premises solutions, including data federation, data availability, real-time analytics, and data scalability. Data federation enables the integration of data from various sources, while real-time analytics allows for immediate insights from data.
- Data availability ensures that data is accessible from anywhere, and data scalability enables the handling of large volumes of data. Moreover, cloud data warehouses offer data archiving, data virtualization, data lineage, and data compliance features. Data archiving enables the storage of historical data, while data virtualization allows for the creation of a unified view of data from multiple sources. Data lineage helps in understanding the origin and movement of data, and data compliance ensures adherence to regulations. Artificial intelligence and machine learning technologies are also being integrated into cloud data warehouses to enhance data accuracy, data reliability, and data security.
How does Cloud Data Warehouse market face challenges during its growth?
- The issue of company lock-in, which restricts industry growth, is a significant challenge that necessitates careful consideration in the business world. Company lock-in, a situation where a customer is dependent on a specific company for using its products or services due to the difficulty in transitioning to another provider, poses a significant challenge to the adoption of cloud data warehouses. The lack of standardization in cloud solutions contributes to this issue, making it difficult for customers to migrate to alternative offerings. Current approaches to addressing company lock-in focus primarily on technological solutions. However, the complexity of applications built on proprietary platforms and tools makes it challenging for customers to switch providers. This dependency on a single company can hinder innovation and limit the potential benefits of a diverse market.
- To mitigate the impact of company lock-in, it is crucial to promote standardization and interoperability in cloud data warehouses. This will enable customers to easily transition between providers, fostering a more competitive market and driving innovation. By focusing on these efforts, businesses can ensure they have the flexibility to adapt to changing market conditions and take advantage of the latest technological advancements. Data ethics and data governance are becoming increasingly important considerations in the use of cloud data warehouses, ensuring that data is used responsibly and ethically. Data lakes are also being used in conjunction with cloud data warehouses to provide a more flexible and cost-effective solution for storing and processing large volumes of data.
Exclusive Customer Landscape
The cloud data warehouse market forecasting report includes the adoption lifecycle of the market, covering from the innovator's stage to the laggard's stage. It focuses on adoption rates in different regions based on penetration. Furthermore, the cloud data warehouse market report also includes key purchase criteria and drivers of price sensitivity to help companies evaluate and develop their market growth analysis strategies.
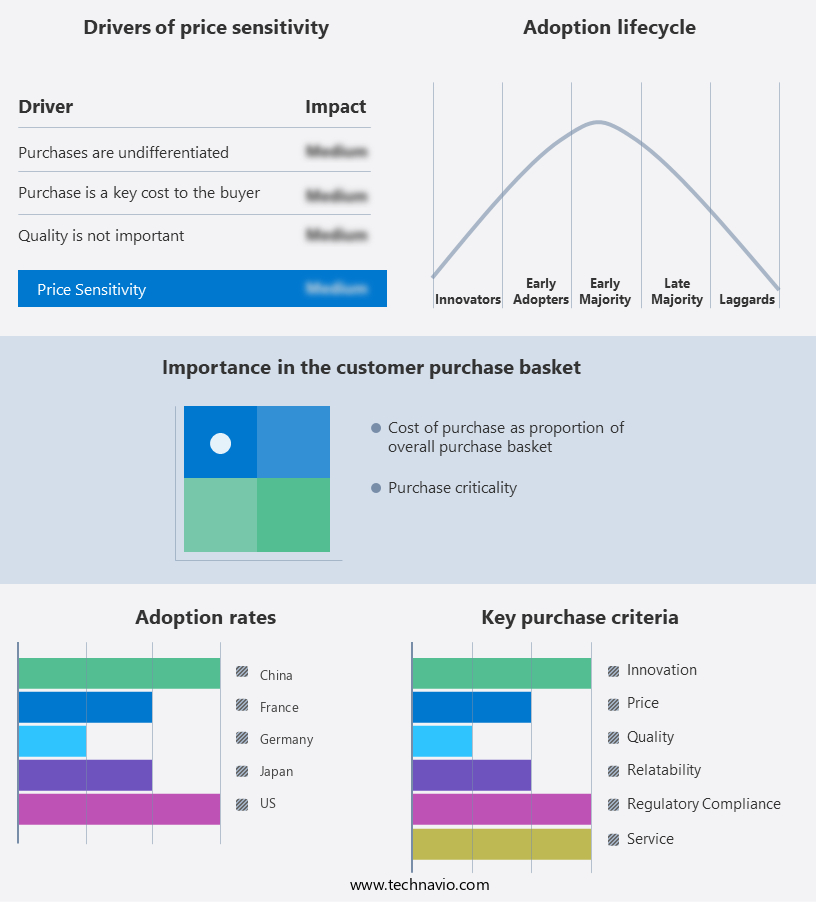
Customer Landscape
Key Companies & Market Insights
Companies are implementing various strategies, such as strategic alliances, cloud data warehouse market forecast, partnerships, mergers and acquisitions, geographical expansion, and product/service launches, to enhance their presence in the industry.
Accur8 Software - This company specializes in cloud-based data warehouse services, enabling organizations to efficiently discover, model, cleanse, and report on their data.
The industry research and growth report includes detailed analyses of the competitive landscape of the market and information about key companies, including:
- Accur8 Software
- Actian Corp.
- Alibaba Cloud
- Amazon.com Inc.
- Cloudera Inc.
- Google LLC
- Hewlett Packard Enterprise Co.
- Huawei Technologies Co. Ltd.
- International Business Machines Corp.
- Microsoft Corp.
- Oracle Corp.
- Panoply Ltd.
- SAP SE
- Sigma Computing Inc.
- SingleStore Inc.
- Snowflake Inc.
- Talend Inc
- Tencent Holdings Ltd.
- Teradata Corp.
- Translink Information Technology Shanghai Co. Ltd.
Qualitative and quantitative analysis of companies has been conducted to help clients understand the wider business environment as well as the strengths and weaknesses of key industry players. Data is qualitatively analyzed to categorize companies as pure play, category-focused, industry-focused, and diversified; it is quantitatively analyzed to categorize companies as dominant, leading, strong, tentative, and weak.
Recent Development and News in Cloud Data Warehouse Market
- In February 2024, Amazon Web Services (AWS) introduced a new feature to its Redshift data warehouse service â "Serverless Bi-Modal Analytics" â enabling users to analyze both operational and analytical data without managing infrastructure (AWS Press Release, 2024). This development caters to the growing demand for flexible, cost-effective, and scalable data warehousing solutions.
- In May 2024, Microsoft Azure and Snowflake, a cloud-based data warehousing platform, announced a strategic partnership to provide joint customers with optimized data sharing capabilities between Azure Synapse Analytics and Snowflake (Microsoft News Center, 2024). This collaboration enhances data integration and interoperability between the two cloud services, offering more flexibility and choice to businesses.
- In October 2024, Google Cloud Platform (GCP) raised the bar in the cloud data warehousing market by launching "Autopilot," an intelligent data warehousing solution that automates data modeling, schema management, and query optimization (Google Cloud Blog, 2024). This technological advancement aims to simplify data warehousing for businesses and reduce the need for specialized data engineering skills.
- In January 2025, Snowflake secured a strategic investment of USD1.56 billion in a Series G funding round, led by Altimeter Capital and Dragoneer Investment Group (Snowflake Press Release, 2025). This significant investment further strengthens Snowflake's position in the cloud data warehousing market and fuels its continued growth and innovation.
Research Analyst Overview
The market continues to evolve, driven by the increasing demand for efficient data management and analysis. Data warehouses in the cloud offer numerous benefits, including predictive analytics, data cost optimization, and real-time insights. These solutions enable organizations to make data-driven decisions, ensuring data timeliness and relevance. Data orchestration and data pipeline management are essential components of cloud data warehouses, facilitating seamless data flow and integration. Data enrichment and transformation capabilities enable organizations to gain valuable insights from raw data, while data discovery and cataloging tools help users locate and access relevant information. Data security and governance are paramount in the market.
Encryption, access control, and data masking are essential features that ensure data privacy and compliance with regulations. Data warehousing solutions also offer data backup and recovery options, ensuring business continuity. The market dynamics of cloud data warehouses are influenced by various factors, including data maturity models, data consistency, and performance. Hybrid data warehouses offer a balance between on-premises and cloud solutions, providing flexibility and scalability. Machine learning and artificial intelligence are increasingly being integrated into cloud data warehouses, enabling prescriptive analytics and automation. Data warehousing solutions are being adopted across various sectors, including finance, healthcare, retail, and manufacturing, to gain valuable insights and drive business growth.
The ongoing unfolding of market activities and evolving patterns underscore the importance of cloud data warehouses in today's data-driven business landscape.
Dive into Technavio's robust research methodology, blending expert interviews, extensive data synthesis, and validated models for unparalleled Cloud Data Warehouse Market insights. See full methodology.
|
Market Scope |
|
|
Report Coverage |
Details |
|
Page number |
250 |
|
Base year |
2024 |
|
Historic period |
2019-2023 |
|
Forecast period |
2025-2029 |
|
Growth momentum & CAGR |
Accelerate at a CAGR of 43.3% |
|
Market growth 2025-2029 |
USD 63.91 billion |
|
Market structure |
Fragmented |
|
YoY growth 2024-2025(%) |
34.5 |
|
Key countries |
US, China, Germany, Canada, UK, Japan, France, India, Mexico, and Italy |
|
Competitive landscape |
Leading Companies, Market Positioning of Companies, Competitive Strategies, and Industry Risks |
What are the Key Data Covered in this Cloud Data Warehouse Market Research and Growth Report?
- CAGR of the Cloud Data Warehouse industry during the forecast period
- Detailed information on factors that will drive the growth and forecasting between 2025 and 2029
- Precise estimation of the size of the market and its contribution of the industry in focus to the parent market
- Accurate predictions about upcoming growth and trends and changes in consumer behaviour
- Growth of the market across North America, Europe, APAC, Middle East and Africa, and South America
- Thorough analysis of the market's competitive landscape and detailed information about companies
- Comprehensive analysis of factors that will challenge the cloud data warehouse market growth of industry companies
We can help! Our analysts can customize this cloud data warehouse market research report to meet your requirements.
 RIA -
RIA - 
