Cloud Radio Access Network Market Analysis, Size, and Forecast 2026-2030: APAC (China, Japan, and India), North America (US, Canada, and Mexico), Europe (Germany, UK, and France), Middle East and Africa (Saudi Arabia, UAE, and South Africa), South America (Brazil, Argentina, and Colombia), and Rest of World (ROW)

Cloud Radio Access Network Market Analysis, Size, and Forecast 2026-2030:
APAC (China, Japan, and India), North America (US, Canada, and Mexico), Europe (Germany, UK, and France), Middle East and Africa (Saudi Arabia, UAE, and South Africa), South America (Brazil, Argentina, and Colombia), and Rest of World (ROW)

Published: Dec 2025 312 Pages SKU: IRTNTR81178

Market Overview at a Glance

$30.60 B
Market Opportunity
20%
CAGR 2025 - 2030
33.8%
APAC Growth
$9.72 B
4G and LTE segment 2024

Cloud Radio Access Network Market Size 2026-2030

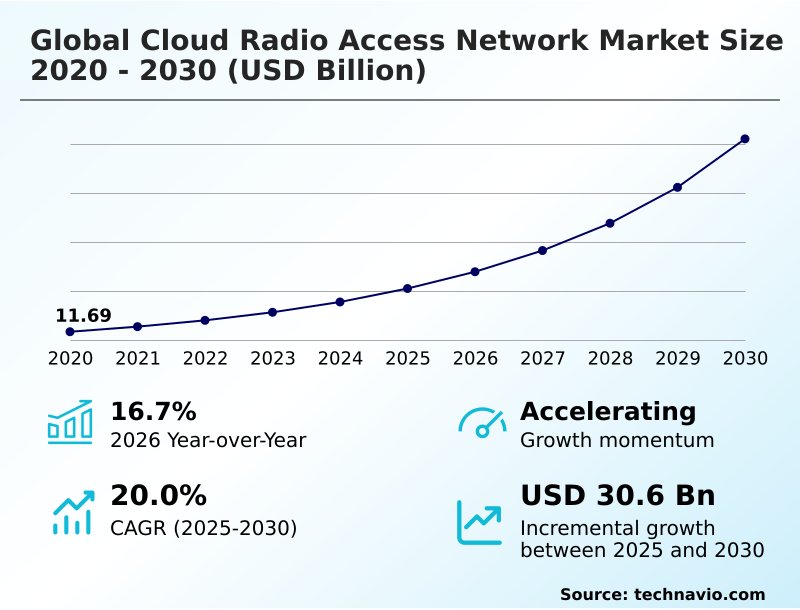
The cloud radio access network market size is valued to increase by USD 30.60 billion, at a CAGR of 20% from 2025 to 2030. Economic imperatives and total cost of ownership reduction will drive the cloud radio access network market.

Major Market Trends & Insights

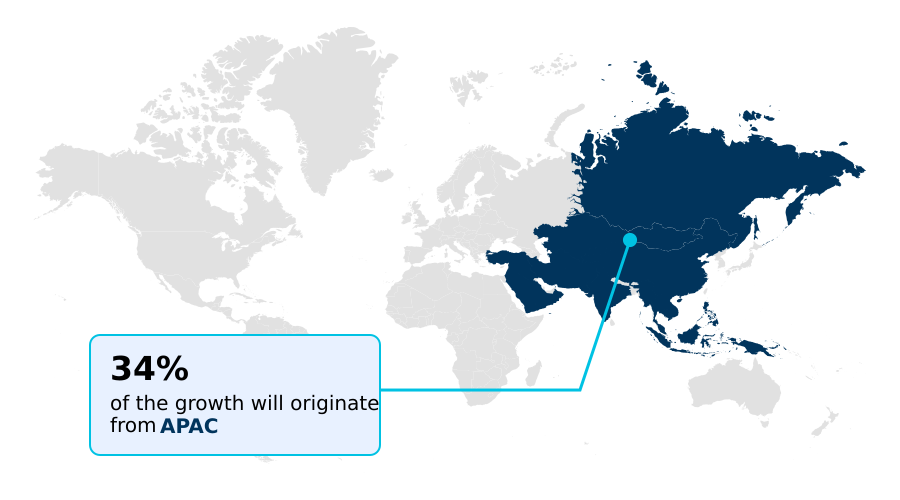
  • APAC dominated the market and accounted for a 33.8% growth during the forecast period.
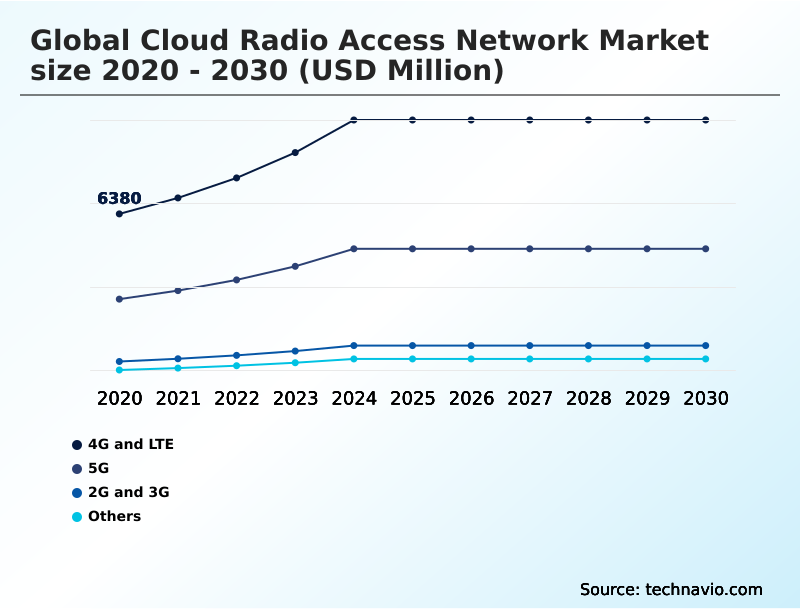
  • By Connectivity - 4G and LTE segment was valued at USD 9.72 billion in 2024
  • By Type - Centralised RAN segment accounted for the largest market revenue share in 2024

Market Size & Forecast

  • Market Opportunities: USD 39.45 billion
  • Market Future Opportunities: USD 30.60 billion
  • CAGR from 2025 to 2030 : 20%

Market Summary

  • The Cloud Radio Access Network market is undergoing a fundamental architectural shift, moving away from distributed, proprietary hardware toward centralized and virtualized models. This transformation is driven by the need for greater operational efficiency and the demanding performance requirements of 5G services.
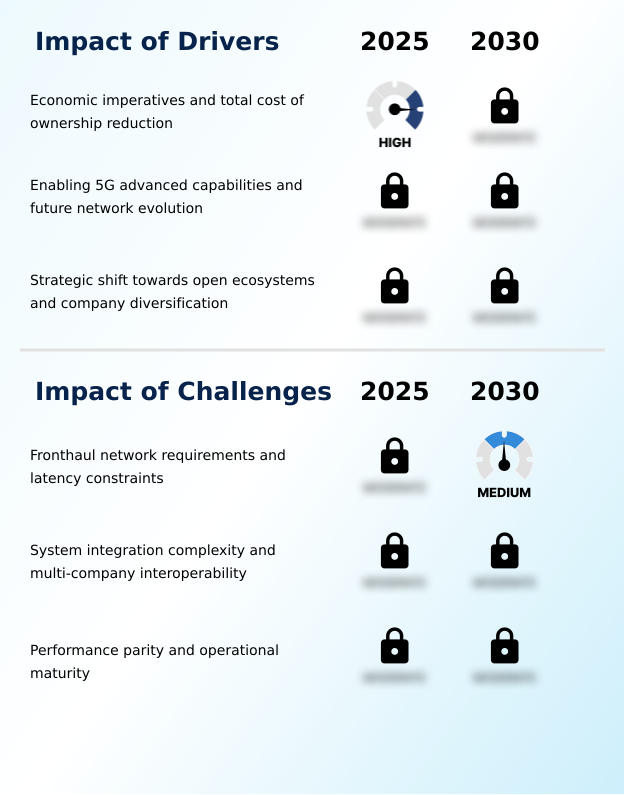
  • Key market drivers include significant total cost of ownership reduction and the strategic imperative to create a more diverse and competitive supplier ecosystem. Concurrently, the industry is navigating trends like the integration of artificial intelligence for network automation and the convergence of RAN with edge computing.
  • However, this evolution is not without challenges; system integration complexity and ensuring performance parity with traditional systems are significant concerns for operators.
  • For instance, a manufacturing enterprise implementing a private 5G network for factory automation relies on this architecture to achieve the ultra-low latency necessary for controlling autonomous guided vehicles and real-time quality control systems, a use case that is impossible with legacy network designs.
  • The market's trajectory is defined by this balance between profound economic and technological benefits and the complex operational realities of deploying a disaggregated, software-defined network.

What will be the Size of the Cloud Radio Access Network Market during the forecast period?

Get Key Insights on Market Forecast (PDF) Request Free Sample

How is the Cloud Radio Access Network Market Segmented?

The cloud radio access network industry research report provides comprehensive data (region-wise segment analysis), with forecasts and estimates in "USD million" for the period 2026-2030, as well as historical data from 2020-2024 for the following segments.

  • Connectivity
    • 4G and LTE
    • 5G
    • 2G and 3G
    • Others
  • Type
    • Centralised RAN
    • Virtualised RAN
    • Open RAN
    • Hybrid cloud RAN
  • Component
    • Solution
    • Services
  • Geography
    • APAC
      • China
      • Japan
      • India
    • North America
      • US
      • Canada
      • Mexico
    • Europe
      • Germany
      • UK
      • France
    • Middle East and Africa
      • Saudi Arabia
      • UAE
      • South Africa
    • South America
      • Brazil
      • Argentina
      • Colombia
    • Rest of World (ROW)

By Connectivity Insights

The 4g and lte segment is estimated to witness significant growth during the forecast period.

The 4G and LTE segment remains a critical area for ran modernization. Operators are implementing a software-defined ran on a cloud-native architecture to virtualize baseband unit functions, ensuring carrier-grade performance as part of their telco digital transformation.

This approach, often a single ran deployment, uses commercial off-the-shelf servers to create a scalable foundation for a smooth 5G network evolution.

Centralizing processing with a virtualized baseband unit not only enhances dynamic resource allocation but also enables a significant total cost of ownership reduction.

This strategic shift prepares existing infrastructure for future demands, such as industrial automation connectivity, reducing operational resolution times by up to 25% and boosting overall network management efficiency.

Request Free Sample

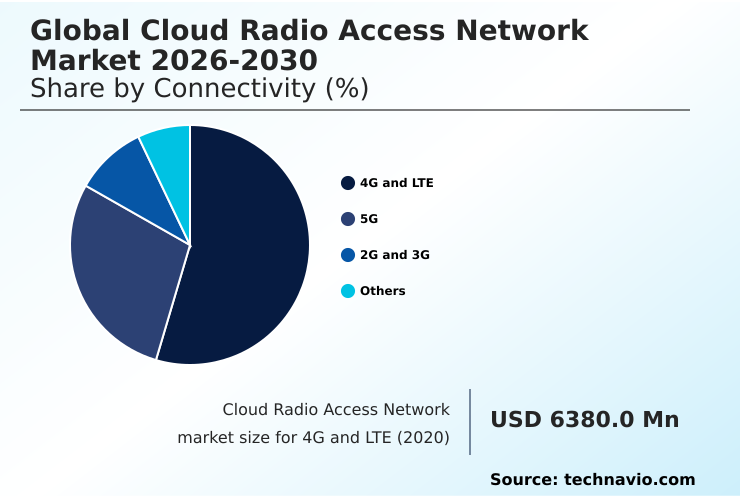
The 4G and LTE segment was valued at USD 9.72 billion in 2024 and showed a gradual increase during the forecast period.

Request Free Sample

Regional Analysis

APAC is estimated to contribute 33.8% to the growth of the global market during the forecast period.Technavio’s analysts have elaborately explained the regional trends and drivers that shape the market during the forecast period.

See How Cloud Radio Access Network Market Demand is Rising in APAC Request Free Sample

The geographic landscape is diverse, with APAC leading via deployments demonstrating a 35% total cost of ownership reduction. North America is driven by supply chain resilience and software-defined networking for flexibility.

European operators focus on energy efficient networking, with trials showing a 20% improvement in spectral efficiency. These regions are exploring dynamic spectrum sharing using both non-real-time ric and near-real-time ric for optimization.

In the Middle East, smart city projects demand massive mimo antenna systems to support vehicle-to-everything communication. Africa leverages baseband function virtualization for cost-effective coverage.

Across all regions, zero-touch network automation and digital twin simulation are becoming essential for managing these complex networks.

Market Dynamics

Our researchers analyzed the data with 2025 as the base year, along with the key drivers, trends, and challenges. A holistic analysis of drivers will help companies refine their marketing strategies to gain a competitive advantage.

  • The evolution of the Cloud Radio Access Network Market is defined by a complex interplay of technical hurdles and advanced solutions. Key among these are the significant c-ran fronthaul bandwidth requirements, which operators must address to support high-capacity services. This is compounded by open ran multi-vendor integration challenges, where ensuring seamless interoperability is paramount.
  • A major focus for operators is validating vran performance vs traditional ran, a process often supported by hardware accelerators for vran optimization to handle intensive workloads. The business case is strengthened by the introduction of ai for ran energy efficiency management and the use of the ric for dynamic spectrum sharing, which optimizes network resources in real time.
  • These capabilities are critical for emerging use cases, from private 5g for smart manufacturing to low latency applications with mec. As the architecture matures, security in virtualized ran environments becomes a top priority, requiring new strategies to protect disaggregated components.
  • Early adopters of AI for RAN energy efficiency report a reduction in power consumption that is twice that of those using static power-saving modes. Ultimately, these developments represent the evolution from c-ran to 6g architecture, where networks will be fully automated and intelligent, driving the future of connectivity.
  • Key strategies include automating c-ran lifecycle management, managing latency in c-ran deployments, and conducting thorough TCO analysis of vran vs dran. This transition is also influenced by the role of hyperscalers in c-ran and the need for robust cloud-native ran orchestration strategies.

What are the key market drivers leading to the rise in the adoption of Cloud Radio Access Network Industry?

  • Economic imperatives, particularly the significant reduction in total cost of ownership (TCO) for mobile network operators, serve as a primary driver for the global adoption of Cloud Radio Access Network architectures.

  • Economic imperatives are a core driver, with the network disaggregation strategy enabling significant efficiencies through improved service management and orchestration. By moving to centralized baseband processing on a telco cloud platform, operators achieve vendor diversification and greater supply chain resilience.
  • This shift away from purpose-built hardware toward virtualized network functions on a common network function virtualization infrastructure allows for energy savings up to 50%.
  • The move toward an open ecosystem fosters competition, critical for enabling advanced features like coordinated multipoint transmission. This improves cell-edge performance by over 20% and supports demanding use cases from cloud gaming optimization to autonomous mobility infrastructure.

What are the market trends shaping the Cloud Radio Access Network Industry?

  • The convergence of Cloud Radio Access Network (C-RAN) and Multi-Access Edge Computing (MEC) is a defining market trend. This synergy transforms the network edge into a distributed cloud environment for low-latency applications.

  • A defining trend is deep convergence with multi-access edge computing, transforming the network edge into a distributed cloud for immersive extended reality support. This fusion enables new low-latency services, with some deployments reducing round-trip time by 75%. Concurrently, the proliferation of neutral host deployments and private 5g networks, connected via a fronthaul gateway, is expanding the market.
  • The integration of ai-driven orchestration through the ran intelligent controller and its xapps and rapps is pivotal for intelligent ran automation. This allows for ue-centric traffic steering based on real-time radio protocols and predictive network maintenance, which reduces service-impacting faults by over 40%. The ecosystem is moving toward o-ran alliance standards to drive innovation across these models.

What challenges does the Cloud Radio Access Network Industry face during its growth?

  • Stringent fronthaul network requirements, including massive bandwidth demands and ultra-low latency constraints, present a formidable technical and economic challenge affecting industry growth.

  • Technical hurdles present significant challenges, especially the fronthaul latency budget required by the common public radio interface, where a single site can demand over 25 Gbps. Limited fronthaul fiber availability constrains deployments. Another challenge is the system integration complexity of connecting a radio unit (ru) to a distributed unit (du) and centralized unit (cu) from different vendors.
  • This can increase initial testing efforts by over 50%. Operators are now responsible for performance parity assurance between open vran solutions and traditional systems, sometimes requiring hardware accelerator cards. This operational model transformation demands new skills to manage disaggregated network components and a different network security posture.

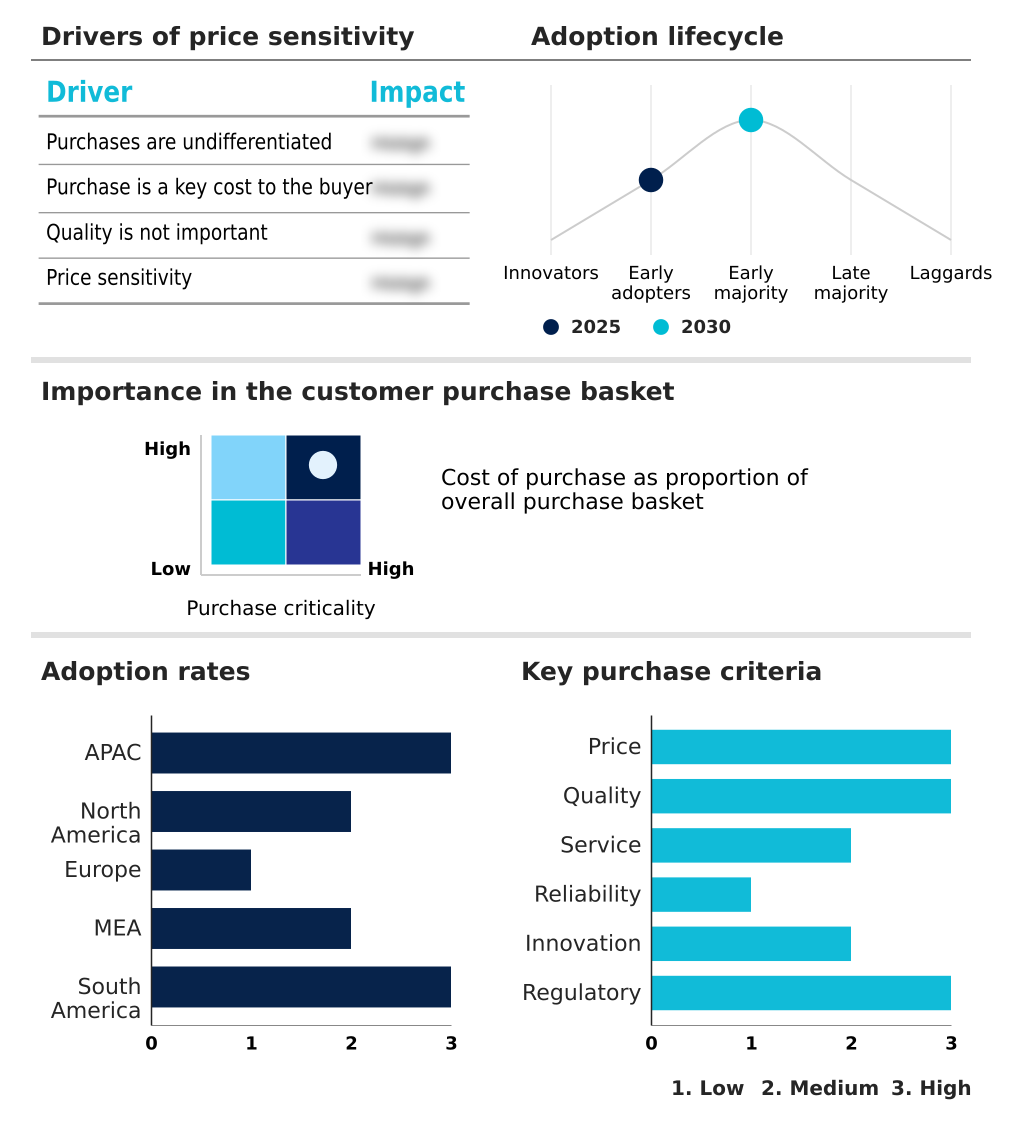
Exclusive Technavio Analysis on Customer Landscape

The cloud radio access network market forecasting report includes the adoption lifecycle of the market, covering from the innovator’s stage to the laggard’s stage. It focuses on adoption rates in different regions based on penetration. Furthermore, the cloud radio access network market report also includes key purchase criteria and drivers of price sensitivity to help companies evaluate and develop their market growth analysis strategies.

Customer Landscape of Cloud Radio Access Network Industry

Competitive Landscape

Companies are implementing various strategies, such as strategic alliances, cloud radio access network market forecast, partnerships, mergers and acquisitions, geographical expansion, and product/service launches, to enhance their presence in the industry.

6WIND SAS - Offers an AI-powered cloud RAN with a RAN Intelligent Controller, enabling xApps/rApps for real-time optimization, energy savings, and UE-centric traffic steering to boost network efficiency.

The industry research and growth report includes detailed analyses of the competitive landscape of the market and information about key companies, including:

  • 6WIND SAS
  • Airspan Networks Inc.
  • Anritsu Corp.
  • Capgemini Service SAS
  • CommScope Holding
  • Dell Technologies Inc.
  • EXFO Inc.
  • Fujitsu Ltd.
  • Hewlett Packard
  • Huawei Technologies Co. Ltd.
  • Intel Corp.
  • NEC Corp.
  • Nokia Corp.
  • Parallel Wireless Inc.
  • Radisys Corp.
  • Rakuten Group Inc.
  • Samsung Electronics Co. Ltd.
  • Telefonaktiebolaget Ericsson
  • Viavi Solutions Inc.
  • ZTE Corp.

Qualitative and quantitative analysis of companies has been conducted to help clients understand the wider business environment as well as the strengths and weaknesses of key industry players. Data is qualitatively analyzed to categorize companies as pure play, category-focused, industry-focused, and diversified; it is quantitatively analyzed to categorize companies as dominant, leading, strong, tentative, and weak.

Recent Development and News in Cloud radio access network market

  • In September 2024, a major US telecom operator announces a strategic partnership with a hyperscale cloud provider to deploy distributed cloud edge solutions at its network locations, aiming to virtualize RAN functions and accelerate the rollout of network-as-a-service offerings.
  • In November 2024, a leading European network equipment provider unveils its next-generation Cloud RAN software, incorporating native AI for real-time resource orchestration and achieving a 15% reduction in energy consumption in extensive trial environments.
  • In February 2025, a prominent IT infrastructure company announces the acquisition of a specialized Open RAN software firm for approximately USD 800 million, a move designed to strengthen its portfolio of end-to-end virtualized network solutions.
  • In April 2025, the European Commission, in collaboration with several member states, launches a EUR 500 million fund to fast-track the development and deployment of secure, multi-vendor Open RAN technologies across the continent.

Dive into Technavio’s robust research methodology, blending expert interviews, extensive data synthesis, and validated models for unparalleled Cloud Radio Access Network Market insights. See full methodology.

Market Scope
Page number 312
Base year 2025
Historic period 2020-2024
Forecast period 2026-2030
Growth momentum & CAGR Accelerate at a CAGR of 20%
Market growth 2026-2030 USD 30602.8 million
Market structure Fragmented
YoY growth 2025-2026(%) 16.7%
Key countries China, Japan, India, South Korea, Australia, Indonesia, US, Canada, Mexico, Germany, UK, France, Italy, The Netherlands, Spain, Saudi Arabia, UAE, South Africa, Israel, Turkey, Brazil, Argentina and Colombia
Competitive landscape Leading Companies, Market Positioning of Companies, Competitive Strategies, and Industry Risks

Request Free Sample

Research Analyst Overview

  • The market represents a fundamental architectural shift, defined by the adoption of virtualized network functions running on commercial off-the-shelf servers. This model of baseband function virtualization connects remote radio heads over a high-capacity fronthaul transport network, enabling advanced capabilities like coordinated multipoint transmission and massive mimo antenna systems to ensure carrier-grade performance.
  • Central to this evolution is the ran intelligent controller, featuring both non-real-time ric and near-real-time ric components that host xapps and rapps for ai-driven orchestration. This technology presents a critical boardroom decision: whether to invest in developing proprietary applications for ue-centric traffic steering or leverage an open ecosystem, impacting R&D budgets and service deployment agility.
  • Deployments leveraging this software-defined ran and its predictive network maintenance capabilities have demonstrated the ability to provision new network slices in hours, a process that previously took weeks, representing over a 95% reduction in service deployment time. This highlights the move towards a more flexible and automated operational model based on telco cloud platforms.

What are the Key Data Covered in this Cloud Radio Access Network Market Research and Growth Report?

  • What is the expected growth of the Cloud Radio Access Network Market between 2026 and 2030?

    • USD 30.60 billion, at a CAGR of 20%

  • What segmentation does the market report cover?

    • The report is segmented by Connectivity (4G and LTE, 5G, 2G and 3G, and Others), Type (Centralised RAN, Virtualised RAN, Open RAN, and Hybrid cloud RAN), Component (Solution, and Services) and Geography (APAC, North America, Europe, Middle East and Africa, South America)

  • Which regions are analyzed in the report?

    • APAC, North America, Europe, Middle East and Africa and South America

  • What are the key growth drivers and market challenges?

    • Economic imperatives and total cost of ownership reduction, Fronthaul network requirements and latency constraints

  • Who are the major players in the Cloud Radio Access Network Market?

    • 6WIND SAS, Airspan Networks Inc., Anritsu Corp., Capgemini Service SAS, CommScope Holding, Dell Technologies Inc., EXFO Inc., Fujitsu Ltd., Hewlett Packard, Huawei Technologies Co. Ltd., Intel Corp., NEC Corp., Nokia Corp., Parallel Wireless Inc., Radisys Corp., Rakuten Group Inc., Samsung Electronics Co. Ltd., Telefonaktiebolaget Ericsson, Viavi Solutions Inc. and ZTE Corp.

Market Research Insights

  • The market is characterized by a dynamic shift toward software-defined networking and disaggregated architectures. This evolution is enabling new business models such as neutral host deployments and private 5G networks, with enterprise adoption of the latter showing a 40% improvement in operational automation.
  • The drive for intelligent RAN automation is pushing the industry toward zero-touch network automation, which reduces network configuration errors by over 60% compared to manual methods. This move toward an open ecosystem supports greater vendor diversification and accelerates innovation.
  • The entire operational model transformation is geared toward enhancing performance and reducing the total cost of ownership, making networks more agile and responsive to changing service demands.

We can help! Our analysts can customize this cloud radio access network market research report to meet your requirements.

Get in touch

1. Executive Summary

1.1 Market overview

Executive Summary - Chart on Market Overview
Executive Summary - Data Table on Market Overview
Executive Summary - Chart on Global Market Characteristics
Executive Summary - Chart on Market by Geography
Executive Summary - Chart on Market Segmentation by Connectivity
Executive Summary - Chart on Market Segmentation by Type
Executive Summary - Chart on Market Segmentation by Component
Executive Summary - Chart on Incremental Growth
Executive Summary - Data Table on Incremental Growth
Executive Summary - Chart on Company Market Positioning

2. Technavio Analysis

2.1 Analysis of price sensitivity, lifecycle, customer purchase basket, adoption rates, and purchase criteria

2.2 Criticality of inputs and Factors of differentiation

Chart on Overview on criticality of inputs and factors of differentiation

2.3 Factors of disruption

Chart on Overview on factors of disruption

2.4 Impact of drivers and challenges

Chart on Impact of drivers and challenges in 2025 and 2030

3. Market Landscape

3.1 Market ecosystem

Chart on Parent Market
Data Table on - Parent Market

3.2 Market characteristics

Chart on Market characteristics analysis

3.3 Value chain analysis

Chart on Value chain analysis

4. Market Sizing

4.1 Market definition

Data Table on Offerings of companies included in the market definition

4.2 Market segment analysis

Market segments

4.3 Market size 2025

4.4 Market outlook: Forecast for 2025-2030

Chart on Global - Market size and forecast 2025-2030 ($ million)
Data Table on Global - Market size and forecast 2025-2030 ($ million)
Chart on Global Market: Year-over-year growth 2025-2030 (%)
Data Table on Global Market: Year-over-year growth 2025-2030 (%)

5. Historic Market Size

5.1 Global Cloud Radio Access Network Market 2020 - 2024

Historic Market Size - Data Table on Global Cloud Radio Access Network Market 2020 - 2024 ($ million)

5.2 Connectivity segment analysis 2020 - 2024

Historic Market Size - Connectivity Segment 2020 - 2024 ($ million)

5.3 Type segment analysis 2020 - 2024

Historic Market Size - Type Segment 2020 - 2024 ($ million)

5.4 Component segment analysis 2020 - 2024

Historic Market Size - Component Segment 2020 - 2024 ($ million)

5.5 Geography segment analysis 2020 - 2024

Historic Market Size - Geography Segment 2020 - 2024 ($ million)

5.6 Country segment analysis 2020 - 2024

Historic Market Size - Country Segment 2020 - 2024 ($ million)

6. Qualitative Analysis

6.1 The AI impact on global cloud radio access network market

7. Five Forces Analysis

7.1 Five forces summary

Five forces analysis - Comparison between 2025 and 2030

7.2 Bargaining power of buyers

Bargaining power of buyers - Impact of key factors 2025 and 2030

7.3 Bargaining power of suppliers

Bargaining power of suppliers - Impact of key factors in 2025 and 2030

7.4 Threat of new entrants

Threat of new entrants - Impact of key factors in 2025 and 2030

7.5 Threat of substitutes

Threat of substitutes - Impact of key factors in 2025 and 2030

7.6 Threat of rivalry

Threat of rivalry - Impact of key factors in 2025 and 2030

7.7 Market condition

Chart on Market condition - Five forces 2025 and 2030

8. Market Segmentation by Connectivity

8.1 Market segments

Chart on Connectivity - Market share 2025-2030 (%)
Data Table on Connectivity - Market share 2025-2030 (%)

8.2 Comparison by Connectivity

Chart on Comparison by Connectivity
Data Table on Comparison by Connectivity

8.3 4G and LTE - Market size and forecast 2025-2030

Chart on 4G and LTE - Market size and forecast 2025-2030 ($ million)
Data Table on 4G and LTE - Market size and forecast 2025-2030 ($ million)
Chart on 4G and LTE - Year-over-year growth 2025-2030 (%)
Data Table on 4G and LTE - Year-over-year growth 2025-2030 (%)

8.4 5G - Market size and forecast 2025-2030

Chart on 5G - Market size and forecast 2025-2030 ($ million)
Data Table on 5G - Market size and forecast 2025-2030 ($ million)
Chart on 5G - Year-over-year growth 2025-2030 (%)
Data Table on 5G - Year-over-year growth 2025-2030 (%)

8.5 2G and 3G - Market size and forecast 2025-2030

Chart on 2G and 3G - Market size and forecast 2025-2030 ($ million)
Data Table on 2G and 3G - Market size and forecast 2025-2030 ($ million)
Chart on 2G and 3G - Year-over-year growth 2025-2030 (%)
Data Table on 2G and 3G - Year-over-year growth 2025-2030 (%)

8.6 Others - Market size and forecast 2025-2030

Chart on Others - Market size and forecast 2025-2030 ($ million)
Data Table on Others - Market size and forecast 2025-2030 ($ million)
Chart on Others - Year-over-year growth 2025-2030 (%)
Data Table on Others - Year-over-year growth 2025-2030 (%)

8.7 Market opportunity by Connectivity

Market opportunity by Connectivity ($ million)
Data Table on Market opportunity by Connectivity ($ million)

9. Market Segmentation by Type

9.1 Market segments

Chart on Type - Market share 2025-2030 (%)
Data Table on Type - Market share 2025-2030 (%)

9.2 Comparison by Type

Chart on Comparison by Type
Data Table on Comparison by Type

9.3 Centralised RAN - Market size and forecast 2025-2030

Chart on Centralised RAN - Market size and forecast 2025-2030 ($ million)
Data Table on Centralised RAN - Market size and forecast 2025-2030 ($ million)
Chart on Centralised RAN - Year-over-year growth 2025-2030 (%)
Data Table on Centralised RAN - Year-over-year growth 2025-2030 (%)

9.4 Virtualised RAN - Market size and forecast 2025-2030

Chart on Virtualised RAN - Market size and forecast 2025-2030 ($ million)
Data Table on Virtualised RAN - Market size and forecast 2025-2030 ($ million)
Chart on Virtualised RAN - Year-over-year growth 2025-2030 (%)
Data Table on Virtualised RAN - Year-over-year growth 2025-2030 (%)

9.5 Open RAN - Market size and forecast 2025-2030

Chart on Open RAN - Market size and forecast 2025-2030 ($ million)
Data Table on Open RAN - Market size and forecast 2025-2030 ($ million)
Chart on Open RAN - Year-over-year growth 2025-2030 (%)
Data Table on Open RAN - Year-over-year growth 2025-2030 (%)

9.6 Hybrid cloud RAN - Market size and forecast 2025-2030

Chart on Hybrid cloud RAN - Market size and forecast 2025-2030 ($ million)
Data Table on Hybrid cloud RAN - Market size and forecast 2025-2030 ($ million)
Chart on Hybrid cloud RAN - Year-over-year growth 2025-2030 (%)
Data Table on Hybrid cloud RAN - Year-over-year growth 2025-2030 (%)

9.7 Market opportunity by Type

Market opportunity by Type ($ million)
Data Table on Market opportunity by Type ($ million)

10. Market Segmentation by Component

10.1 Market segments

Chart on Component - Market share 2025-2030 (%)
Data Table on Component - Market share 2025-2030 (%)

10.2 Comparison by Component

Chart on Comparison by Component
Data Table on Comparison by Component

10.3 Solution - Market size and forecast 2025-2030

Chart on Solution - Market size and forecast 2025-2030 ($ million)
Data Table on Solution - Market size and forecast 2025-2030 ($ million)
Chart on Solution - Year-over-year growth 2025-2030 (%)
Data Table on Solution - Year-over-year growth 2025-2030 (%)

10.4 Services - Market size and forecast 2025-2030

Chart on Services - Market size and forecast 2025-2030 ($ million)
Data Table on Services - Market size and forecast 2025-2030 ($ million)
Chart on Services - Year-over-year growth 2025-2030 (%)
Data Table on Services - Year-over-year growth 2025-2030 (%)

10.5 Market opportunity by Component

Market opportunity by Component ($ million)
Data Table on Market opportunity by Component ($ million)

11. Customer Landscape

11.1 Customer landscape overview

Analysis of price sensitivity, lifecycle, customer purchase basket, adoption rates, and purchase criteria

12. Geographic Landscape

12.1 Geographic segmentation

Chart on Market share by geography 2025-2030 (%)
Data Table on Market share by geography 2025-2030 (%)

12.2 Geographic comparison

Chart on Geographic comparison
Data Table on Geographic comparison

12.3 APAC - Market size and forecast 2025-2030

Chart on APAC - Market size and forecast 2025-2030 ($ million)
Data Table on APAC - Market size and forecast 2025-2030 ($ million)
Chart on APAC - Year-over-year growth 2025-2030 (%)
Data Table on APAC - Year-over-year growth 2025-2030 (%)
Chart on Regional Comparison - APAC
Data Table on Regional Comparison - APAC

12.3.1 China - Market size and forecast 2025-2030

Chart on China - Market size and forecast 2025-2030 ($ million)
Data Table on China - Market size and forecast 2025-2030 ($ million)
Chart on China - Year-over-year growth 2025-2030 (%)
Data Table on China - Year-over-year growth 2025-2030 (%)

12.3.2 Japan - Market size and forecast 2025-2030

Chart on Japan - Market size and forecast 2025-2030 ($ million)
Data Table on Japan - Market size and forecast 2025-2030 ($ million)
Chart on Japan - Year-over-year growth 2025-2030 (%)
Data Table on Japan - Year-over-year growth 2025-2030 (%)

12.3.3 India - Market size and forecast 2025-2030

Chart on India - Market size and forecast 2025-2030 ($ million)
Data Table on India - Market size and forecast 2025-2030 ($ million)
Chart on India - Year-over-year growth 2025-2030 (%)
Data Table on India - Year-over-year growth 2025-2030 (%)

12.3.4 South Korea - Market size and forecast 2025-2030

Chart on South Korea - Market size and forecast 2025-2030 ($ million)
Data Table on South Korea - Market size and forecast 2025-2030 ($ million)
Chart on South Korea - Year-over-year growth 2025-2030 (%)
Data Table on South Korea - Year-over-year growth 2025-2030 (%)

12.3.5 Australia - Market size and forecast 2025-2030

Chart on Australia - Market size and forecast 2025-2030 ($ million)
Data Table on Australia - Market size and forecast 2025-2030 ($ million)
Chart on Australia - Year-over-year growth 2025-2030 (%)
Data Table on Australia - Year-over-year growth 2025-2030 (%)

12.3.6 Indonesia - Market size and forecast 2025-2030

Chart on Indonesia - Market size and forecast 2025-2030 ($ million)
Data Table on Indonesia - Market size and forecast 2025-2030 ($ million)
Chart on Indonesia - Year-over-year growth 2025-2030 (%)
Data Table on Indonesia - Year-over-year growth 2025-2030 (%)

12.4 North America - Market size and forecast 2025-2030

Chart on North America - Market size and forecast 2025-2030 ($ million)
Data Table on North America - Market size and forecast 2025-2030 ($ million)
Chart on North America - Year-over-year growth 2025-2030 (%)
Data Table on North America - Year-over-year growth 2025-2030 (%)
Chart on Regional Comparison - North America
Data Table on Regional Comparison - North America

12.4.1 US - Market size and forecast 2025-2030

Chart on US - Market size and forecast 2025-2030 ($ million)
Data Table on US - Market size and forecast 2025-2030 ($ million)
Chart on US - Year-over-year growth 2025-2030 (%)
Data Table on US - Year-over-year growth 2025-2030 (%)

12.4.2 Canada - Market size and forecast 2025-2030

Chart on Canada - Market size and forecast 2025-2030 ($ million)
Data Table on Canada - Market size and forecast 2025-2030 ($ million)
Chart on Canada - Year-over-year growth 2025-2030 (%)
Data Table on Canada - Year-over-year growth 2025-2030 (%)

12.4.3 Mexico - Market size and forecast 2025-2030

Chart on Mexico - Market size and forecast 2025-2030 ($ million)
Data Table on Mexico - Market size and forecast 2025-2030 ($ million)
Chart on Mexico - Year-over-year growth 2025-2030 (%)
Data Table on Mexico - Year-over-year growth 2025-2030 (%)

12.5 Europe - Market size and forecast 2025-2030

Chart on Europe - Market size and forecast 2025-2030 ($ million)
Data Table on Europe - Market size and forecast 2025-2030 ($ million)
Chart on Europe - Year-over-year growth 2025-2030 (%)
Data Table on Europe - Year-over-year growth 2025-2030 (%)
Chart on Regional Comparison - Europe
Data Table on Regional Comparison - Europe

12.5.1 Germany - Market size and forecast 2025-2030

Chart on Germany - Market size and forecast 2025-2030 ($ million)
Data Table on Germany - Market size and forecast 2025-2030 ($ million)
Chart on Germany - Year-over-year growth 2025-2030 (%)
Data Table on Germany - Year-over-year growth 2025-2030 (%)

12.5.2 UK - Market size and forecast 2025-2030

Chart on UK - Market size and forecast 2025-2030 ($ million)
Data Table on UK - Market size and forecast 2025-2030 ($ million)
Chart on UK - Year-over-year growth 2025-2030 (%)
Data Table on UK - Year-over-year growth 2025-2030 (%)

12.5.3 France - Market size and forecast 2025-2030

Chart on France - Market size and forecast 2025-2030 ($ million)
Data Table on France - Market size and forecast 2025-2030 ($ million)
Chart on France - Year-over-year growth 2025-2030 (%)
Data Table on France - Year-over-year growth 2025-2030 (%)

12.5.4 Italy - Market size and forecast 2025-2030

Chart on Italy - Market size and forecast 2025-2030 ($ million)
Data Table on Italy - Market size and forecast 2025-2030 ($ million)
Chart on Italy - Year-over-year growth 2025-2030 (%)
Data Table on Italy - Year-over-year growth 2025-2030 (%)

12.5.5 The Netherlands - Market size and forecast 2025-2030

Chart on The Netherlands - Market size and forecast 2025-2030 ($ million)
Data Table on The Netherlands - Market size and forecast 2025-2030 ($ million)
Chart on The Netherlands - Year-over-year growth 2025-2030 (%)
Data Table on The Netherlands - Year-over-year growth 2025-2030 (%)

12.5.6 Spain - Market size and forecast 2025-2030

Chart on Spain - Market size and forecast 2025-2030 ($ million)
Data Table on Spain - Market size and forecast 2025-2030 ($ million)
Chart on Spain - Year-over-year growth 2025-2030 (%)
Data Table on Spain - Year-over-year growth 2025-2030 (%)

12.6 Middle East and Africa - Market size and forecast 2025-2030

Chart on Middle East and Africa - Market size and forecast 2025-2030 ($ million)
Data Table on Middle East and Africa - Market size and forecast 2025-2030 ($ million)
Chart on Middle East and Africa - Year-over-year growth 2025-2030 (%)
Data Table on Middle East and Africa - Year-over-year growth 2025-2030 (%)
Chart on Regional Comparison - Middle East and Africa
Data Table on Regional Comparison - Middle East and Africa

12.6.1 Saudi Arabia - Market size and forecast 2025-2030

Chart on Saudi Arabia - Market size and forecast 2025-2030 ($ million)
Data Table on Saudi Arabia - Market size and forecast 2025-2030 ($ million)
Chart on Saudi Arabia - Year-over-year growth 2025-2030 (%)
Data Table on Saudi Arabia - Year-over-year growth 2025-2030 (%)

12.6.2 UAE - Market size and forecast 2025-2030

Chart on UAE - Market size and forecast 2025-2030 ($ million)
Data Table on UAE - Market size and forecast 2025-2030 ($ million)
Chart on UAE - Year-over-year growth 2025-2030 (%)
Data Table on UAE - Year-over-year growth 2025-2030 (%)

12.6.3 South Africa - Market size and forecast 2025-2030

Chart on South Africa - Market size and forecast 2025-2030 ($ million)
Data Table on South Africa - Market size and forecast 2025-2030 ($ million)
Chart on South Africa - Year-over-year growth 2025-2030 (%)
Data Table on South Africa - Year-over-year growth 2025-2030 (%)

12.6.4 Israel - Market size and forecast 2025-2030

Chart on Israel - Market size and forecast 2025-2030 ($ million)
Data Table on Israel - Market size and forecast 2025-2030 ($ million)
Chart on Israel - Year-over-year growth 2025-2030 (%)
Data Table on Israel - Year-over-year growth 2025-2030 (%)

12.6.5 Turkey - Market size and forecast 2025-2030

Chart on Turkey - Market size and forecast 2025-2030 ($ million)
Data Table on Turkey - Market size and forecast 2025-2030 ($ million)
Chart on Turkey - Year-over-year growth 2025-2030 (%)
Data Table on Turkey - Year-over-year growth 2025-2030 (%)

12.7 South America - Market size and forecast 2025-2030

Chart on South America - Market size and forecast 2025-2030 ($ million)
Data Table on South America - Market size and forecast 2025-2030 ($ million)
Chart on South America - Year-over-year growth 2025-2030 (%)
Data Table on South America - Year-over-year growth 2025-2030 (%)
Chart on Regional Comparison - South America
Data Table on Regional Comparison - South America

12.7.1 Brazil - Market size and forecast 2025-2030

Chart on Brazil - Market size and forecast 2025-2030 ($ million)
Data Table on Brazil - Market size and forecast 2025-2030 ($ million)
Chart on Brazil - Year-over-year growth 2025-2030 (%)
Data Table on Brazil - Year-over-year growth 2025-2030 (%)

12.7.2 Argentina - Market size and forecast 2025-2030

Chart on Argentina - Market size and forecast 2025-2030 ($ million)
Data Table on Argentina - Market size and forecast 2025-2030 ($ million)
Chart on Argentina - Year-over-year growth 2025-2030 (%)
Data Table on Argentina - Year-over-year growth 2025-2030 (%)

12.7.3 Colombia - Market size and forecast 2025-2030

Chart on Colombia - Market size and forecast 2025-2030 ($ million)
Data Table on Colombia - Market size and forecast 2025-2030 ($ million)
Chart on Colombia - Year-over-year growth 2025-2030 (%)
Data Table on Colombia - Year-over-year growth 2025-2030 (%)

12.8 Market opportunity by geography

Market opportunity by geography ($ million)
Data Tables on Market opportunity by geography ($ million)

13. Drivers, Challenges, and Opportunity

13.1 Market drivers

Economic imperatives and total cost of ownership reduction
Enabling 5G advanced capabilities and future network evolution
Strategic shift towards open ecosystems and company diversification

13.2 Market challenges

Fronthaul network requirements and latency constraints
System integration complexity and multi-company interoperability
Performance parity and operational maturity

13.3 Impact of drivers and challenges

Impact of drivers and challenges in 2025 and 2030

13.4 Market opportunities

Convergence of C-RAN and multi-access edge computing
Integration of artificial intelligence for intelligent RAN automation
Proliferation of neutral host and enterprise private networks

14. Competitive Landscape

14.1 Overview

14.2

Overview on criticality of inputs and factors of differentiation

14.3 Landscape disruption

Overview on factors of disruption

14.4 Industry risks

Impact of key risks on business

15. Competitive Analysis

15.1 Companies profiled

Companies covered

15.2 Company ranking index

15.3 Market positioning of companies

Matrix on companies position and classification

15.4 Capgemini Service SAS

Capgemini Service SAS - Overview
Capgemini Service SAS - Business segments
Capgemini Service SAS - Key news
Capgemini Service SAS - Key offerings
Capgemini Service SAS - Segment focus
SWOT

15.5 CommScope Holding

CommScope Holding - Overview
CommScope Holding - Business segments
CommScope Holding - Key news
CommScope Holding - Key offerings
CommScope Holding - Segment focus
SWOT

15.6 Dell Technologies Inc.

Dell Technologies Inc. - Overview
Dell Technologies Inc. - Business segments
Dell Technologies Inc. - Key news
Dell Technologies Inc. - Key offerings
Dell Technologies Inc. - Segment focus
SWOT

15.7 Fujitsu Ltd.

Fujitsu Ltd. - Overview
Fujitsu Ltd. - Business segments
Fujitsu Ltd. - Key news
Fujitsu Ltd. - Key offerings
Fujitsu Ltd. - Segment focus
SWOT

15.8 Hewlett Packard

Hewlett Packard - Overview
Hewlett Packard - Business segments
Hewlett Packard - Key news
Hewlett Packard - Key offerings
Hewlett Packard - Segment focus
SWOT

15.9 Huawei Technologies Co. Ltd.

Huawei Technologies Co. Ltd. - Overview
Huawei Technologies Co. Ltd. - Product / Service
Huawei Technologies Co. Ltd. - Key news
Huawei Technologies Co. Ltd. - Key offerings
SWOT

15.10 Intel Corp.

Intel Corp. - Overview
Intel Corp. - Business segments
Intel Corp. - Key news
Intel Corp. - Key offerings
Intel Corp. - Segment focus
SWOT

15.11 NEC Corp.

NEC Corp. - Overview
NEC Corp. - Business segments
NEC Corp. - Key news
NEC Corp. - Key offerings
NEC Corp. - Segment focus
SWOT

15.12 Nokia Corp.

Nokia Corp. - Overview
Nokia Corp. - Business segments
Nokia Corp. - Key news
Nokia Corp. - Key offerings
Nokia Corp. - Segment focus
SWOT

15.13 Parallel Wireless Inc.

Parallel Wireless Inc. - Overview
Parallel Wireless Inc. - Product / Service
Parallel Wireless Inc. - Key offerings
SWOT

15.14 Radisys Corp.

Radisys Corp. - Overview
Radisys Corp. - Product / Service
Radisys Corp. - Key offerings
SWOT

15.15 Samsung Electronics Co. Ltd.

Samsung Electronics Co. Ltd. - Overview
Samsung Electronics Co. Ltd. - Business segments
Samsung Electronics Co. Ltd. - Key news
Samsung Electronics Co. Ltd. - Key offerings
Samsung Electronics Co. Ltd. - Segment focus
SWOT

15.16 Telefonaktiebolaget Ericsson

Telefonaktiebolaget Ericsson - Overview
Telefonaktiebolaget Ericsson - Business segments
Telefonaktiebolaget Ericsson - Key news
Telefonaktiebolaget Ericsson - Key offerings
Telefonaktiebolaget Ericsson - Segment focus
SWOT

15.17 Viavi Solutions Inc.

Viavi Solutions Inc. - Overview
Viavi Solutions Inc. - Business segments
Viavi Solutions Inc. - Key news
Viavi Solutions Inc. - Key offerings
Viavi Solutions Inc. - Segment focus
SWOT

15.18 ZTE Corp.

ZTE Corp. - Overview
ZTE Corp. - Business segments
ZTE Corp. - Key offerings
ZTE Corp. - Segment focus
SWOT

16. Appendix

16.1 Scope of the report

Market definition
Objectives
Notes and caveats

16.2 Inclusions and exclusions checklist

Inclusions checklist
Exclusions checklist

16.3 Currency conversion rates for US$

16.4 Research methodology

16.5 Data procurement

Information sources

16.6 Data validation

16.7 Validation techniques employed for market sizing

16.8 Data synthesis

16.9 360 degree market analysis

16.10 List of abbreviations

Research Methodology

Technavio presents a detailed picture of the market by way of study, synthesis, and summation of data from multiple sources. The analysts have presented the various facets of the market with a particular focus on identifying the key industry influencers. The data thus presented is comprehensive, reliable, and the result of extensive research, both primary and secondary.

INFORMATION SOURCES

Primary sources

  • Manufacturers and suppliers
  • Channel partners
  • Industry experts
  • Strategic decision makers

Secondary sources

  • Industry journals and periodicals
  • Government data
  • Financial reports of key industry players
  • Historical data
  • Press releases

DATA ANALYSIS

Data Synthesis

  • Collation of data
  • Estimation of key figures
  • Analysis of derived insights

Data Validation

  • Triangulation with data models
  • Reference against proprietary databases
  • Corroboration with industry experts

REPORT WRITING

Qualitative

  • Market drivers
  • Market challenges
  • Market trends
  • Five forces analysis

Quantitative

  • Market size and forecast
  • Market segmentation
  • Geographical insights
  • Competitive landscape

Interested in this report?

Get your sample now to see our research methodology and insights!

Download Now

Frequently Asked Questions

Cloud Radio Access Network market growth will increase by USD 30602.8 million during 2026-2030 .

The Cloud Radio Access Network market is expected to grow at a CAGR of 20% during 2026-2030 .

Cloud Radio Access Network market is segmented by Connectivity (4G and LTE, 5G, 2G and 3G, Others) Type (Centralised RAN, Virtualised RAN, Open RAN, Hybrid cloud RAN) Component (Solution, Services)

6WIND SAS, Airspan Networks Inc., Anritsu Corp., Capgemini Service SAS, CommScope Holding, Dell Technologies Inc., EXFO Inc., Fujitsu Ltd., Hewlett Packard, Huawei Technologies Co. Ltd., Intel Corp., NEC Corp., Nokia Corp., Parallel Wireless Inc., Radisys Corp., Rakuten Group Inc., Samsung Electronics Co. Ltd., Telefonaktiebolaget Ericsson, Viavi Solutions Inc., ZTE Corp. are a few of the key vendors in the Cloud Radio Access Network market.

APAC will register the highest growth rate of 33.8% among the other regions. Therefore, the Cloud Radio Access Network market in APAC is expected to garner significant business opportunities for the vendors during the forecast period.

China, Japan, India, South Korea, Australia, Indonesia, US, Canada, Mexico, Germany, UK, France, Italy, The Netherlands, Spain, Saudi Arabia, UAE, South Africa, Israel, Turkey, Brazil, Argentina, Colombia

  • Economic imperatives and total cost of ownership reduction is the driving factor this market.

The Cloud Radio Access Network market vendors should focus on grabbing business opportunities from the Connectivity segment as it accounted for the largest market share in the base year.