Coal Gasification Market Analysis APAC, Middle East and Africa, North America, Europe, South America - US, South Africa, China, Australia, Indonesia - Size and Forecast 2024-2028

Coal Gasification Market Analysis APAC, Middle East and Africa, North America, Europe, South America - US, South Africa, China, Australia, Indonesia - Size and Forecast 2024-2028

Published: Nov 2023 174 Pages SKU: IRTNTR70736

Market Overview at a Glance

$14.02 B
Market Opportunity
16.25%
CAGR
15.75
YoY growth 2023-2024(%)

Coal Gasification Market Size 2024-2028 

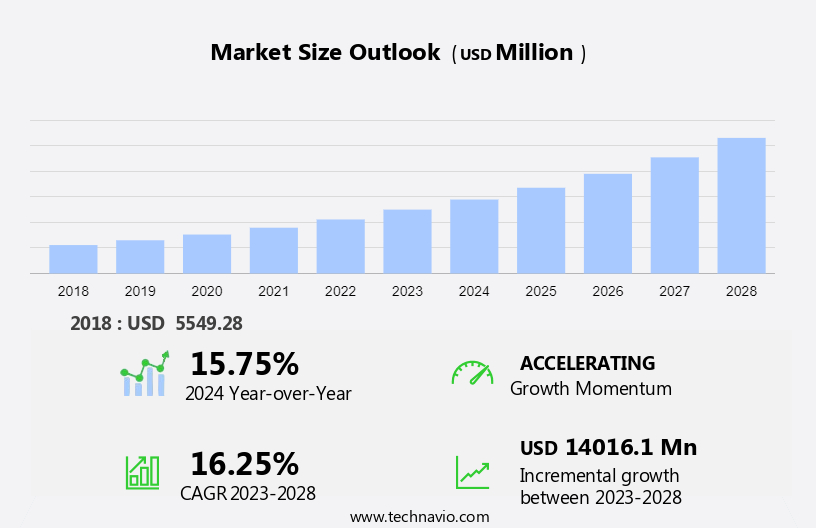
The coal gasification market size is forecast to increase by USD 14.01 billion at a CAGR of 16.25% between 2023 and 2028. The market is experiencing significant growth due to several key drivers. The rise in global energy demand, particularly in emerging economies, is a major factor fueling market growth. Additionally, the increase in global coal production, especially from countries like China, India, and Australia, is providing an abundant supply of raw material for coal gasification.

However, environmental concerns surrounding coal gasification, including carbon emissions and water usage, pose challenges to market growth. To mitigate these challenges, advancements in clean coal technology and carbon capture, utilization, and storage (CCUS) are being explored to make coal gasification a more sustainable and eco-friendly energy solution.Overall, the market is expected to witness steady growth in the coming years as it provides a viable solution to meet the increasing energy demands while addressing environmental concerns.

What will be the size of the Coal Gasification Market During the Forecast Period?

Coal Gasification Market Size

 Request Free Sample

The market is witnessing significant growth due to the increasing demand for syngas, which is a key product of coal gasification. Syngas, a mixture of hydrogen, carbon monoxide, methane, and other gases, is used for power generation, fuel gas production, and the production of synthetic natural gas, ammonia, and fertilizers. Gasification technologies, including moving bed, fluidized bed, and entrained bed, are used for coal gasification. These technologies help reduce the environmental impact by minimizing the emission of sulfur dioxide, particulate matter, and other pollutants. Coal gasification also produces carbon dioxide and water vapour as by-products, which can be utilized for various applications such as enhanced oil recovery and carbon capture and storage.

The use of clean hydrogen and oxygen instead of air in the gasification process further reduces the emission of pollutants. Underground coal gasification is another emerging technology in the market, which offers several advantages such as lower capital and operating costs and the ability to gasify low-rank coals. However, the challenges associated with the safe and efficient operation of underground gasifiers remain a significant barrier to the widespread adoption of this technology. In summary, the market is expected to grow due to the increasing demand for clean energy, low-cost feedstocks, and the production of value-added products such as hydrogen, ammonia, and fertilizers.However, the environmental impact of coal gasification and the challenges associated with the safe and efficient operation of gasifiers remain key concerns.

Market Segmentation

The market research report provides comprehensive data (region-wise segment analysis), with forecasts and estimates in "USD Billion" for the period 2024-2028, as well as historical data from 2018 - 2022 for the following segments.

  • Application
    • Chemicals
    • Fuels
    • Power
  • Type
    • Moving bed
    • Fluidized bed
    • Entrained bed
    • Molten bed
  • Geography
    • APAC
      • China
    • Middle East and Africa
      • South Africa
    • North America
      • US
    • Europe
    • South America

By Application Insights

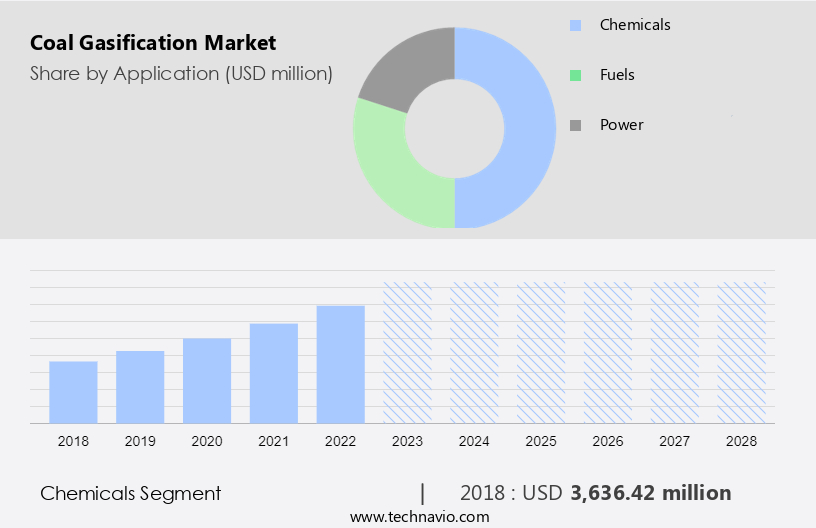
The chemicals segment is estimated to witness significant growth during the forecast period. The market encompasses various gasification technologies, including fixed bed, fluidized bed, and entrained flow, for the production of Syngas, a mixture of CO, H2, CO2, and water vapor, from coal. This process is essential for the generation of clean hydrogen, electricity, and chemicals, such as methanol, ammonia, and urea. However, coal gasification also produces sulfur dioxide and particulate matter, which require proper treatment to minimize environmental impact. Underground Coal Gasification (UCG) is a promising alternative to conventional gasification, as it addresses water scarcity concerns by utilizing coal and water in the absence of air or oxygen. UCG also offers the potential for fuel gas production, synthetic natural gas, and the generation of chemicals like methanol, ammonia, and hydrogen.

Gasification technologies, such as Fluidized Bed Gasifiers, are employed in coal-to-methanol and coal-to-chemicals projects, which convert coal into valuable chemicals, reducing reliance on traditional fossil fuels. Coal reserves remain abundant, making them a viable and cost-effective feedstock for various industries, including electricity generation, steel production, and hydrogen generation. Carbon Monoxide, Hydrogen, Carbon Dioxide, and Methane are key components of Syngas, which can be utilized in various applications, such as power generation, ammonia production, and nitrogen manufacturing. The environmental impact of coal gasification is a critical concern, with the production of CO2 and the need for proper treatment of SO2 and particulate matter.

However, the potential for low-cost feedstocks and the generation of clean energy make coal gasification an attractive option for industries seeking sustainable and cost-effective solutions.

Coal Gasification Market Size

Get a glance at the market share of various segments Request Free Sample

The Chemicals segment accounted for USD 3.63 billion in 2018 and showed a gradual increase during the forecast period.

Regional Insights

APAC is estimated to contribute 78% to the growth of the global market during the forecast period. Technavio's analysts have elaborately explained the regional trends and drivers that shape the market during the forecast period.

Coal Gasification Market Share by Geography

For more insights on the market share of various regions Request Free Sample

Coal gasification is an essential energy generation technology that converts coal into a cleaner fuel source through a process called gasification. This technique involves the partial oxidation of coal in an oxygen-deficient environment, resulting in the production of producer gas or syngas, which is devoid of tar and other impurities. The calorific value of this fuel gas is significantly higher than that of coal, making it a viable alternative for various applications, including household uses and industrial processes. In the industrial sector, coal gasification is extensively used in the production of electric motor systems, petrochemicals, and fertilizers. The petrochemicals sector, in particular, benefits from the use of coal as a feedstock for the synthesis of chemicals.

In contrast, biodegradable materials can also be gasified using the same technology, with coal acting as a supplementary feedstock to enhance the energy output. The resulting tar-free syngas can be further processed to produce Fuel Gas or Feedstock for various applications. Asian countries like China and India, which heavily rely on coal for energy generation, are increasingly adopting coal gasification to reduce emissions and meet their energy demands. China, as the world's largest coal producer since 1985, has shown significant interest in advanced carbon capture technologies, including gasification, to mitigate the environmental impact of coal usage while continuing to meet its energy requirements.

Researchers in China have even proposed a combination of coal and biomass energy to optimize energy production and minimize the carbon footprint.

Our researchers analyzed the data with 2023 as the base year, along with the key drivers, trends, and challenges. A holistic analysis of drivers will help companies refine their marketing strategies to gain a competitive advantage.

Market Driver

Rise in global energy demand is the key driver of the market. The International Energy Agency (IEA) reports a substantial growth in global energy demand over the past decade, driven by economic expansion and increasing demand for chemical products, particularly nitrogenous fertilizers and plastics. By 2040, global energy demand is projected to increase by over 25%, with a growing population expected to reach nine billion. The chemical industry's escalating demand for feedstocks, such as coal, has led to the exploration of alternative gasification technologies like fixed bed, fluidized bed, entrained flow, moving bed, and molten bed. These technologies produce Syngas, a mixture of Carbon Monoxide, Hydrogen, Carbon Dioxide, and Methane, from coal through the reaction of coal, water, and air or oxygen.

The resulting clean hydrogen and electricity generation offer potential for reducing greenhouse gas emissions and addressing water scarcity concerns. Furthermore, coal gasification is crucial for hydrogen generation, chemicals production, including Coal-to-methanol and Coal-to-chemicals projects, steel production, and Ammonia production. However, it's essential to consider the environmental impact, including sulfur dioxide and particulate matter emissions, and implement measures to minimize them. Fossil fuel-based gasification technologies continue to play a significant role in the energy sector, offering low-cost feedstocks for power generation and fuel gas production, contributing to clean energy solutions.

Market Trends

Rise in global coal production is the upcoming trend in the market. Coal gasification is a process that converts coal into Syngas (a mixture of CO, H2, CO2, and CH4) through the reaction of coal with steam, air or oxygen. This process reduces the environmental impact by decreasing sulfur dioxide and particulate matter emissions compared to traditional coal combustion. Various gasification technologies, including fixed bed, fluidized bed, and entrained flow, are used for coal gasification. These technologies are employed in electricity generation, hydrogen production, chemicals manufacturing, and steel production. Underground Coal Gasification (UCG) is a cleaner alternative to conventional coal mining and power generation. It produces Syngas, which can be used for electricity generation, hydrogen production, and the manufacture of chemicals such as methanol, ammonia, and urea.

Coal-to-methanol and coal-to-chemicals projects are gaining popularity due to the potential of coal as a low-cost feedstock. Water scarcity is a significant challenge in coal gasification, as it requires large amounts of water for steam generation. Fluidized bed gasifiers are more water-efficient than other types. Coal reserves in regions like Asia and Southern Africa are vast, making them prime locations for coal gasification projects. China, the US, Australia, India, and Russia are major coal producers, and the relaxation of coal import restrictions in China has stimulated global coal production. Gasification technologies produce clean hydrogen, which is a crucial component in the production of ammonia, fertilizers, and other chemicals.

The CO2 produced during coal gasification can be captured and utilized for various applications, including enhanced oil recovery and carbon capture and storage. The by-products of coal gasification, such as carbon monoxide and hydrogen, can be used as fuel gas or synthetic natural gas. The environmental impact of coal gasification is lower than that of traditional coal combustion due to the reduction of sulfur dioxide and particulate matter emissions. However, the production of Syngas from coal still generates significant amounts of CO2. The use of clean energy sources and carbon capture and storage technologies can help mitigate this environmental concern.

In conclusion, coal gasification is a promising technology for the conversion of coal into valuable products such as electricity, hydrogen, chemicals, and fuels. It offers environmental benefits by reducing sulfur dioxide and particulate matter emissions compared to traditional coal combustion. However, challenges such as water scarcity and carbon dioxide emissions must be addressed to make coal gasification a sustainable and environmentally friendly energy solution.

Market Challenge

Environment concerns for coal gasification is key challenge affecting the market growth. Coal gasification is a process that converts coal into syngas, a mixture of hydrogen, carbon monoxide, carbon dioxide, methane, water vapor, and other impurities. Gasification technologies, including fixed bed, fluidized bed, entrained flow, moving bed, and molten bed, are employed to achieve this conversion. However, the sulfur and nitrogen content in coal pose challenges in this process. Sulfur dioxide and other acid gases are produced due to high temperatures and low oxygen levels in the gasifier. These impurities must be removed using specialized equipment to prevent their release into the environment, as they contribute to particulate matter and have adverse impacts on clean energy generation.

Similarly, nitrogen results in the formation of ammonia and hydrogen cyanide. Coal reserves are abundant, making it a viable option for electricity generation, chemicals production, hydrogen generation, steel production, and fuel gas production. Coal-to-methanol and coal-to-chemicals projects, including urea production, utilize coal gasification. Despite its benefits, environmental impact is a concern, and efforts are underway to minimize carbon dioxide emissions and reduce the production of impurities like carbon monoxide and hydrogen. Coal gasification offers a low-cost feedstock for clean energy and industrial applications, but the environmental impact and the need for pollution control measures are crucial considerations.

Exclusive Customer Landscape

The market forecasting report includes the adoption lifecycle of the market, covering from the innovator's stage to the laggard's stage. It focuses on adoption rates in different regions based on penetration. Furthermore, the report also includes key purchase criteria and drivers of price sensitivity to help companies evaluate and develop their market growth analysis strategies.

Coal Gasification Market Share by Geography

 Customer Landscape

Key Companies & Market Insights

Companies are implementing various strategies, such as strategic alliances, partnerships, mergers and acquisitions, geographical expansion, and product/service launches, to enhance their presence in the market.

Air Liquide SA - The company is committed to providing advanced coal gasification solutions through the implementation of our Rectisol syngas purification technology. This cutting-edge technology enables US to convert coal into synthesis gas (syngas) in an environmentally friendly and efficient manner.

The market research and growth report includes detailed analyses of the competitive landscape of the market and information about key companies, including:

  • Air Products and Chemicals Inc.
  • Basin Electric Power Cooperative
  • CASE GROUP
  • Chiyoda Corp.
  • Ergo Exergy Technologies Inc.
  • Johnson Matthey Plc
  • KBR Inc.
  • Larsen and Toubro Ltd.
  • McDermott International Ltd.
  • Mitsubishi Heavy Industries Ltd.
  • Regius Synfuels Ltd.
  • Sasol Ltd.
  • SEDIN Engineering Co. Ltd. CNCEC
  • Siemens AG
  • Swan Hills Synfuels LLP
  • Synthesis Energy Systems Inc.
  • thyssenkrupp AG
  • Oil and Natural Gas Corp. Ltd.

Qualitative and quantitative analysis of companies has been conducted to help clients understand the wider business environment as well as the strengths and weaknesses of key market players. Data is qualitatively analyzed to categorize companies as pure play, category-focused, industry-focused, and diversified; it is quantitatively analyzed to categorize companies as dominant, leading, strong, tentative, and weak.

Research Analyst Overview

The market is experiencing significant growth due to the increasing demand for syngas, a mixture of carbon monoxide, hydrogen, and other gases, for various applications. Gasification technologies, including fixed bed, fluidized bed, and entrained flow, are used to convert coal into syngas. Sulfur dioxide and particulate matter emissions are minimized through advanced gas cleaning technologies. Syngas is used for electricity generation, chemicals production, hydrogen generation, and steel production. Coal reserves are abundant, making it a cost-effective feedstock for these applications. However, water scarcity is a challenge in some regions, making the availability of water a critical factor in the selection of gasification technologies.

Fluidized bed gasifiers are popular due to their ability to handle a wide range of feedstocks and their lower environmental impact. Coal-to-methanol and coal-to-chemicals projects are gaining traction, with ammonia production and urea production being major applications. Carbon monoxide and hydrogen are separated from the syngas stream for use as fuel gas or for the production of clean hydrogen. Coal gasification also produces carbon dioxide, methane, water vapor, and nitrogen as by-products. The environmental impact of coal gasification is a concern, and efforts are being made to reduce emissions and improve efficiency. Synthetic natural gas and ammonia production are other emerging applications for coal gasification.

Market Scope

Report Coverage

Details

Page number

174

Base year

2023

Historic period

2018-2022

Forecast period

2024-2028

Growth momentum & CAGR

Accelerate at a CAGR of 16.25%

Market growth 2024-2028

USD 14.01 billion

Market structure

Fragmented

YoY growth 2023-2024(%)

15.75

Regional analysis

APAC, Middle East and Africa, North America, Europe, and South America

Performing market contribution

APAC at 78%

Key countries

US, South Africa, China, Australia, and Indonesia

Competitive landscape

Leading Companies, Market Positioning of Companies, Competitive Strategies, and Industry Risks

Key companies profiled

Air Liquide SA, Air Products and Chemicals Inc., Basin Electric Power Cooperative, CASE GROUP, Chiyoda Corp., Ergo Exergy Technologies Inc., Johnson Matthey Plc, KBR Inc., Larsen and Toubro Ltd., McDermott International Ltd., Mitsubishi Heavy Industries Ltd., Regius Synfuels Ltd., Sasol Ltd., SEDIN Engineering Co. Ltd. CNCEC, Siemens AG, Swan Hills Synfuels LLP, Synthesis Energy Systems Inc., thyssenkrupp AG, and Oil and Natural Gas Corp. Ltd.

Market dynamics

Parent market analysis, market growth inducers and obstacles, market forecast, fast-growing and slow-growing segment analysis, COVID-19 impact and recovery analysis and future consumer dynamics, market condition analysis for the forecast period

Customization purview

If our market report has not included the data that you are looking for, you can reach out to our analysts and get segments customized.

Request Free Sample

What are the Key Data Covered in this Market Research and Growth Report?

  • CAGR of the market during the forecast period
  • Detailed information on factors that will drive the market growth and forecasting between 2024 and 2028
  • Precise estimation of the size of the market  and its contribution of the market in focus to the parent market
  • Accurate predictions about upcoming market growth and trends and changes in consumer behaviour
  • Growth of the market across APAC, Middle East and Africa, North America, Europe, and South America
  • Thorough analysis of the market's competitive landscape and detailed information about companies
  • Comprehensive analysis of factors that will challenge the growth of market companies

We can help! Our analysts can customize this market research report to meet your requirements. Get in touch

1 Executive Summary

  • 1.1 Market overview
    • Exhibit 01: Executive Summary – Chart on Market Overview
    • Exhibit 02: Executive Summary – Data Table on Market Overview
    • Exhibit 03: Executive Summary – Chart on Global Market Characteristics
    • Exhibit 04: Executive Summary – Chart on Market by Geography
    • Exhibit 05: Executive Summary – Chart on Market Segmentation by Application
    • Exhibit 06: Executive Summary – Chart on Market Segmentation by Type
    • Exhibit 07: Executive Summary – Chart on Incremental Growth
    • Exhibit 08: Executive Summary – Data Table on Incremental Growth
    • Exhibit 09: Executive Summary – Chart on Vendor Market Positioning

2 Market Landscape

  • 2.1 Market ecosystem
    • Exhibit 10: Parent market
    • Exhibit 11: Market Characteristics

3 Market Sizing

  • 3.1 Market definition
    • Exhibit 12: Offerings of vendors included in the market definition
  • 3.2 Market segment analysis
    • Exhibit 13: Market segments
  • 3.3 Market size 2023
    • 3.4 Market outlook: Forecast for 2023-2028
      • Exhibit 14: Chart on Global - Market size and forecast 2023-2028 ($ million)
      • Exhibit 15: Data Table on Global - Market size and forecast 2023-2028 ($ million)
      • Exhibit 16: Chart on Global Market: Year-over-year growth 2023-2028 (%)
      • Exhibit 17: Data Table on Global Market: Year-over-year growth 2023-2028 (%)

    4 Historic Market Size

    • 4.1 Global coal gasification market 2018 - 2022
      • Exhibit 18: Historic Market Size – Data Table on global coal gasification market 2018 - 2022 ($ million)
    • 4.2 Application Segment Analysis 2018 - 2022
      • Exhibit 19: Historic Market Size – Application Segment 2018 - 2022 ($ million)
    • 4.3 Type Segment Analysis 2018 - 2022
      • Exhibit 20: Historic Market Size – Type Segment 2018 - 2022 ($ million)
    • 4.4 Geography Segment Analysis 2018 - 2022
      • Exhibit 21: Historic Market Size – Geography Segment 2018 - 2022 ($ million)
    • 4.5 Country Segment Analysis 2018 - 2022
      • Exhibit 22: Historic Market Size – Country Segment 2018 - 2022 ($ million)

    5 Five Forces Analysis

    • 5.1 Five forces summary
      • Exhibit 23: Five forces analysis - Comparison between 2023 and 2028
    • 5.2 Bargaining power of buyers
      • Exhibit 24: Chart on Bargaining power of buyers – Impact of key factors 2023 and 2028
    • 5.3 Bargaining power of suppliers
      • Exhibit 25: Bargaining power of suppliers – Impact of key factors in 2023 and 2028
    • 5.4 Threat of new entrants
      • Exhibit 26: Threat of new entrants – Impact of key factors in 2023 and 2028
    • 5.5 Threat of substitutes
      • Exhibit 27: Threat of substitutes – Impact of key factors in 2023 and 2028
    • 5.6 Threat of rivalry
      • Exhibit 28: Threat of rivalry – Impact of key factors in 2023 and 2028
    • 5.7 Market condition
      • Exhibit 29: Chart on Market condition - Five forces 2023 and 2028

    6 Market Segmentation by Application

    • 6.1 Market segments
      • Exhibit 30: Chart on Application - Market share 2023-2028 (%)
      • Exhibit 31: Data Table on Application - Market share 2023-2028 (%)
    • 6.2 Comparison by Application
      • Exhibit 32: Chart on Comparison by Application
      • Exhibit 33: Data Table on Comparison by Application
    • 6.3 Chemicals - Market size and forecast 2023-2028
      • Exhibit 34: Chart on Chemicals - Market size and forecast 2023-2028 ($ million)
      • Exhibit 35: Data Table on Chemicals - Market size and forecast 2023-2028 ($ million)
      • Exhibit 36: Chart on Chemicals - Year-over-year growth 2023-2028 (%)
      • Exhibit 37: Data Table on Chemicals - Year-over-year growth 2023-2028 (%)
    • 6.4 Fuels - Market size and forecast 2023-2028
      • Exhibit 38: Chart on Fuels - Market size and forecast 2023-2028 ($ million)
      • Exhibit 39: Data Table on Fuels - Market size and forecast 2023-2028 ($ million)
      • Exhibit 40: Chart on Fuels - Year-over-year growth 2023-2028 (%)
      • Exhibit 41: Data Table on Fuels - Year-over-year growth 2023-2028 (%)
    • 6.5 Power - Market size and forecast 2023-2028
      • Exhibit 42: Chart on Power - Market size and forecast 2023-2028 ($ million)
      • Exhibit 43: Data Table on Power - Market size and forecast 2023-2028 ($ million)
      • Exhibit 44: Chart on Power - Year-over-year growth 2023-2028 (%)
      • Exhibit 45: Data Table on Power - Year-over-year growth 2023-2028 (%)
    • 6.6 Market opportunity by Application
      • Exhibit 46: Market opportunity by Application ($ million)
      • Exhibit 47: Data Table on Market opportunity by Application ($ million)

    7 Market Segmentation by Type

    • 7.1 Market segments
      • Exhibit 48: Chart on Type - Market share 2023-2028 (%)
      • Exhibit 49: Data Table on Type - Market share 2023-2028 (%)
    • 7.2 Comparison by Type
      • Exhibit 50: Chart on Comparison by Type
      • Exhibit 51: Data Table on Comparison by Type
    • 7.3 Moving bed - Market size and forecast 2023-2028
      • Exhibit 52: Chart on Moving bed - Market size and forecast 2023-2028 ($ million)
      • Exhibit 53: Data Table on Moving bed - Market size and forecast 2023-2028 ($ million)
      • Exhibit 54: Chart on Moving bed - Year-over-year growth 2023-2028 (%)
      • Exhibit 55: Data Table on Moving bed - Year-over-year growth 2023-2028 (%)
    • 7.4 Fluidized bed - Market size and forecast 2023-2028
      • Exhibit 56: Chart on Fluidized bed - Market size and forecast 2023-2028 ($ million)
      • Exhibit 57: Data Table on Fluidized bed - Market size and forecast 2023-2028 ($ million)
      • Exhibit 58: Chart on Fluidized bed - Year-over-year growth 2023-2028 (%)
      • Exhibit 59: Data Table on Fluidized bed - Year-over-year growth 2023-2028 (%)
    • 7.5 Entrained bed - Market size and forecast 2023-2028
      • Exhibit 60: Chart on Entrained bed - Market size and forecast 2023-2028 ($ million)
      • Exhibit 61: Data Table on Entrained bed - Market size and forecast 2023-2028 ($ million)
      • Exhibit 62: Chart on Entrained bed - Year-over-year growth 2023-2028 (%)
      • Exhibit 63: Data Table on Entrained bed - Year-over-year growth 2023-2028 (%)
    • 7.6 Molten bed - Market size and forecast 2023-2028
      • Exhibit 64: Chart on Molten bed - Market size and forecast 2023-2028 ($ million)
      • Exhibit 65: Data Table on Molten bed - Market size and forecast 2023-2028 ($ million)
      • Exhibit 66: Chart on Molten bed - Year-over-year growth 2023-2028 (%)
      • Exhibit 67: Data Table on Molten bed - Year-over-year growth 2023-2028 (%)
    • 7.7 Market opportunity by Type
      • Exhibit 68: Market opportunity by Type ($ million)
      • Exhibit 69: Data Table on Market opportunity by Type ($ million)

    8 Customer Landscape

    • 8.1 Customer landscape overview
      • Exhibit 70: Analysis of price sensitivity, lifecycle, customer purchase basket, adoption rates, and purchase criteria

    9 Geographic Landscape

    • 9.1 Geographic segmentation
      • Exhibit 71: Chart on Market share by geography 2023-2028 (%)
      • Exhibit 72: Data Table on Market share by geography 2023-2028 (%)
    • 9.2 Geographic comparison
      • Exhibit 73: Chart on Geographic comparison
      • Exhibit 74: Data Table on Geographic comparison
    • 9.3 APAC - Market size and forecast 2023-2028
      • Exhibit 75: Chart on APAC - Market size and forecast 2023-2028 ($ million)
      • Exhibit 76: Data Table on APAC - Market size and forecast 2023-2028 ($ million)
      • Exhibit 77: Chart on APAC - Year-over-year growth 2023-2028 (%)
      • Exhibit 78: Data Table on APAC - Year-over-year growth 2023-2028 (%)
    • 9.4 Middle East and Africa - Market size and forecast 2023-2028
      • Exhibit 79: Chart on Middle East and Africa - Market size and forecast 2023-2028 ($ million)
      • Exhibit 80: Data Table on Middle East and Africa - Market size and forecast 2023-2028 ($ million)
      • Exhibit 81: Chart on Middle East and Africa - Year-over-year growth 2023-2028 (%)
      • Exhibit 82: Data Table on Middle East and Africa - Year-over-year growth 2023-2028 (%)
    • 9.5 North America - Market size and forecast 2023-2028
      • Exhibit 83: Chart on North America - Market size and forecast 2023-2028 ($ million)
      • Exhibit 84: Data Table on North America - Market size and forecast 2023-2028 ($ million)
      • Exhibit 85: Chart on North America - Year-over-year growth 2023-2028 (%)
      • Exhibit 86: Data Table on North America - Year-over-year growth 2023-2028 (%)
    • 9.6 Europe - Market size and forecast 2023-2028
      • Exhibit 87: Chart on Europe - Market size and forecast 2023-2028 ($ million)
      • Exhibit 88: Data Table on Europe - Market size and forecast 2023-2028 ($ million)
      • Exhibit 89: Chart on Europe - Year-over-year growth 2023-2028 (%)
      • Exhibit 90: Data Table on Europe - Year-over-year growth 2023-2028 (%)
    • 9.7 South America - Market size and forecast 2023-2028
      • Exhibit 91: Chart on South America - Market size and forecast 2023-2028 ($ million)
      • Exhibit 92: Data Table on South America - Market size and forecast 2023-2028 ($ million)
      • Exhibit 93: Chart on South America - Year-over-year growth 2023-2028 (%)
      • Exhibit 94: Data Table on South America - Year-over-year growth 2023-2028 (%)
    • 9.8 China - Market size and forecast 2023-2028
      • Exhibit 95: Chart on China - Market size and forecast 2023-2028 ($ million)
      • Exhibit 96: Data Table on China - Market size and forecast 2023-2028 ($ million)
      • Exhibit 97: Chart on China - Year-over-year growth 2023-2028 (%)
      • Exhibit 98: Data Table on China - Year-over-year growth 2023-2028 (%)
    • 9.9 Australia - Market size and forecast 2023-2028
      • Exhibit 99: Chart on Australia - Market size and forecast 2023-2028 ($ million)
      • Exhibit 100: Data Table on Australia - Market size and forecast 2023-2028 ($ million)
      • Exhibit 101: Chart on Australia - Year-over-year growth 2023-2028 (%)
      • Exhibit 102: Data Table on Australia - Year-over-year growth 2023-2028 (%)
    • 9.10 Indonesia - Market size and forecast 2023-2028
      • Exhibit 103: Chart on Indonesia - Market size and forecast 2023-2028 ($ million)
      • Exhibit 104: Data Table on Indonesia - Market size and forecast 2023-2028 ($ million)
      • Exhibit 105: Chart on Indonesia - Year-over-year growth 2023-2028 (%)
      • Exhibit 106: Data Table on Indonesia - Year-over-year growth 2023-2028 (%)
    • 9.11 South Africa - Market size and forecast 2023-2028
      • Exhibit 107: Chart on South Africa - Market size and forecast 2023-2028 ($ million)
      • Exhibit 108: Data Table on South Africa - Market size and forecast 2023-2028 ($ million)
      • Exhibit 109: Chart on South Africa - Year-over-year growth 2023-2028 (%)
      • Exhibit 110: Data Table on South Africa - Year-over-year growth 2023-2028 (%)
    • 9.12 US - Market size and forecast 2023-2028
      • Exhibit 111: Chart on US - Market size and forecast 2023-2028 ($ million)
      • Exhibit 112: Data Table on US - Market size and forecast 2023-2028 ($ million)
      • Exhibit 113: Chart on US - Year-over-year growth 2023-2028 (%)
      • Exhibit 114: Data Table on US - Year-over-year growth 2023-2028 (%)
    • 9.13 Market opportunity by geography
      • Exhibit 115: Market opportunity by geography ($ million)
      • Exhibit 116: Data Tables on Market opportunity by geography ($ million)

    10 Drivers, Challenges, and Trends

    • 10.1 Market drivers
      • 10.2 Market challenges
        • 10.3 Impact of drivers and challenges
          • Exhibit 117: Impact of drivers and challenges in 2023 and 2028
        • 10.4 Market trends

          11 Vendor Landscape

          • 11.1 Overview
            • 11.2 Vendor landscape
              • Exhibit 118: Overview on Criticality of inputs and Factors of differentiation
            • 11.3 Landscape disruption
              • Exhibit 119: Overview on factors of disruption
            • 11.4 Industry risks
              • Exhibit 120: Impact of key risks on business

            12 Vendor Analysis

            • 12.1 Vendors covered
              • Exhibit 121: Vendors covered
            • 12.2 Market positioning of vendors
              • Exhibit 122: Matrix on vendor position and classification
            • 12.3 Air Liquide SA
              • Exhibit 123: Air Liquide SA - Overview
              • Exhibit 124: Air Liquide SA - Business segments
              • Exhibit 125: Air Liquide SA - Key offerings
              • Exhibit 126: Air Liquide SA - Segment focus
            • 12.4 Air Products and Chemicals Inc.
              • Exhibit 127: Air Products and Chemicals Inc. - Overview
              • Exhibit 128: Air Products and Chemicals Inc. - Business segments
              • Exhibit 129: Air Products and Chemicals Inc. - Key news
              • Exhibit 130: Air Products and Chemicals Inc. - Key offerings
              • Exhibit 131: Air Products and Chemicals Inc. - Segment focus
            • 12.5 Basin Electric Power Cooperative
              • Exhibit 132: Basin Electric Power Cooperative - Overview
              • Exhibit 133: Basin Electric Power Cooperative - Product / Service
              • Exhibit 134: Basin Electric Power Cooperative - Key offerings
            • 12.6 Chiyoda Corp.
              • Exhibit 135: Chiyoda Corp. - Overview
              • Exhibit 136: Chiyoda Corp. - Business segments
              • Exhibit 137: Chiyoda Corp. - Key offerings
              • Exhibit 138: Chiyoda Corp. - Segment focus
            • 12.7 Ergo Exergy Technologies Inc.
              • Exhibit 139: Ergo Exergy Technologies Inc. - Overview
              • Exhibit 140: Ergo Exergy Technologies Inc. - Product / Service
              • Exhibit 141: Ergo Exergy Technologies Inc. - Key offerings
            • 12.8 Johnson Matthey Plc
              • Exhibit 142: Johnson Matthey Plc - Overview
              • Exhibit 143: Johnson Matthey Plc - Business segments
              • Exhibit 144: Johnson Matthey Plc - Key offerings
              • Exhibit 145: Johnson Matthey Plc - Segment focus
            • 12.9 KBR Inc.
              • Exhibit 146: KBR Inc. - Overview
              • Exhibit 147: KBR Inc. - Business segments
              • Exhibit 148: KBR Inc. - Key news
              • Exhibit 149: KBR Inc. - Key offerings
              • Exhibit 150: KBR Inc. - Segment focus
            • 12.10 McDermott International Ltd.
              • Exhibit 151: McDermott International Ltd. - Overview
              • Exhibit 152: McDermott International Ltd. - Product / Service
              • Exhibit 153: McDermott International Ltd. - Key news
              • Exhibit 154: McDermott International Ltd. - Key offerings
            • 12.11 Mitsubishi Heavy Industries Ltd.
              • Exhibit 155: Mitsubishi Heavy Industries Ltd. - Overview
              • Exhibit 156: Mitsubishi Heavy Industries Ltd. - Business segments
              • Exhibit 157: Mitsubishi Heavy Industries Ltd. - Key news
              • Exhibit 158: Mitsubishi Heavy Industries Ltd. - Key offerings
              • Exhibit 159: Mitsubishi Heavy Industries Ltd. - Segment focus
            • 12.12 Regius Synfuels Ltd.
              • Exhibit 160: Regius Synfuels Ltd. - Overview
              • Exhibit 161: Regius Synfuels Ltd. - Product / Service
              • Exhibit 162: Regius Synfuels Ltd. - Key offerings
            • 12.13 SEDIN Engineering Co. Ltd. CNCEC
              • Exhibit 163: SEDIN Engineering Co. Ltd. CNCEC - Overview
              • Exhibit 164: SEDIN Engineering Co. Ltd. CNCEC - Product / Service
              • Exhibit 165: SEDIN Engineering Co. Ltd. CNCEC - Key offerings
            • 12.14 Siemens AG
              • Exhibit 166: Siemens AG - Overview
              • Exhibit 167: Siemens AG - Business segments
              • Exhibit 168: Siemens AG - Key news
              • Exhibit 169: Siemens AG - Key offerings
              • Exhibit 170: Siemens AG - Segment focus
            • 12.15 Swan Hills Synfuels LLP
              • Exhibit 171: Swan Hills Synfuels LLP - Overview
              • Exhibit 172: Swan Hills Synfuels LLP - Product / Service
              • Exhibit 173: Swan Hills Synfuels LLP - Key offerings
            • 12.16 Synthesis Energy Systems Inc.
              • Exhibit 174: Synthesis Energy Systems Inc. - Overview
              • Exhibit 175: Synthesis Energy Systems Inc. - Product / Service
              • Exhibit 176: Synthesis Energy Systems Inc. - Key offerings
            • 12.17 thyssenkrupp AG
              • Exhibit 177: thyssenkrupp AG - Overview
              • Exhibit 178: thyssenkrupp AG - Business segments
              • Exhibit 179: thyssenkrupp AG - Key offerings
              • Exhibit 180: thyssenkrupp AG - Segment focus

            13 Appendix

            • 13.1 Scope of the report
              • 13.2 Inclusions and exclusions checklist
                • Exhibit 181: Inclusions checklist
                • Exhibit 182: Exclusions checklist
              • 13.3 Currency conversion rates for US$
                • Exhibit 183: Currency conversion rates for US$
              • 13.4 Research methodology
                • Exhibit 184: Research methodology
                • Exhibit 185: Validation techniques employed for market sizing
                • Exhibit 186: Information sources
              • 13.5 List of abbreviations
                • Exhibit 187: List of abbreviations

              Research Methodology

              Technavio presents a detailed picture of the market by way of study, synthesis, and summation of data from multiple sources. The analysts have presented the various facets of the market with a particular focus on identifying the key industry influencers. The data thus presented is comprehensive, reliable, and the result of extensive research, both primary and secondary.

              INFORMATION SOURCES

              Primary sources

              • Manufacturers and suppliers
              • Channel partners
              • Industry experts
              • Strategic decision makers

              Secondary sources

              • Industry journals and periodicals
              • Government data
              • Financial reports of key industry players
              • Historical data
              • Press releases

              DATA ANALYSIS

              Data Synthesis

              • Collation of data
              • Estimation of key figures
              • Analysis of derived insights

              Data Validation

              • Triangulation with data models
              • Reference against proprietary databases
              • Corroboration with industry experts

              REPORT WRITING

              Qualitative

              • Market drivers
              • Market challenges
              • Market trends
              • Five forces analysis

              Quantitative

              • Market size and forecast
              • Market segmentation
              • Geographical insights
              • Competitive landscape

              Interested in this report?

              Get your sample now to see our research methodology and insights!

              Download Now

              Frequently Asked Questions

              Coal Gasification market growth will increase by $ 14016.1 mn during 2024-2028 .

              The Coal Gasification market is expected to grow at a CAGR of 16.25% during 2024-2028 .

              Coal Gasification market is segmented by Application( Chemicals, Fuels, Power) Type( Moving bed, Fluidized bed, Entrained bed, Molten bed, South America)

              Air Liquide SA, Air Products and Chemicals Inc., Basin Electric Power Cooperative, CASE GROUP, Chiyoda Corp., Ergo Exergy Technologies Inc., Johnson Matthey Plc, KBR Inc., Larsen and Toubro Ltd., McDermott International Ltd., Mitsubishi Heavy Industries Ltd., Regius Synfuels Ltd., Sasol Ltd., SEDIN Engineering Co. Ltd. CNCEC, Siemens AG, Swan Hills Synfuels LLP, Synthesis Energy Systems Inc., thyssenkrupp AG, Oil and Natural Gas Corp. Ltd. are a few of the key vendors in the Coal Gasification market.

              APAC will register the highest growth rate of 78% among the other regions. Therefore, the Coal Gasification market in APAC is expected to garner significant business opportunities for the vendors during the forecast period.

              US, South Africa, China, Australia, Indonesia

              • Rise in global energy demandAccording to the IEA is the driving factor this market.
              • there was a significant growth in global energy demand in the past decade owing to robust economic growth. According to the IEA is the driving factor this market.
              • the demand for chemical products has been increasing substantially over the past two decades. The demand for chemical products is primarily driven by the demand for nitrogenous fertilizers and plastics. Moreover is the driving factor this market.
              • there has been significant growth in the demand for electricity across the world. According to the IEA is the driving factor this market.
              • global electricity demand increased two-fold during the past two decades. By 2040 is the driving factor this market.
              • global energy demand is expected to grow by more than 25%. Additionally is the driving factor this market.
              • the global population is expected to reach over nine billion by 2040. Hence is the driving factor this market.
              • with the growth in population and economic activities is the driving factor this market.
              • the demand for electricity is expected to grow significantly during the forecast period. Also is the driving factor this market.
              • the demand for energy services like air conditioning is expected to grow is the driving factor this market.
              • particularly in the residential sector is the driving factor this market.
              • in tandem with the growth in disposable income levels. Moreover is the driving factor this market.
              • the use of electric motor systems in industries is also responsible for the growth in energy demand from the industrial sector. Hence is the driving factor this market.
              • with the growth in energy demand worldwide is the driving factor this market.
              • the global coal gasification market is expected to grow during the forecast period. is the driving factor this market.

              The Coal Gasification market vendors should focus on grabbing business opportunities from the Chemicals segment as it accounted for the largest market share in the base year.